
|
|||||
|
 | |
| |
| |
| |
| |
| |
|
Gene: CRIP1 |
Gene summary for CRIP1 |
| Gene information | Species | Human | Gene symbol | CRIP1 | Gene ID | 1396 |
| Gene name | cysteine rich protein 1 | |
| Gene Alias | CRHP | |
| Cytomap | 14q32.33 | |
| Gene Type | protein-coding | GO ID | GO:0000003 | UniProtAcc | P50238 |
Top |
Malignant transformation analysis |
| Identification of the aberrant gene expression in precancerous and cancerous lesions by comparing the gene expression of stem-like cells in diseased tissues with normal stem cells |
| Entrez ID | Symbol | Replicates | Species | Organ | Tissue | Adj P-value | Log2FC | Malignancy |
| 1396 | CRIP1 | GSM4909287 | Human | Breast | IDC | 1.96e-07 | 3.17e-01 | 0.2057 |
| 1396 | CRIP1 | GSM4909289 | Human | Breast | IDC | 4.59e-13 | 8.46e-01 | 0.1064 |
| 1396 | CRIP1 | GSM4909290 | Human | Breast | IDC | 1.24e-95 | 1.65e+00 | 0.2096 |
| 1396 | CRIP1 | GSM4909293 | Human | Breast | IDC | 8.65e-42 | 7.39e-01 | 0.1581 |
| 1396 | CRIP1 | GSM4909294 | Human | Breast | IDC | 2.97e-21 | 7.03e-01 | 0.2022 |
| 1396 | CRIP1 | GSM4909295 | Human | Breast | IDC | 2.87e-07 | 4.80e-01 | 0.0898 |
| 1396 | CRIP1 | GSM4909296 | Human | Breast | IDC | 2.46e-106 | 1.73e+00 | 0.1524 |
| 1396 | CRIP1 | GSM4909297 | Human | Breast | IDC | 7.02e-07 | 4.21e-01 | 0.1517 |
| 1396 | CRIP1 | GSM4909301 | Human | Breast | IDC | 3.22e-136 | 1.75e+00 | 0.1577 |
| 1396 | CRIP1 | GSM4909302 | Human | Breast | IDC | 5.62e-53 | 1.09e+00 | 0.1545 |
| 1396 | CRIP1 | GSM4909303 | Human | Breast | IDC | 1.66e-05 | 5.34e-01 | 0.0438 |
| 1396 | CRIP1 | GSM4909304 | Human | Breast | IDC | 4.37e-102 | 1.32e+00 | 0.1636 |
| 1396 | CRIP1 | GSM4909305 | Human | Breast | IDC | 5.81e-15 | 4.88e-01 | 0.0436 |
| 1396 | CRIP1 | GSM4909306 | Human | Breast | IDC | 2.60e-52 | 1.02e+00 | 0.1564 |
| 1396 | CRIP1 | GSM4909307 | Human | Breast | IDC | 6.43e-20 | 5.89e-01 | 0.1569 |
| 1396 | CRIP1 | GSM4909308 | Human | Breast | IDC | 3.87e-02 | 1.36e-01 | 0.158 |
| 1396 | CRIP1 | GSM4909309 | Human | Breast | IDC | 1.44e-16 | 7.14e-01 | 0.0483 |
| 1396 | CRIP1 | GSM4909311 | Human | Breast | IDC | 2.56e-44 | 1.14e+00 | 0.1534 |
| 1396 | CRIP1 | GSM4909312 | Human | Breast | IDC | 5.70e-52 | 1.16e+00 | 0.1552 |
| 1396 | CRIP1 | GSM4909313 | Human | Breast | IDC | 9.10e-42 | 1.23e+00 | 0.0391 |
| Page: 1 2 3 4 5 6 7 8 9 10 11 12 |
| Tissue | Expression Dynamics | Abbreviation |
| Breast | 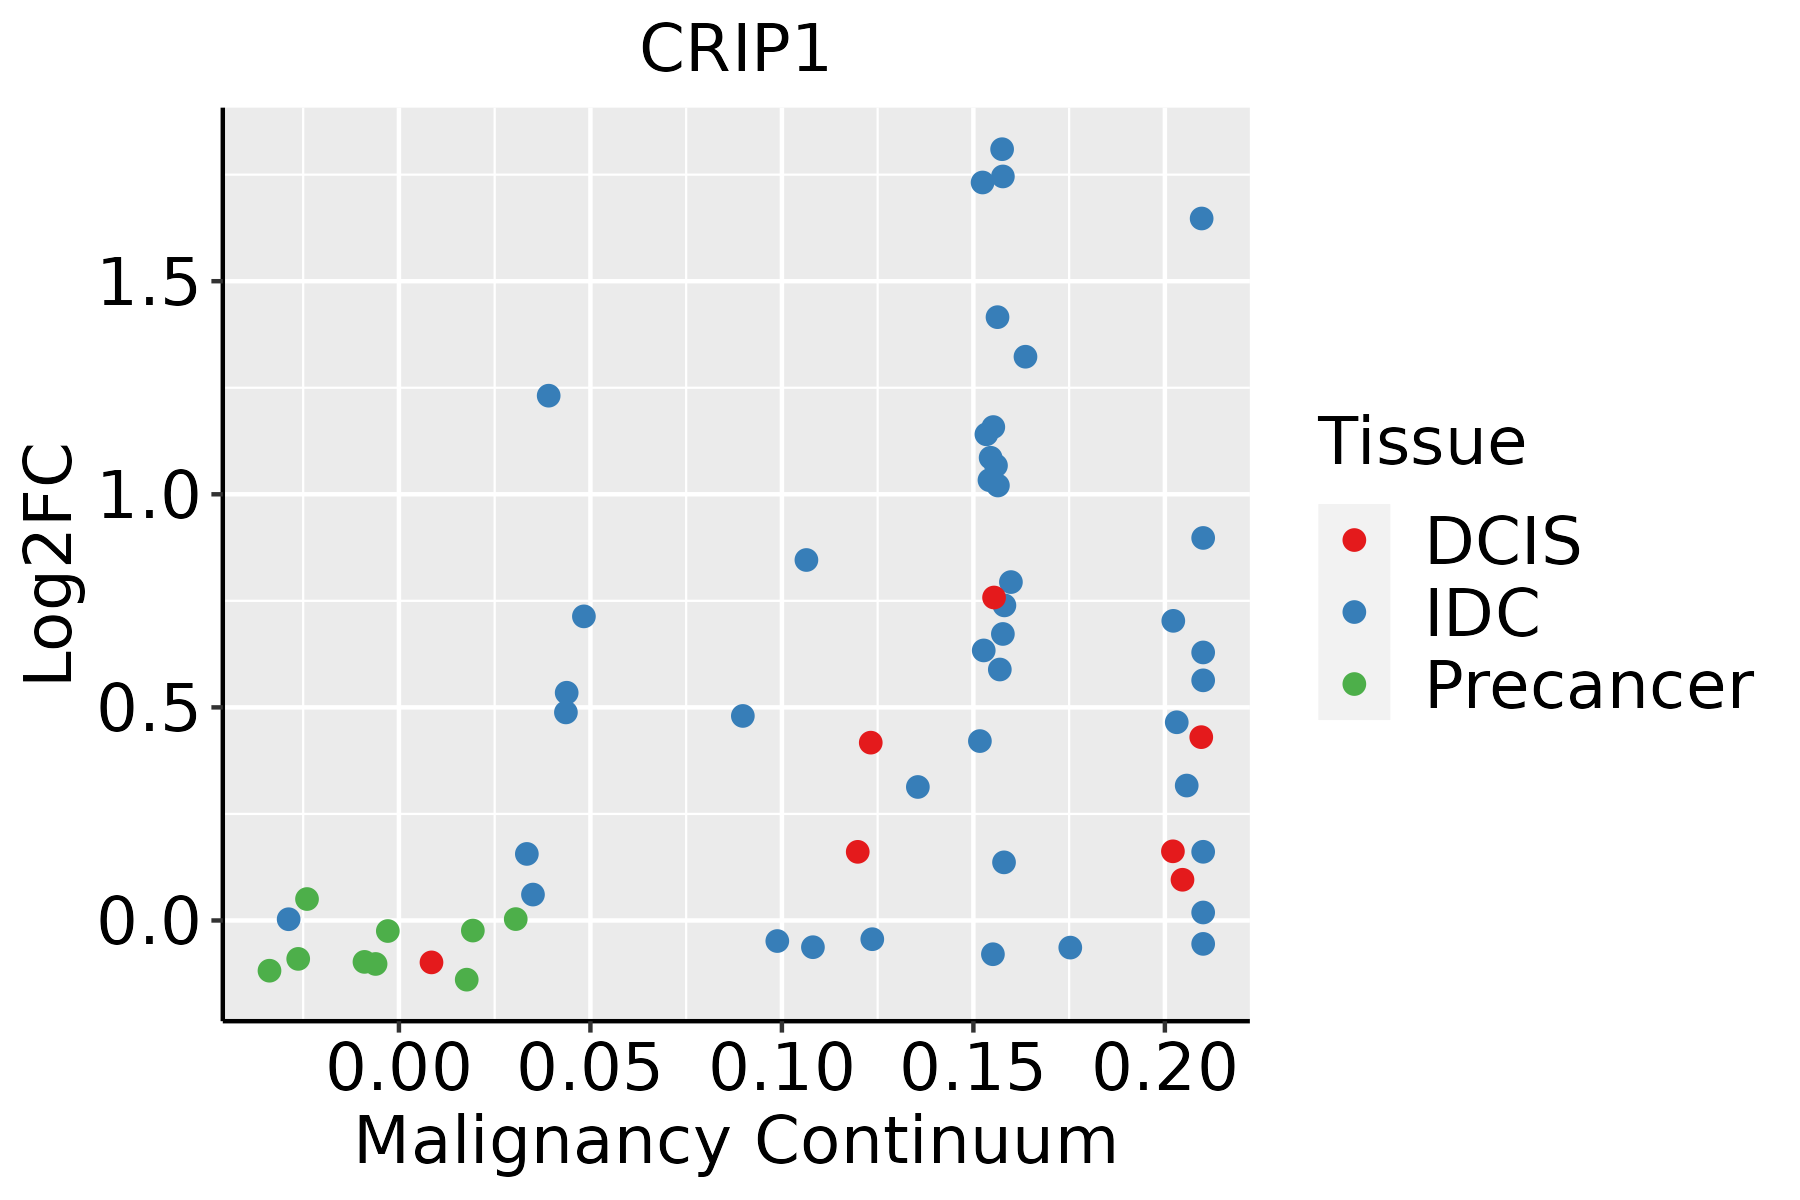 | IDC: Invasive ductal carcinoma |
| DCIS: Ductal carcinoma in situ | ||
| Precancer(BRCA1-mut): Precancerous lesion from BRCA1 mutation carriers | ||
| Cervix | 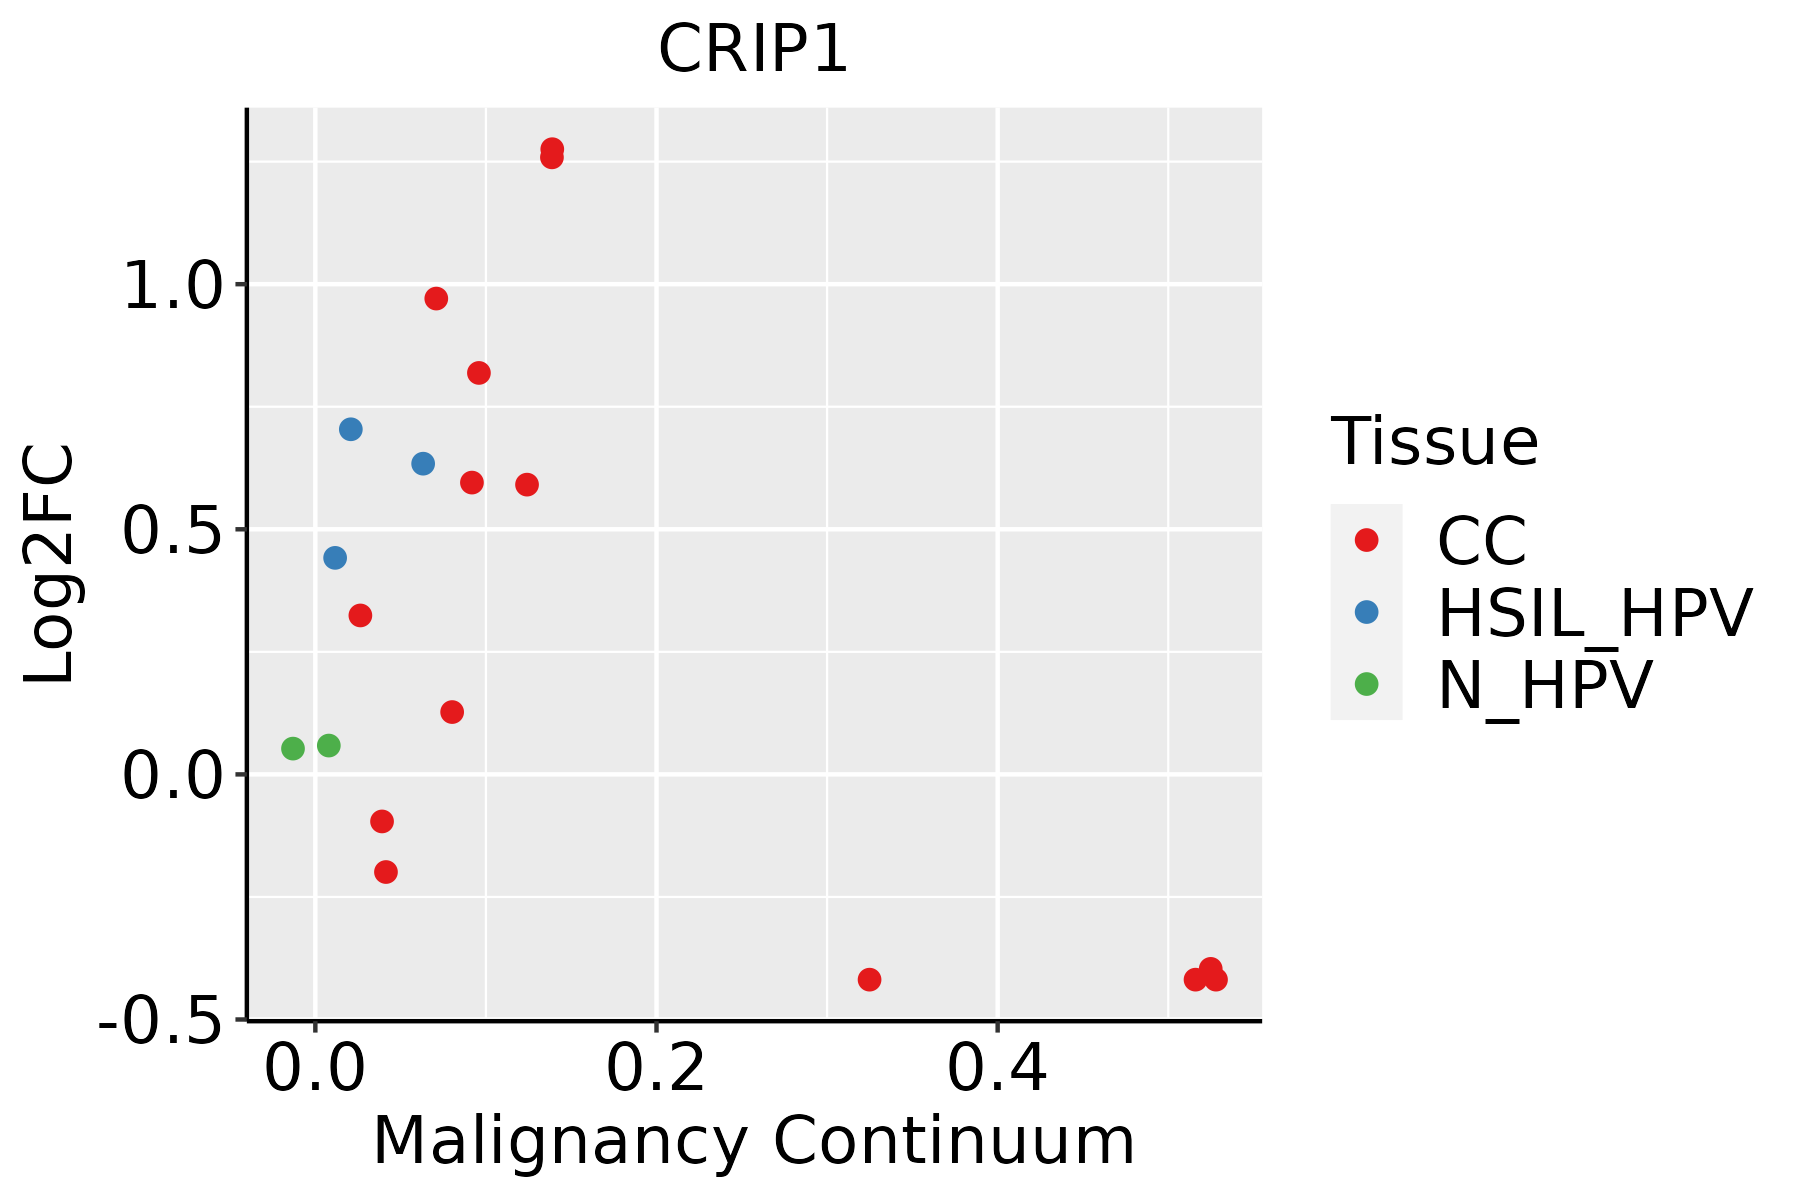 | CC: Cervix cancer |
| HSIL_HPV: HPV-infected high-grade squamous intraepithelial lesions | ||
| N_HPV: HPV-infected normal cervix | ||
| Endometrium | 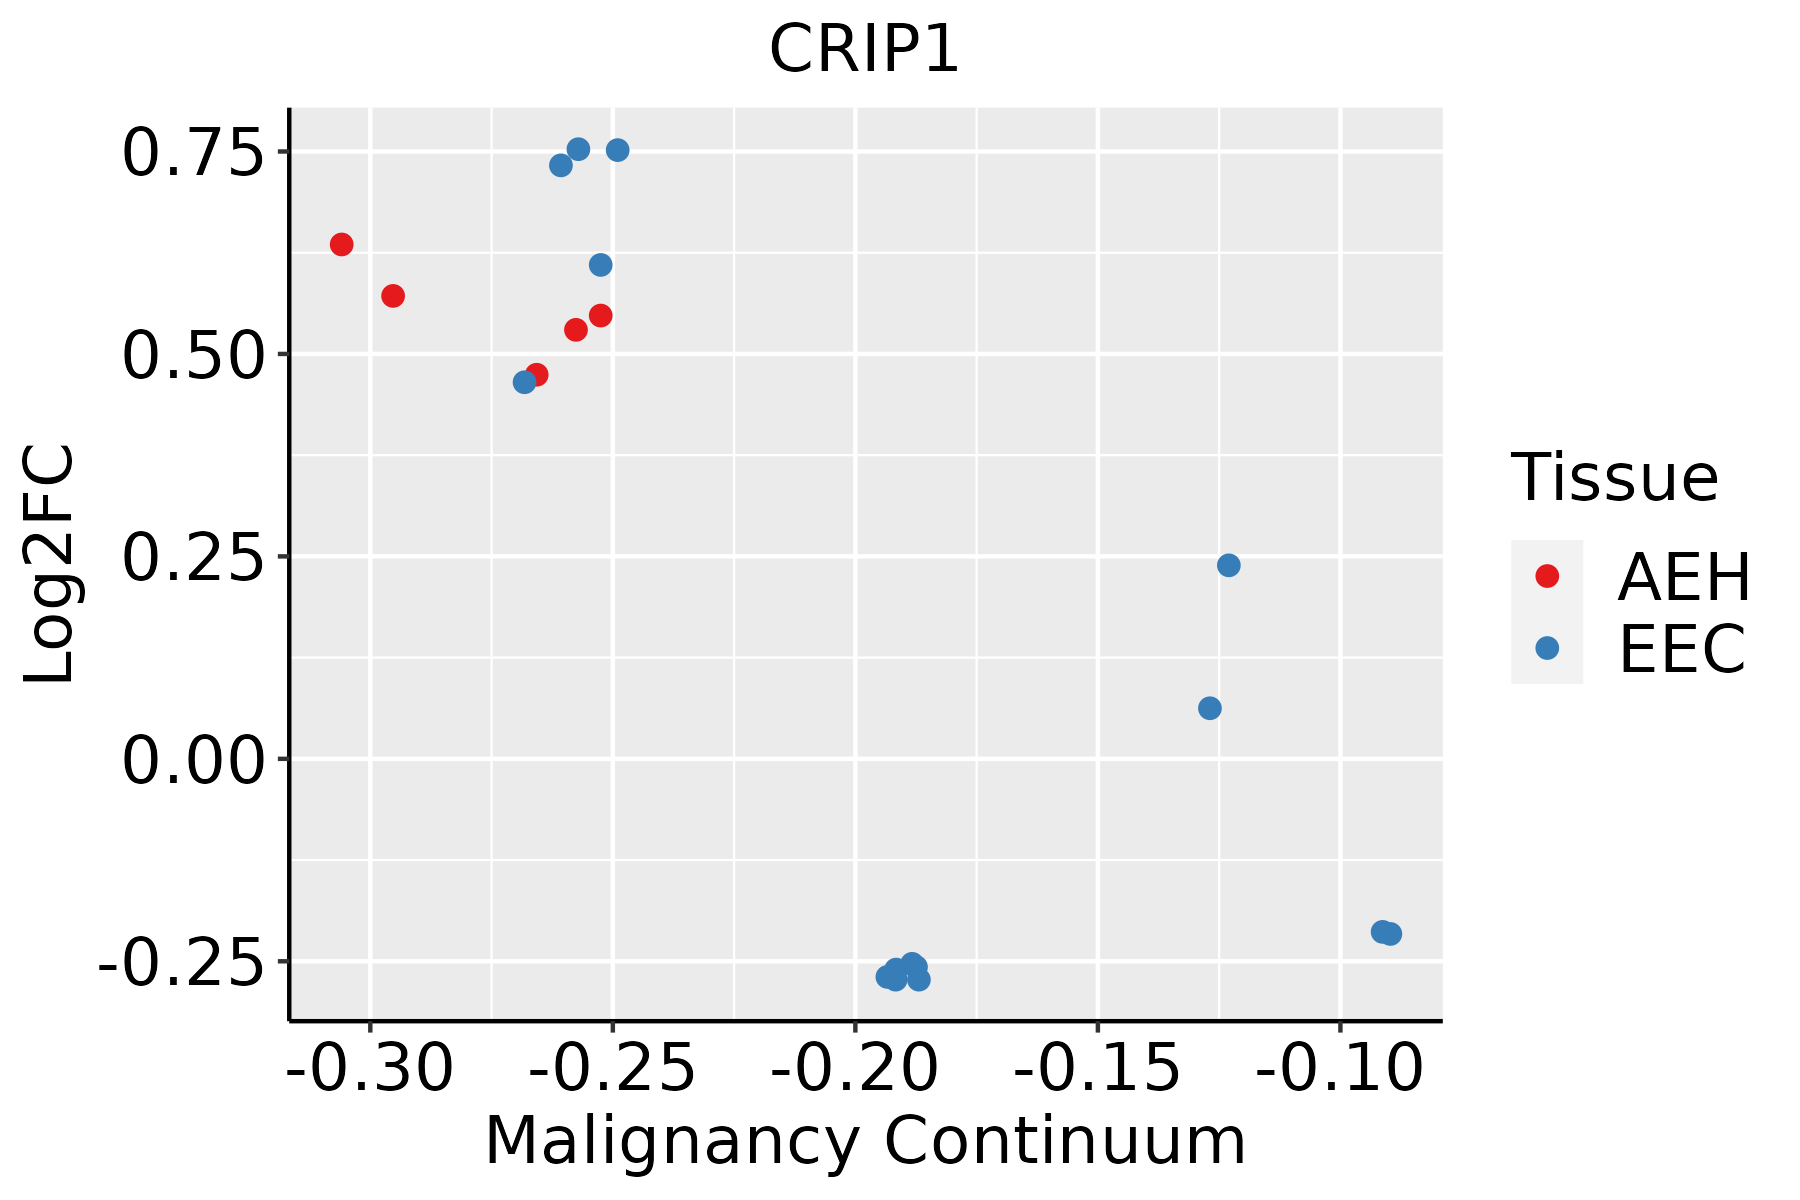 | AEH: Atypical endometrial hyperplasia |
| EEC: Endometrioid Cancer | ||
| Esophagus | 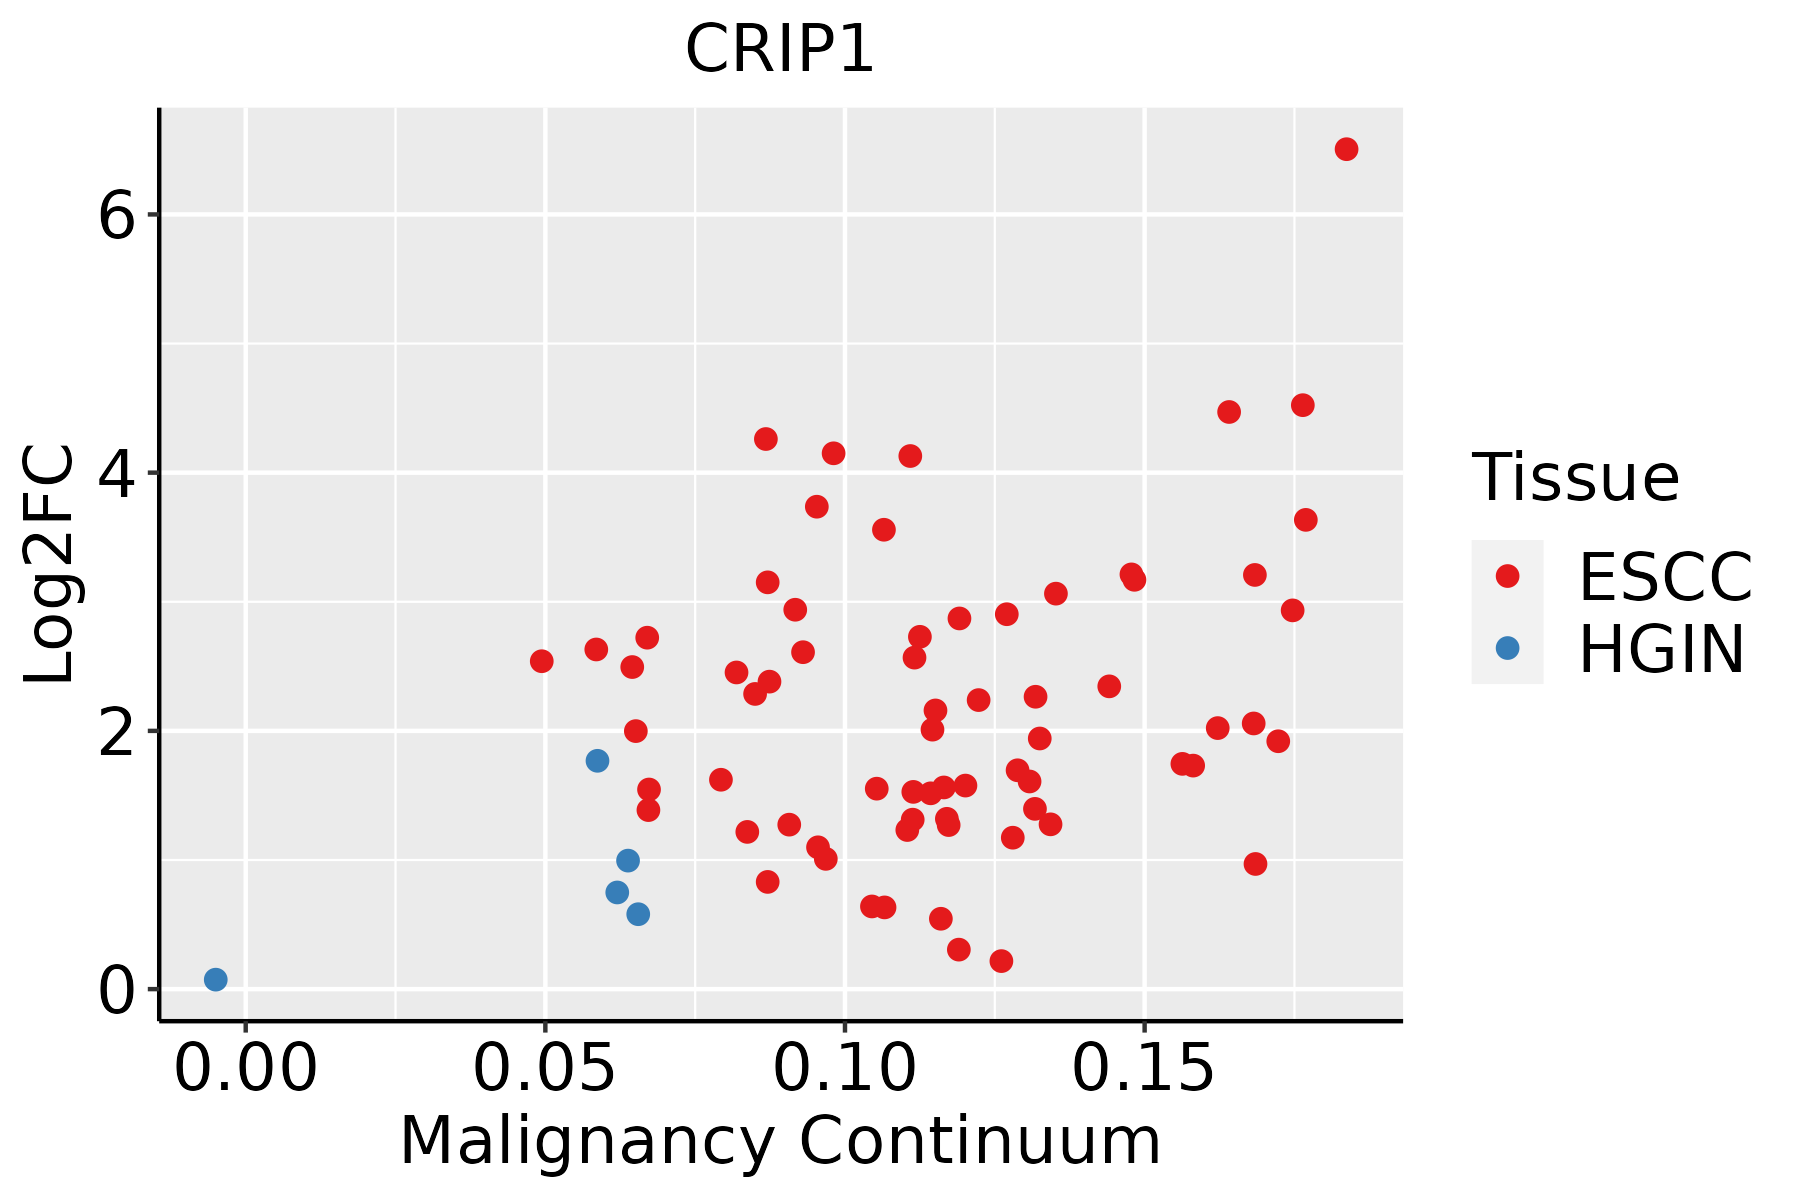 | ESCC: Esophageal squamous cell carcinoma |
| HGIN: High-grade intraepithelial neoplasias | ||
| LGIN: Low-grade intraepithelial neoplasias | ||
| GC | 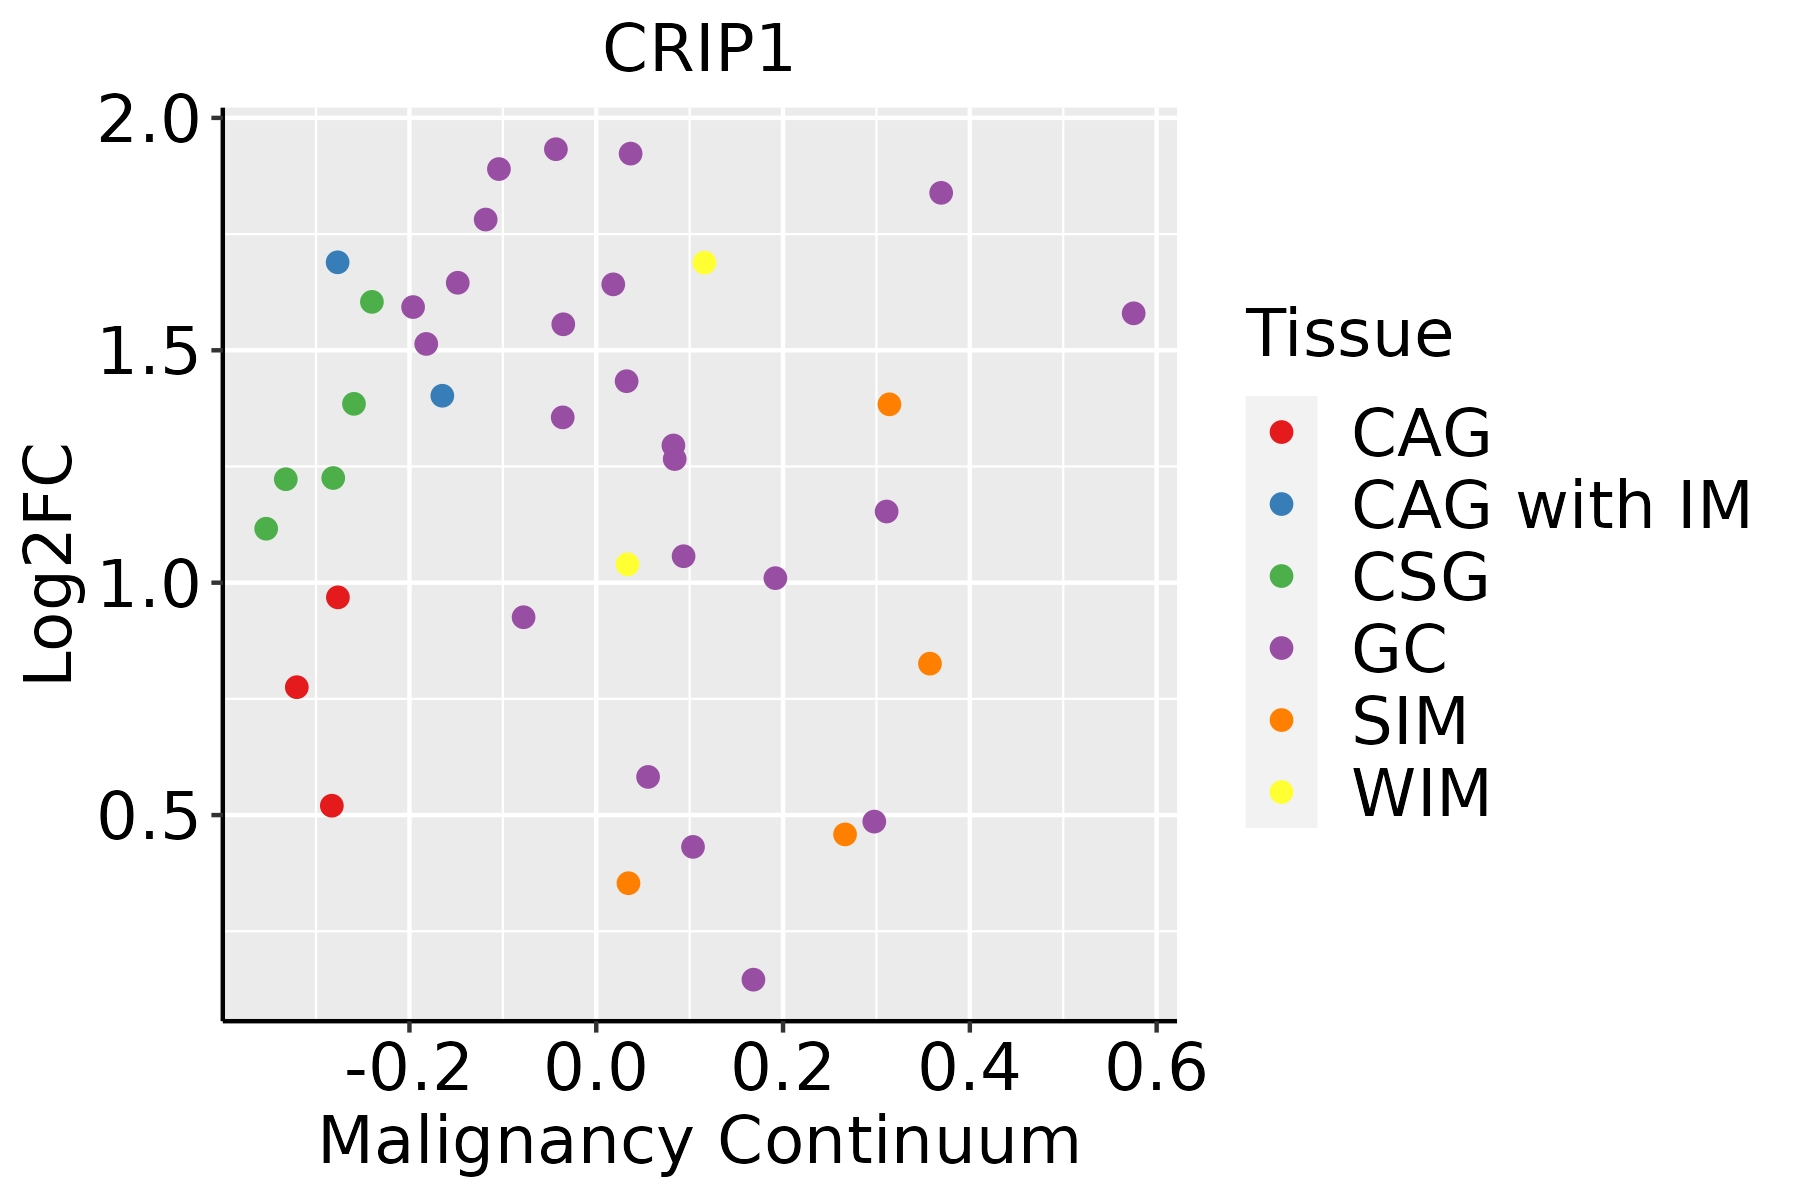 | CAG: Chronic atrophic gastritis |
| CAG with IM: Chronic atrophic gastritis with intestinal metaplasia | ||
| CSG: Chronic superficial gastritis | ||
| GC: Gastric cancer | ||
| SIM: Severe intestinal metaplasia | ||
| WIM: Wild intestinal metaplasia | ||
| Liver | 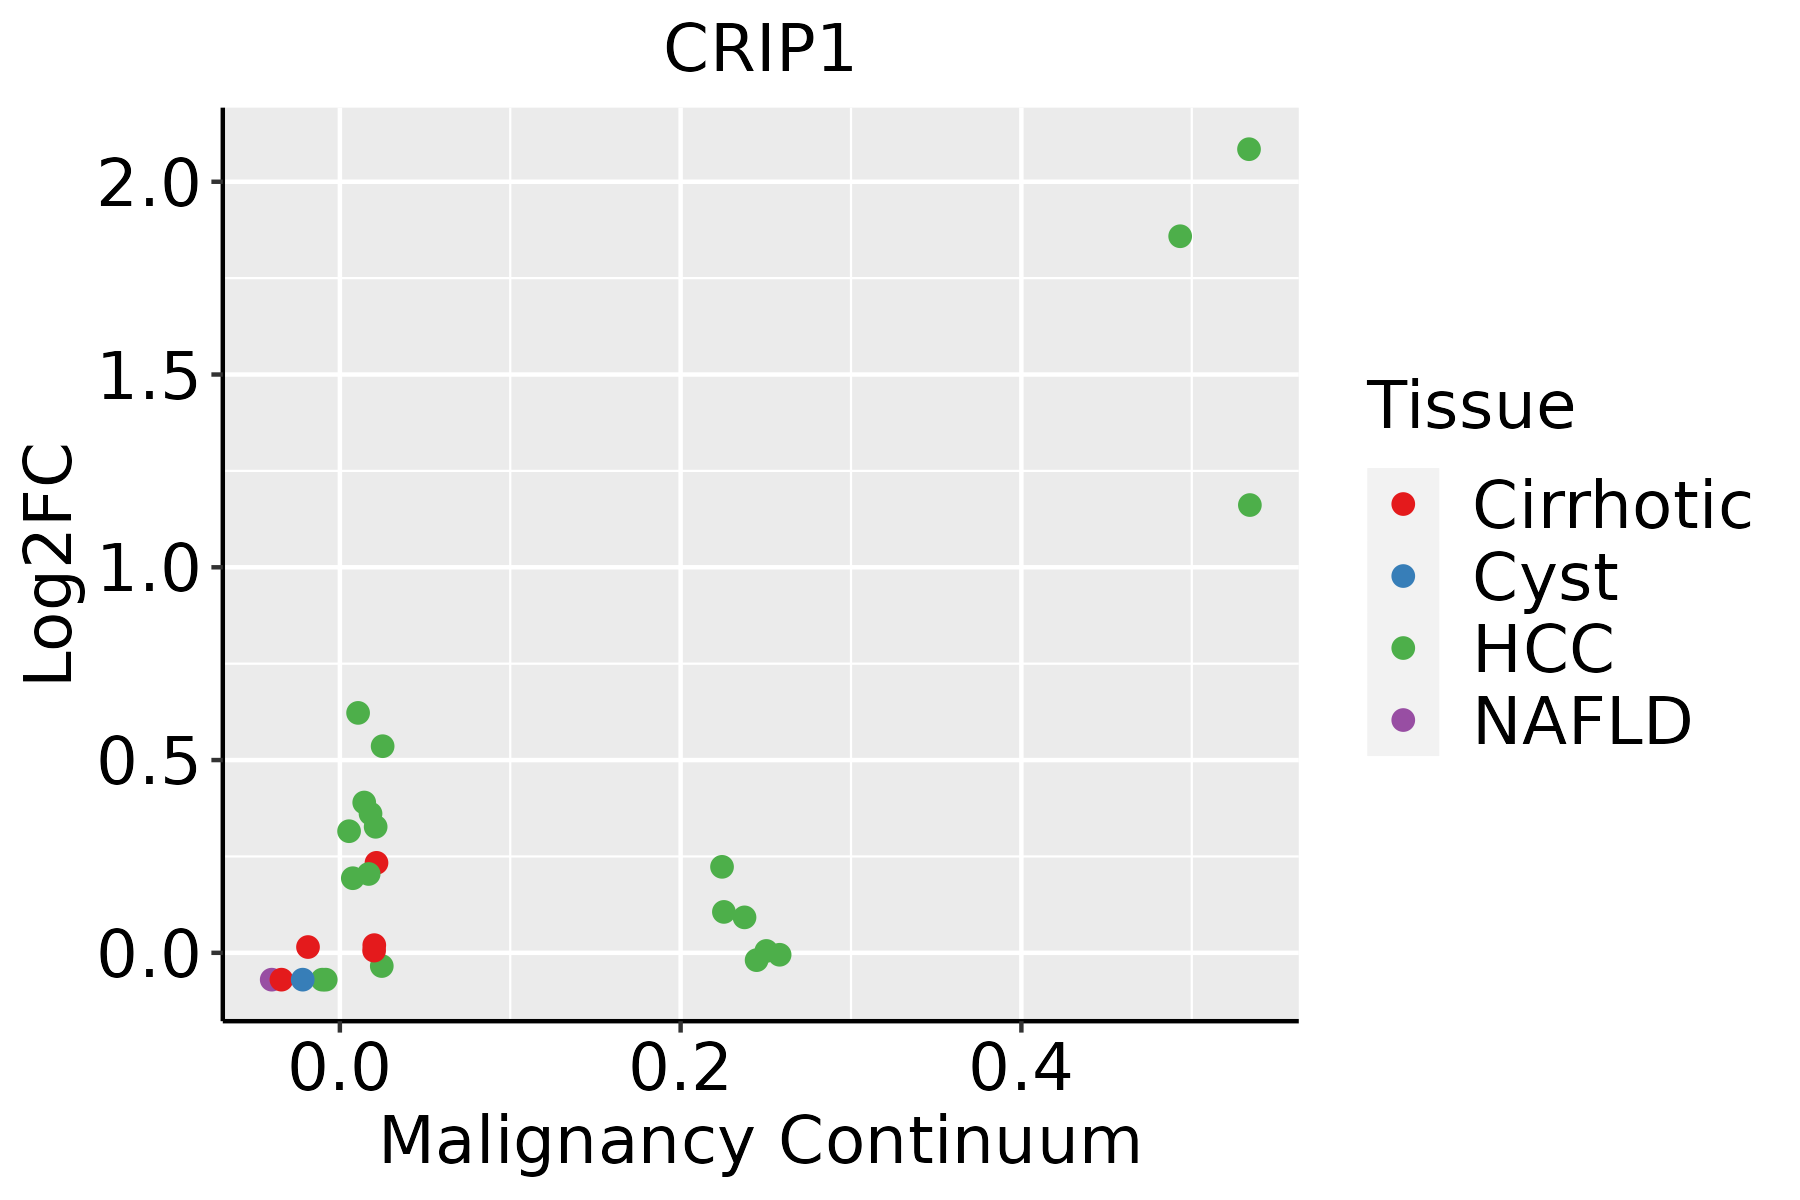 | HCC: Hepatocellular carcinoma |
| NAFLD: Non-alcoholic fatty liver disease | ||
| Lung | 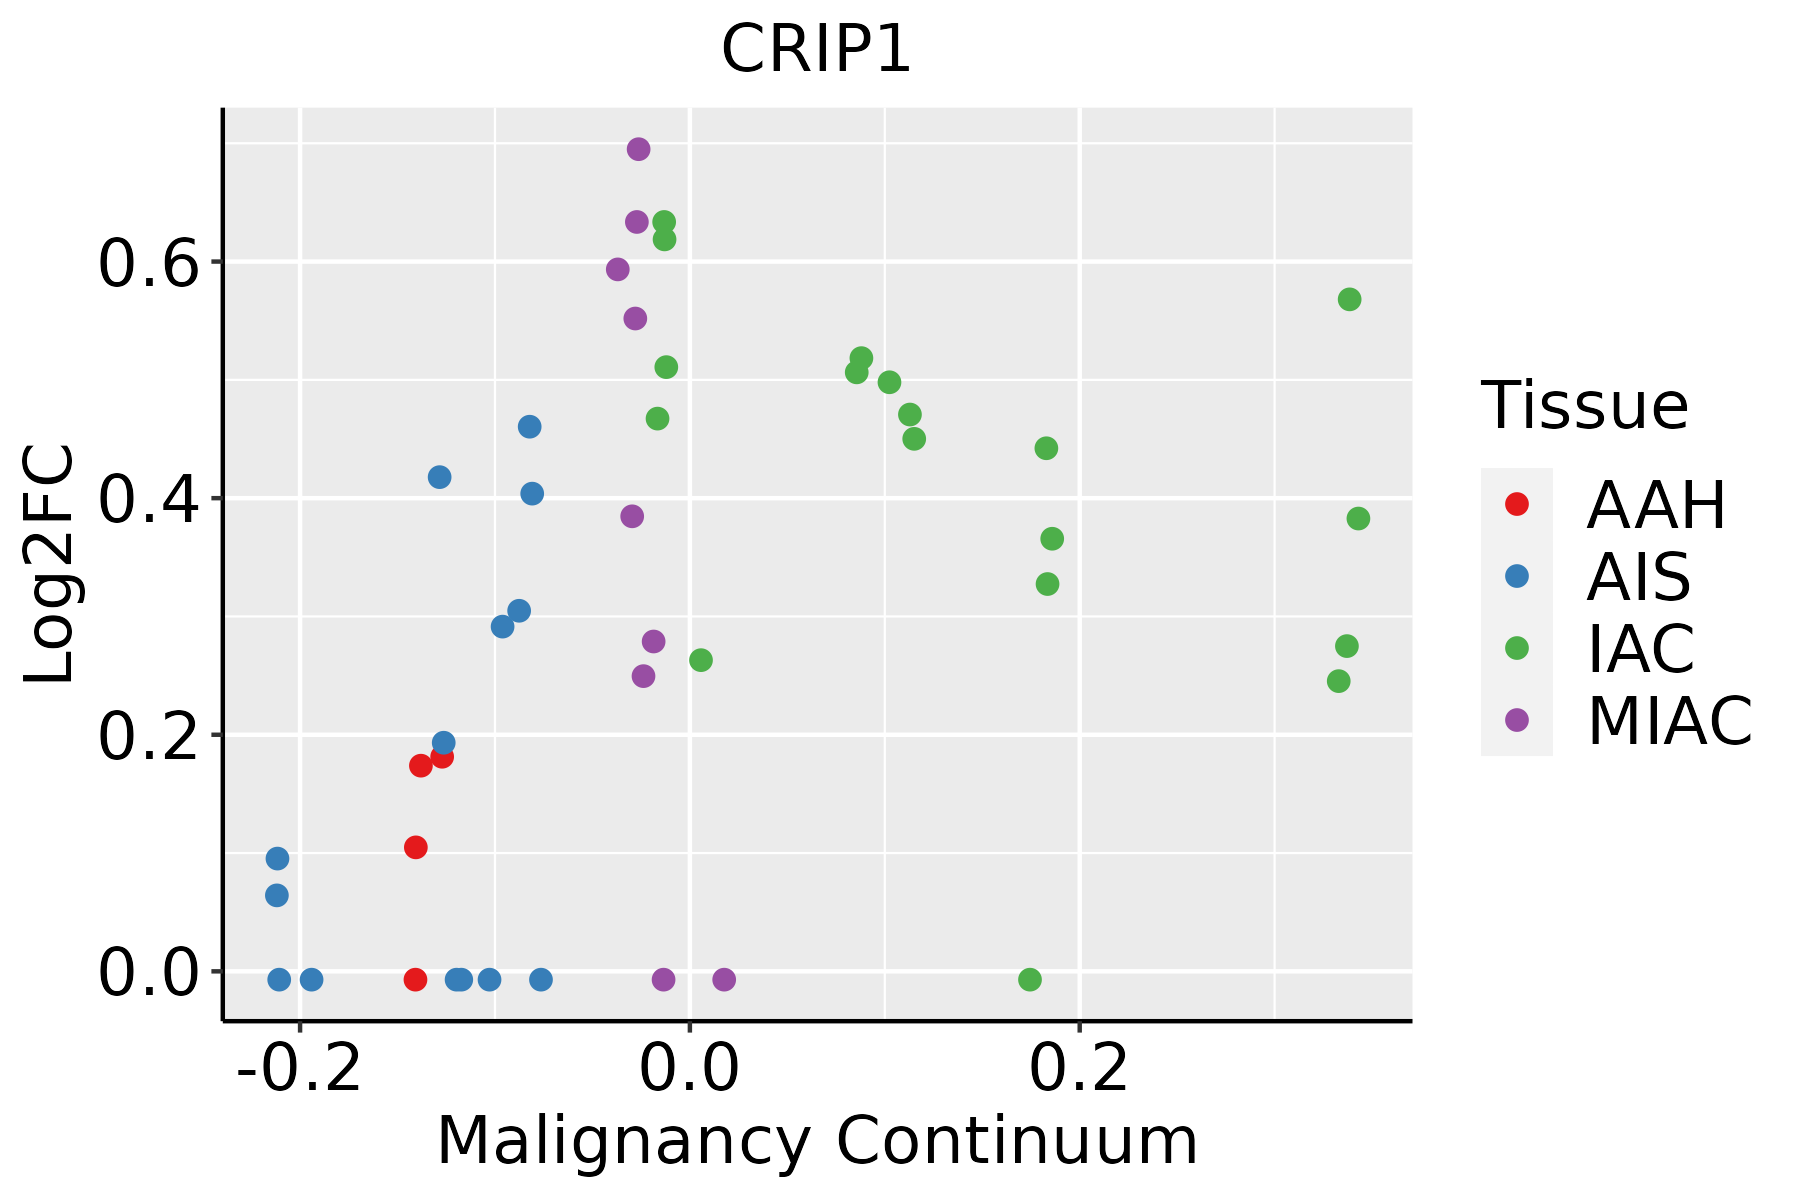 | AAH: Atypical adenomatous hyperplasia |
| AIS: Adenocarcinoma in situ | ||
| IAC: Invasive lung adenocarcinoma | ||
| MIA: Minimally invasive adenocarcinoma | ||
| Oral Cavity | 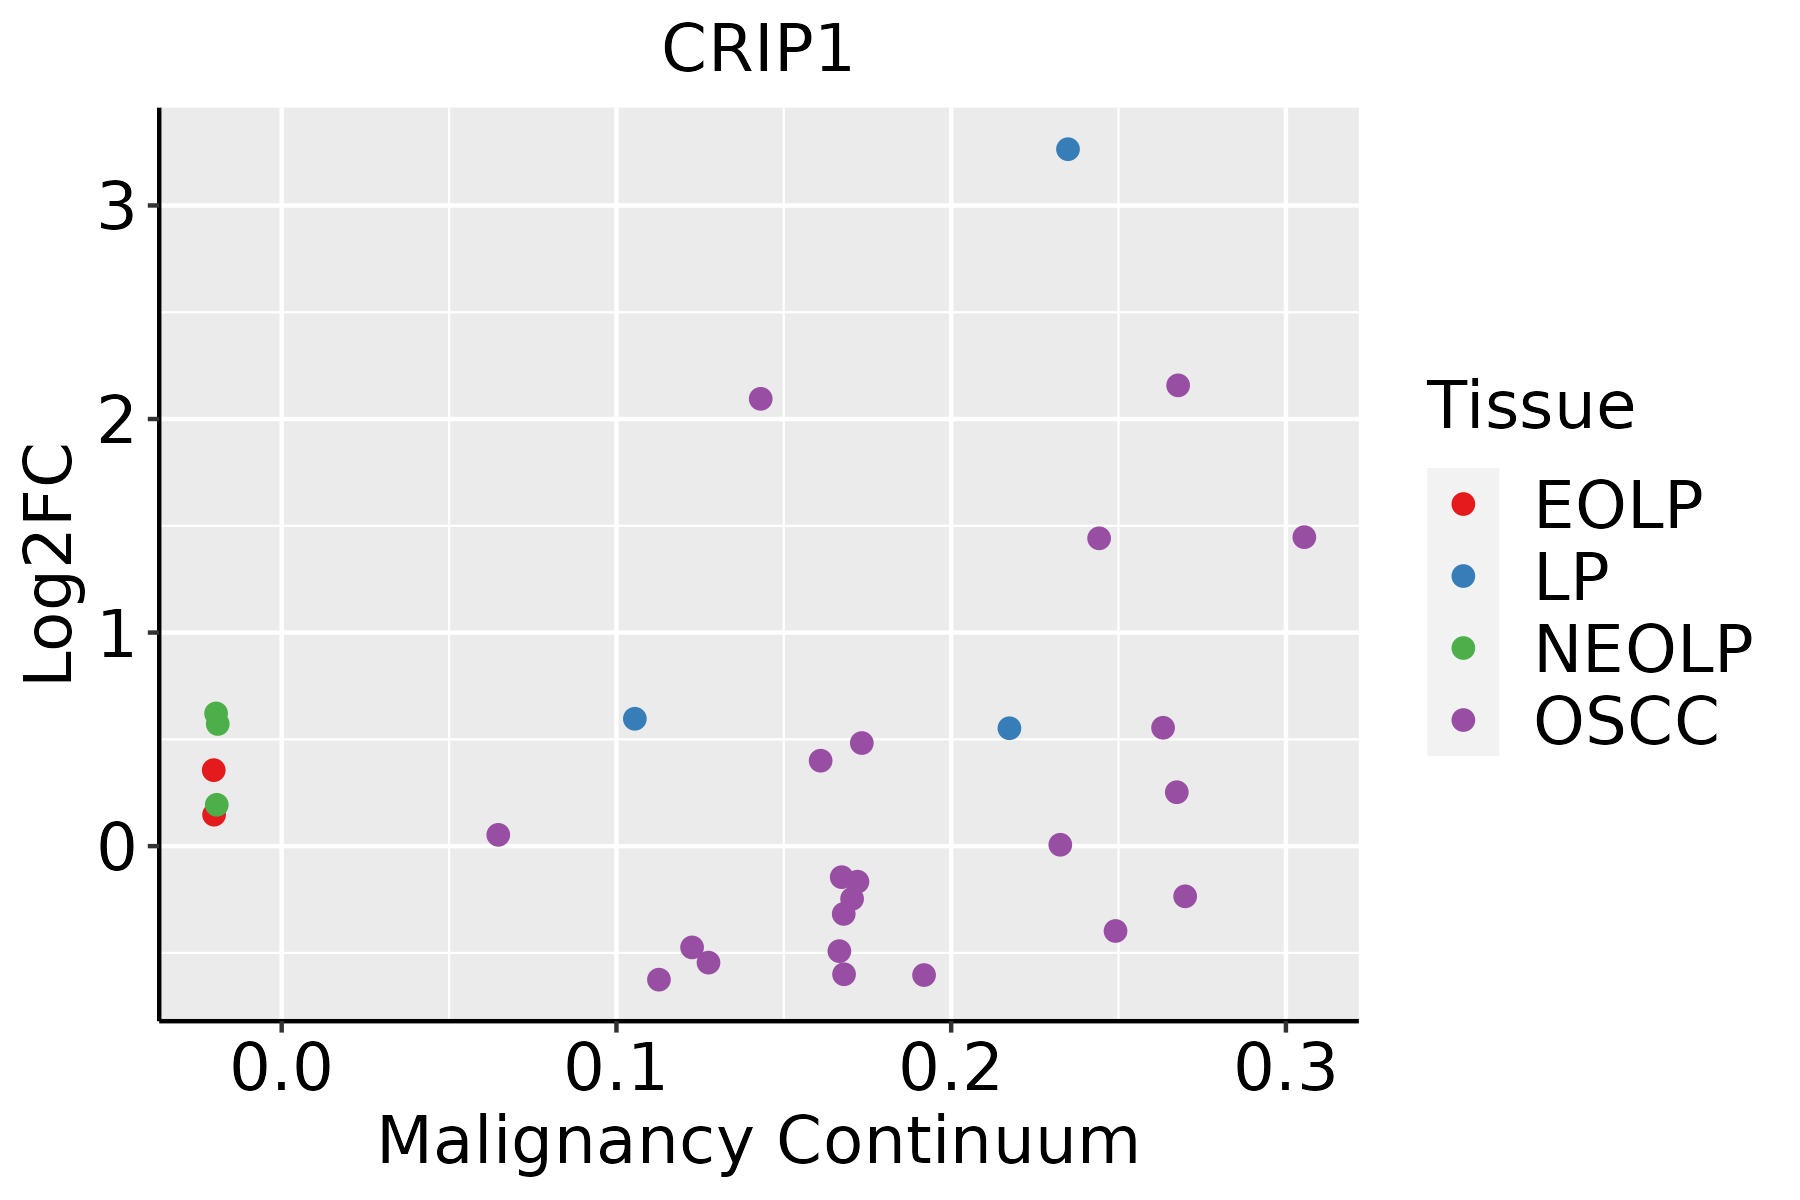 | EOLP: Erosive Oral lichen planus |
| LP: leukoplakia | ||
| NEOLP: Non-erosive oral lichen planus | ||
| OSCC: Oral squamous cell carcinoma | ||
| Skin | 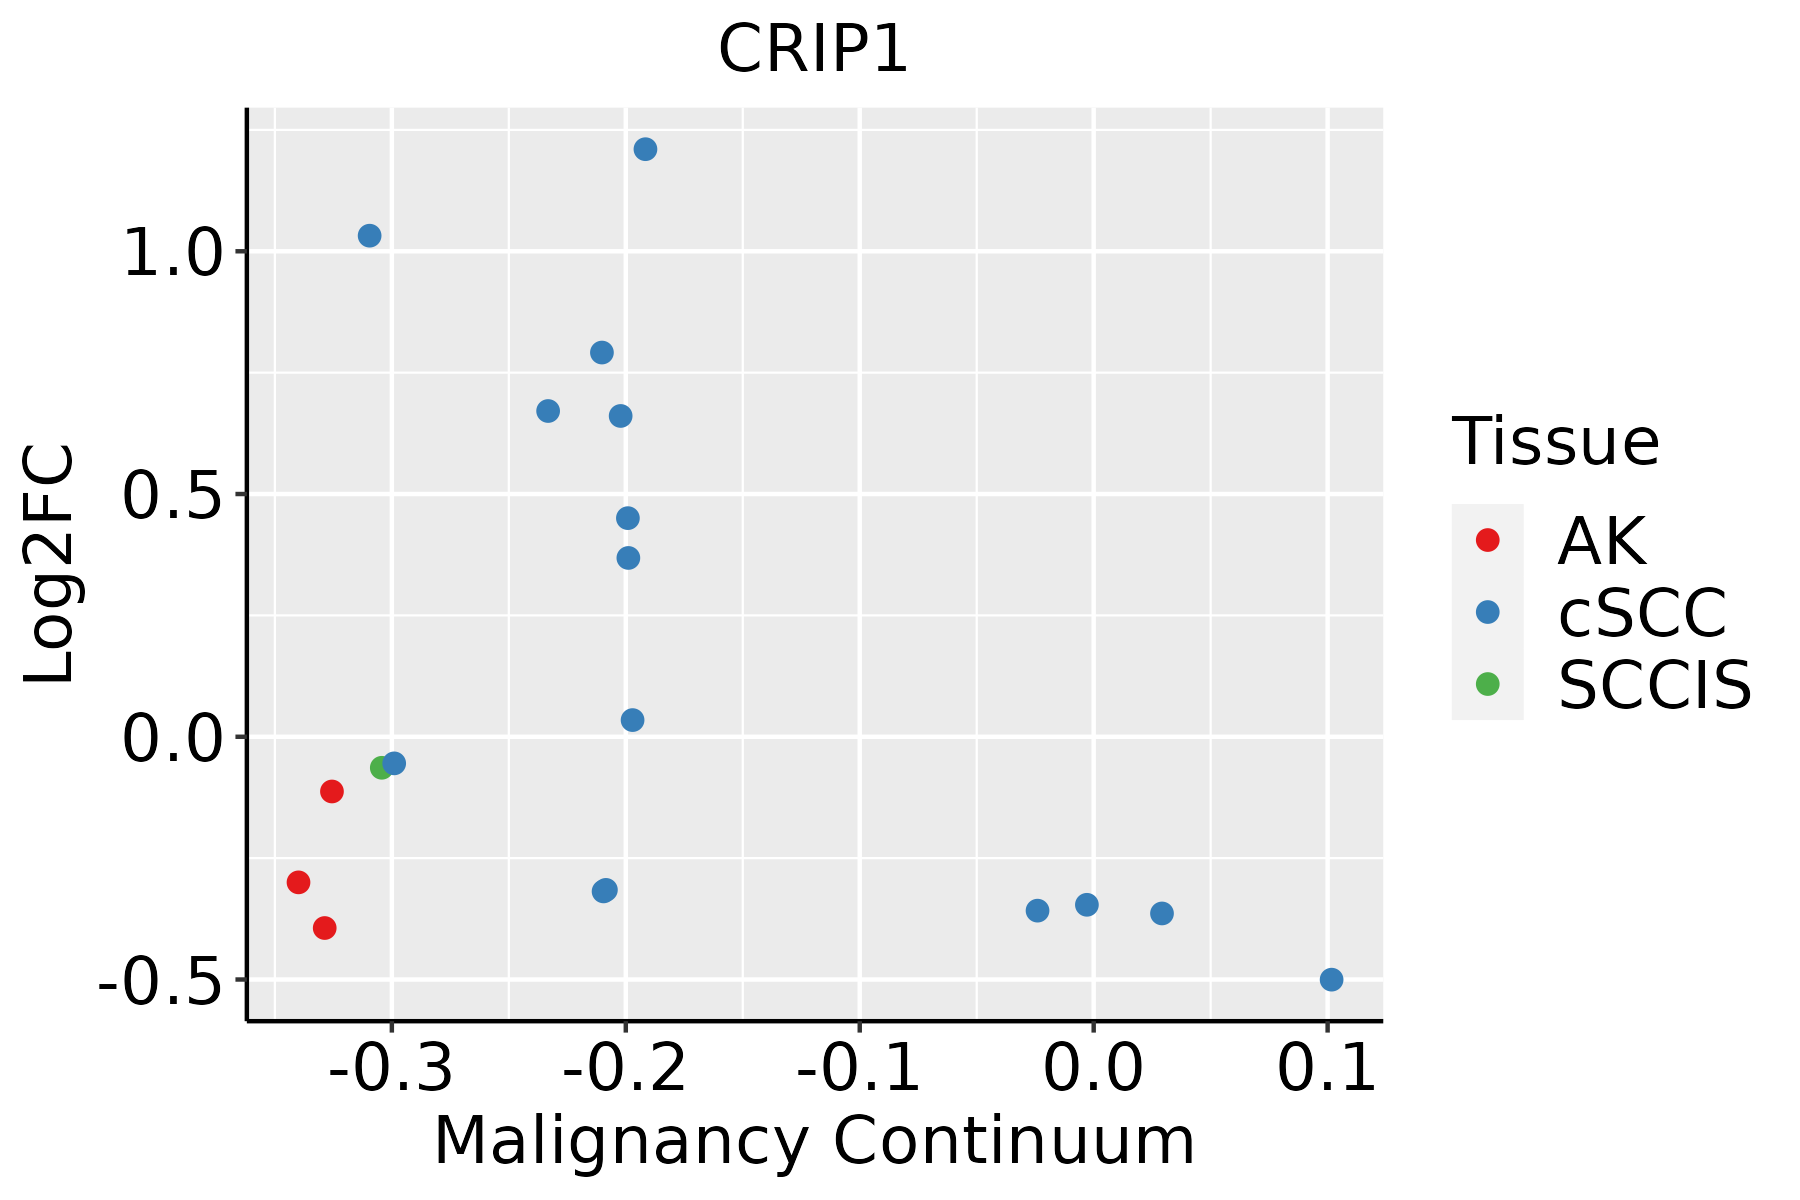 | AK: Actinic keratosis |
| cSCC: Cutaneous squamous cell carcinoma | ||
| SCCIS:squamous cell carcinoma in situ | ||
| Thyroid |  | ATC: Anaplastic thyroid cancer |
| HT: Hashimoto's thyroiditis | ||
| PTC: Papillary thyroid cancer |
| ∗log2FC in expression of this searched gene in stem-like cells from each diseased tissue sample relative to stem-like cells in normal samples in each tissue plotted against the malignancy continuum. Samples are colored based on if they are from different disease stage. |
Top |
Malignant transformation related pathway analysis |
| Find out the enriched GO biological processes and KEGG pathways involved in transition from healthy to precancer to cancer |
| Tissue | Disease Stage | Enriched GO biological Processes |
| Colorectum | AD |  |
| Colorectum | SER |  |
| Colorectum | MSS |  |
| Colorectum | MSI-H |  |
| Colorectum | FAP |  |
| ∗Top 15 enriched GO BP terms are showed in the bar plot of each disease state in each tissue. Each row represents a significant GO biological process which is colored according to the -log10(p.adjust). |
| Page: 1 2 3 4 5 6 7 8 9 |
| GO ID | Tissue | Disease Stage | Description | Gene Ratio | Bg Ratio | pvalue | p.adjust | Count |
| GO:00614482 | Oral cavity | NEOLP | connective tissue development | 46/2005 | 252/18723 | 2.11e-04 | 2.25e-03 | 46 |
| GO:004667721 | Oral cavity | NEOLP | response to antibiotic | 14/2005 | 47/18723 | 2.79e-04 | 2.80e-03 | 14 |
| GO:007121424 | Oral cavity | NEOLP | cellular response to abiotic stimulus | 55/2005 | 331/18723 | 6.38e-04 | 5.43e-03 | 55 |
| GO:010400424 | Oral cavity | NEOLP | cellular response to environmental stimulus | 55/2005 | 331/18723 | 6.38e-04 | 5.43e-03 | 55 |
| GO:007147831 | Oral cavity | NEOLP | cellular response to radiation | 35/2005 | 186/18723 | 6.47e-04 | 5.47e-03 | 35 |
| GO:000863031 | Oral cavity | NEOLP | intrinsic apoptotic signaling pathway in response to DNA damage | 22/2005 | 99/18723 | 6.64e-04 | 5.54e-03 | 22 |
| GO:000931432 | Oral cavity | NEOLP | response to radiation | 71/2005 | 456/18723 | 7.84e-04 | 6.25e-03 | 71 |
| GO:007123612 | Oral cavity | NEOLP | cellular response to antibiotic | 6/2005 | 14/18723 | 2.10e-03 | 1.38e-02 | 6 |
| GO:003085021 | Oral cavity | NEOLP | prostate gland development | 12/2005 | 45/18723 | 2.17e-03 | 1.42e-02 | 12 |
| GO:00100437 | Oral cavity | NEOLP | response to zinc ion | 13/2005 | 58/18723 | 7.35e-03 | 3.71e-02 | 13 |
| GO:009719328 | Skin | AK | intrinsic apoptotic signaling pathway | 82/1910 | 288/18723 | 2.01e-18 | 2.97e-15 | 82 |
| GO:004873226 | Skin | AK | gland development | 93/1910 | 436/18723 | 3.24e-12 | 7.10e-10 | 93 |
| GO:007121420 | Skin | AK | cellular response to abiotic stimulus | 67/1910 | 331/18723 | 3.15e-08 | 1.71e-06 | 67 |
| GO:010400420 | Skin | AK | cellular response to environmental stimulus | 67/1910 | 331/18723 | 3.15e-08 | 1.71e-06 | 67 |
| GO:002261217 | Skin | AK | gland morphogenesis | 32/1910 | 118/18723 | 1.68e-07 | 7.09e-06 | 32 |
| GO:004860819 | Skin | AK | reproductive structure development | 77/1910 | 424/18723 | 3.56e-07 | 1.36e-05 | 77 |
| GO:006145820 | Skin | AK | reproductive system development | 77/1910 | 427/18723 | 4.76e-07 | 1.74e-05 | 77 |
| GO:000863024 | Skin | AK | intrinsic apoptotic signaling pathway in response to DNA damage | 27/1910 | 99/18723 | 1.34e-06 | 4.15e-05 | 27 |
| GO:007147810 | Skin | AK | cellular response to radiation | 41/1910 | 186/18723 | 1.53e-06 | 4.61e-05 | 41 |
| GO:000931420 | Skin | AK | response to radiation | 78/1910 | 456/18723 | 3.32e-06 | 8.59e-05 | 78 |
| Page: 1 2 3 4 5 6 7 8 9 10 11 12 13 14 15 16 17 18 |
| Pathway ID | Tissue | Disease Stage | Description | Gene Ratio | Bg Ratio | pvalue | p.adjust | qvalue | Count |
| Page: 1 |
Top |
Cell-cell communication analysis |
| Identification of potential cell-cell interactions between two cell types and their ligand-receptor pairs for different disease states |
| Ligand | Receptor | LRpair | Pathway | Tissue | Disease Stage |
| Page: 1 |
Top |
Single-cell gene regulatory network inference analysis |
| Find out the significant the regulons (TFs) and the target genes of each regulon across cell types for different disease states |
| TF | Cell Type | Tissue | Disease Stage | Target Gene | RSS | Regulon Activity |
| ∗The dot plots of a searched regulon are shown for all cell subpopulations in each disease state of each tissue based on the regulon specific score inferred using pySCENIC and by calculating the average expression. |
| Page: 1 |
Top |
Somatic mutation of malignant transformation related genes |
| Annotation of somatic variants for genes involved in malignant transformation |
| Hugo Symbol | Variant Class | Variant Classification | dbSNP RS | HGVSc | HGVSp | HGVSp Short | SWISSPROT | BIOTYPE | SIFT | PolyPhen | Tumor Sample Barcode | Tissue | Histology | Sex | Age | Stage | Therapy Types | Drugs | Outcome |
| CRIP1 | deletion | Frame_Shift_Del | c.121delN | p.Gly42AlafsTer? | p.G42Afs*? | P50238 | protein_coding | TCGA-KK-A5A1-01 | Prostate | prostate adenocarcinoma | Male | >=65 | 9 | Unknown | Unknown | PD | |||
| CRIP1 | SNV | Missense_Mutation | c.193N>T | p.Gly65Cys | p.G65C | P50238 | protein_coding | deleterious(0.02) | benign(0.284) | TCGA-BR-4368-01 | Stomach | stomach adenocarcinoma | Female | >=65 | III/IV | Unknown | Unknown | SD | |
| CRIP1 | SNV | Missense_Mutation | c.182N>C | p.Phe61Ser | p.F61S | P50238 | protein_coding | deleterious(0) | probably_damaging(0.99) | TCGA-CD-A4MG-01 | Stomach | stomach adenocarcinoma | Male | >=65 | I/II | Unknown | Unknown | PD | |
| CRIP1 | SNV | Missense_Mutation | novel | c.143N>A | p.Gly48Asp | p.G48D | P50238 | protein_coding | deleterious(0.05) | benign(0.169) | TCGA-VQ-A8P2-01 | Stomach | stomach adenocarcinoma | Male | >=65 | III/IV | Unspecific | Complete Response | |
| CRIP1 | deletion | Frame_Shift_Del | c.121delN | p.Gly42AlafsTer? | p.G42Afs*? | P50238 | protein_coding | TCGA-HU-A4GU-01 | Stomach | stomach adenocarcinoma | Male | >=65 | I/II | Unknown | Unknown | SD |
| Page: 1 |
Top |
Related drugs of malignant transformation related genes |
| Identification of chemicals and drugs interact with genes involved in malignant transfromation |
| (DGIdb 4.0) |
| Entrez ID | Symbol | Category | Interaction Types | Drug Claim Name | Drug Name | PMIDs |
| Page: 1 |

Copyright 2023-Present -The University of Texas Health Science Center at Houston |