
|
|||||
|
 | |
| |
| |
| |
| |
| |
|
Gene: CORO1B |
Gene summary for CORO1B |
| Gene information | Species | Human | Gene symbol | CORO1B | Gene ID | 57175 |
| Gene name | coronin 1B | |
| Gene Alias | CORONIN-2 | |
| Cytomap | 11q13.2 | |
| Gene Type | protein-coding | GO ID | GO:0000902 | UniProtAcc | A0A024R5K1 |
Top |
Malignant transformation analysis |
| Identification of the aberrant gene expression in precancerous and cancerous lesions by comparing the gene expression of stem-like cells in diseased tissues with normal stem cells |
| Entrez ID | Symbol | Replicates | Species | Organ | Tissue | Adj P-value | Log2FC | Malignancy |
| 57175 | CORO1B | HTA11_3410_2000001011 | Human | Colorectum | AD | 3.20e-04 | 1.56e-01 | 0.0155 |
| 57175 | CORO1B | HTA11_2487_2000001011 | Human | Colorectum | SER | 2.81e-27 | 7.47e-01 | -0.1808 |
| 57175 | CORO1B | HTA11_2951_2000001011 | Human | Colorectum | AD | 9.14e-03 | 3.47e-01 | 0.0216 |
| 57175 | CORO1B | HTA11_1938_2000001011 | Human | Colorectum | AD | 2.82e-08 | 3.50e-01 | -0.0811 |
| 57175 | CORO1B | HTA11_78_2000001011 | Human | Colorectum | AD | 5.30e-17 | 4.25e-01 | -0.1088 |
| 57175 | CORO1B | HTA11_347_2000001011 | Human | Colorectum | AD | 1.21e-25 | 5.73e-01 | -0.1954 |
| 57175 | CORO1B | HTA11_411_2000001011 | Human | Colorectum | SER | 9.97e-09 | 9.35e-01 | -0.2602 |
| 57175 | CORO1B | HTA11_2112_2000001011 | Human | Colorectum | SER | 2.33e-08 | 6.64e-01 | -0.2196 |
| 57175 | CORO1B | HTA11_3361_2000001011 | Human | Colorectum | AD | 1.68e-08 | 3.28e-01 | -0.1207 |
| 57175 | CORO1B | HTA11_83_2000001011 | Human | Colorectum | SER | 1.29e-04 | 3.17e-01 | -0.1526 |
| 57175 | CORO1B | HTA11_696_2000001011 | Human | Colorectum | AD | 1.48e-22 | 4.60e-01 | -0.1464 |
| 57175 | CORO1B | HTA11_866_2000001011 | Human | Colorectum | AD | 3.84e-03 | 1.79e-01 | -0.1001 |
| 57175 | CORO1B | HTA11_1391_2000001011 | Human | Colorectum | AD | 4.53e-16 | 4.57e-01 | -0.059 |
| 57175 | CORO1B | HTA11_5212_2000001011 | Human | Colorectum | AD | 5.44e-10 | 5.26e-01 | -0.2061 |
| 57175 | CORO1B | HTA11_5216_2000001011 | Human | Colorectum | SER | 1.08e-03 | 2.94e-01 | -0.1462 |
| 57175 | CORO1B | HTA11_546_2000001011 | Human | Colorectum | AD | 3.50e-06 | 3.60e-01 | -0.0842 |
| 57175 | CORO1B | HTA11_866_3004761011 | Human | Colorectum | AD | 2.46e-03 | 1.75e-01 | 0.096 |
| 57175 | CORO1B | HTA11_9408_2000001011 | Human | Colorectum | AD | 7.90e-03 | 4.85e-01 | 0.0451 |
| 57175 | CORO1B | HTA11_8622_2000001021 | Human | Colorectum | SER | 4.22e-06 | 3.97e-01 | 0.0528 |
| 57175 | CORO1B | HTA11_10623_2000001011 | Human | Colorectum | AD | 8.27e-08 | 3.95e-01 | -0.0177 |
| Page: 1 2 3 4 5 6 7 8 |
| Tissue | Expression Dynamics | Abbreviation |
| Colorectum (GSE201348) | 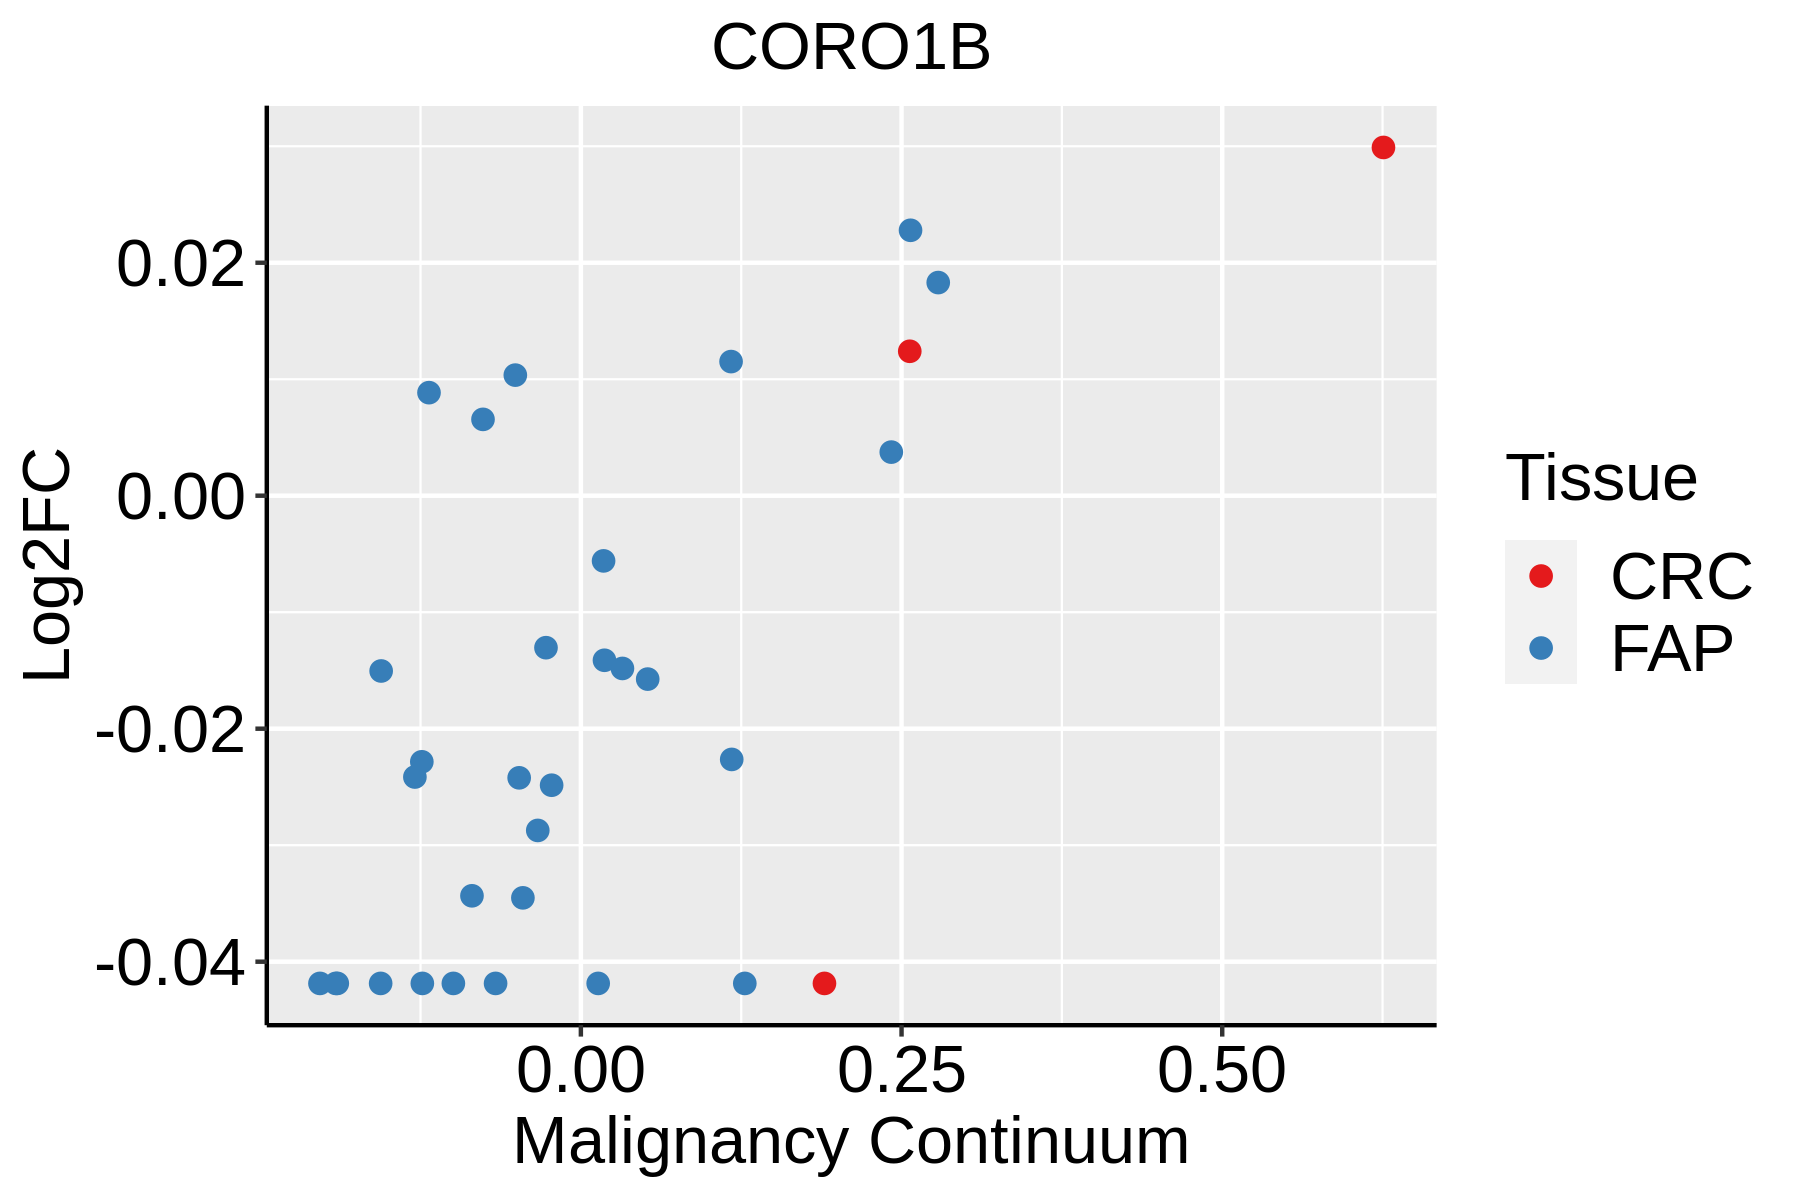 | FAP: Familial adenomatous polyposis |
| CRC: Colorectal cancer | ||
| Colorectum (HTA11) | 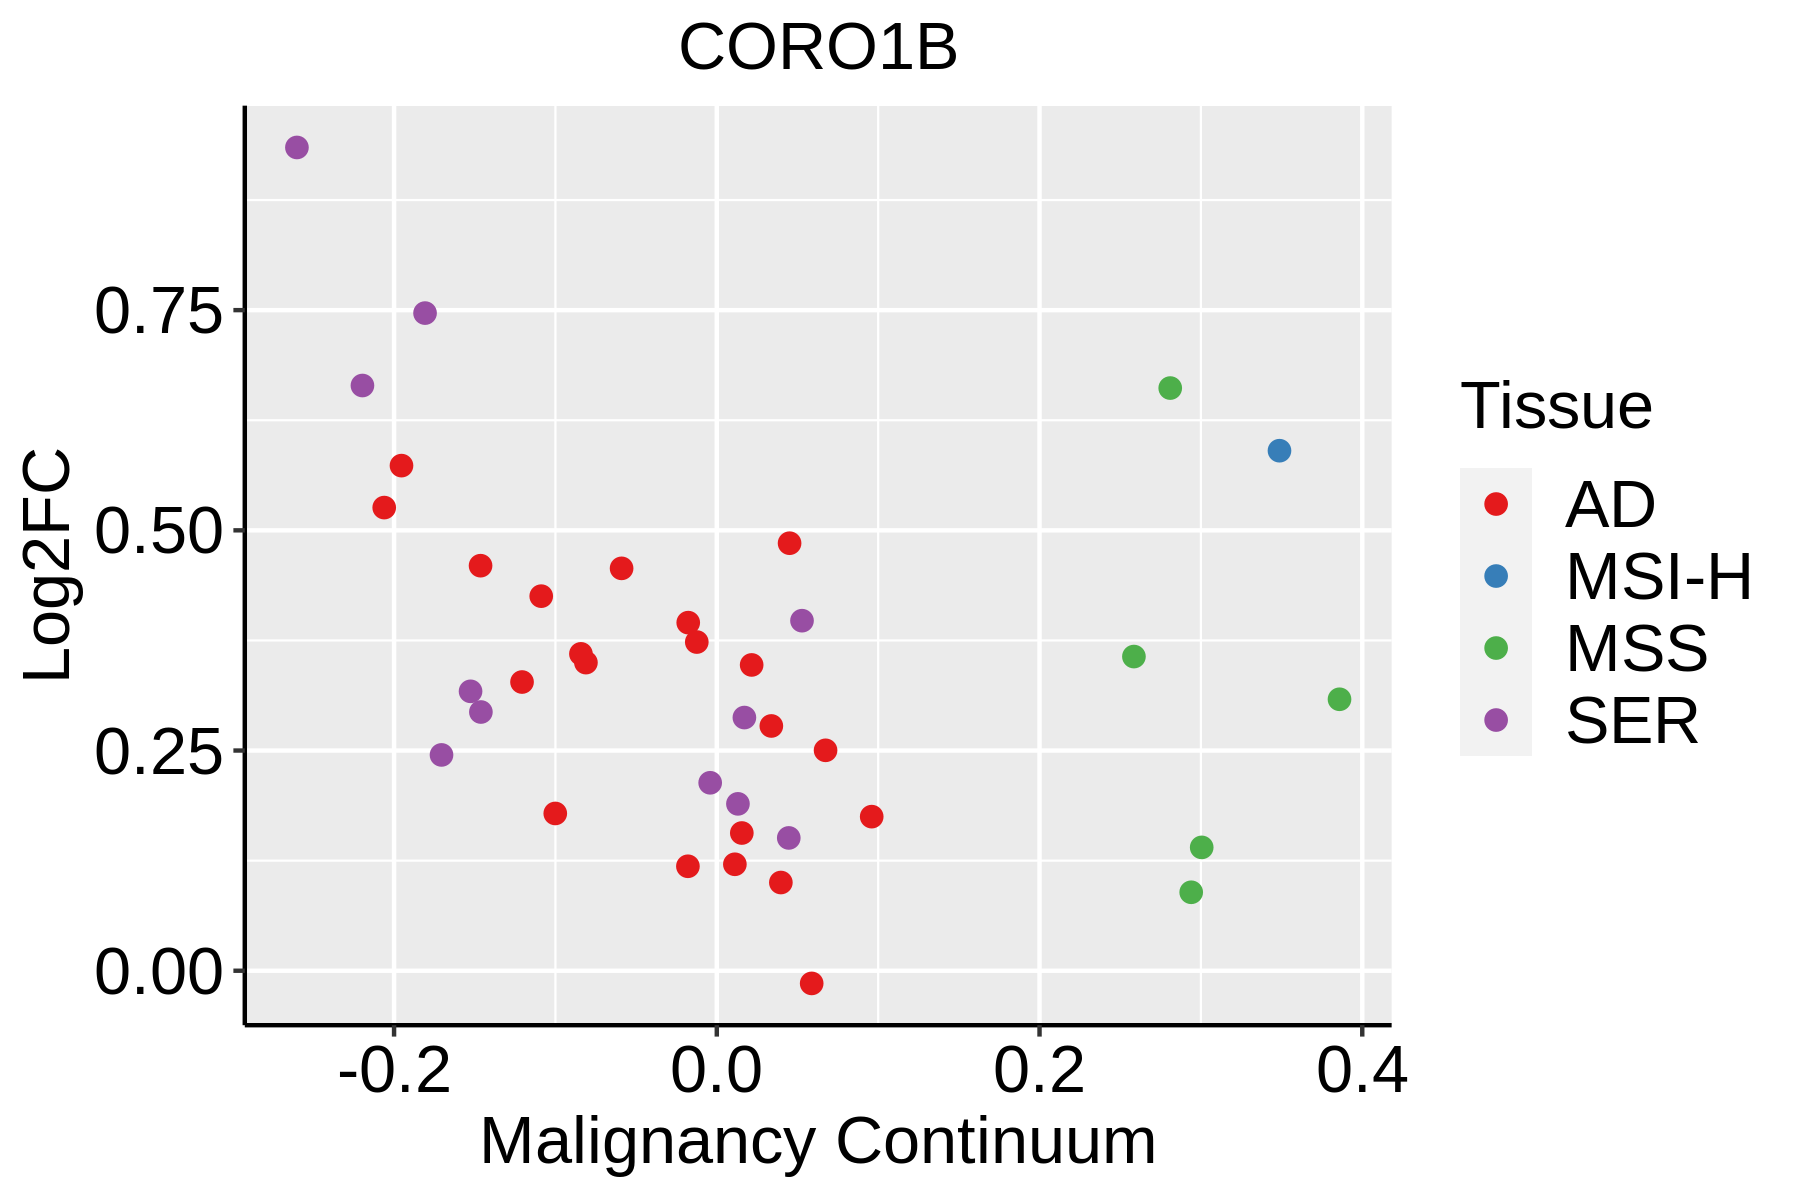 | AD: Adenomas |
| SER: Sessile serrated lesions | ||
| MSI-H: Microsatellite-high colorectal cancer | ||
| MSS: Microsatellite stable colorectal cancer | ||
| Esophagus |  | ESCC: Esophageal squamous cell carcinoma |
| HGIN: High-grade intraepithelial neoplasias | ||
| LGIN: Low-grade intraepithelial neoplasias | ||
| Liver | 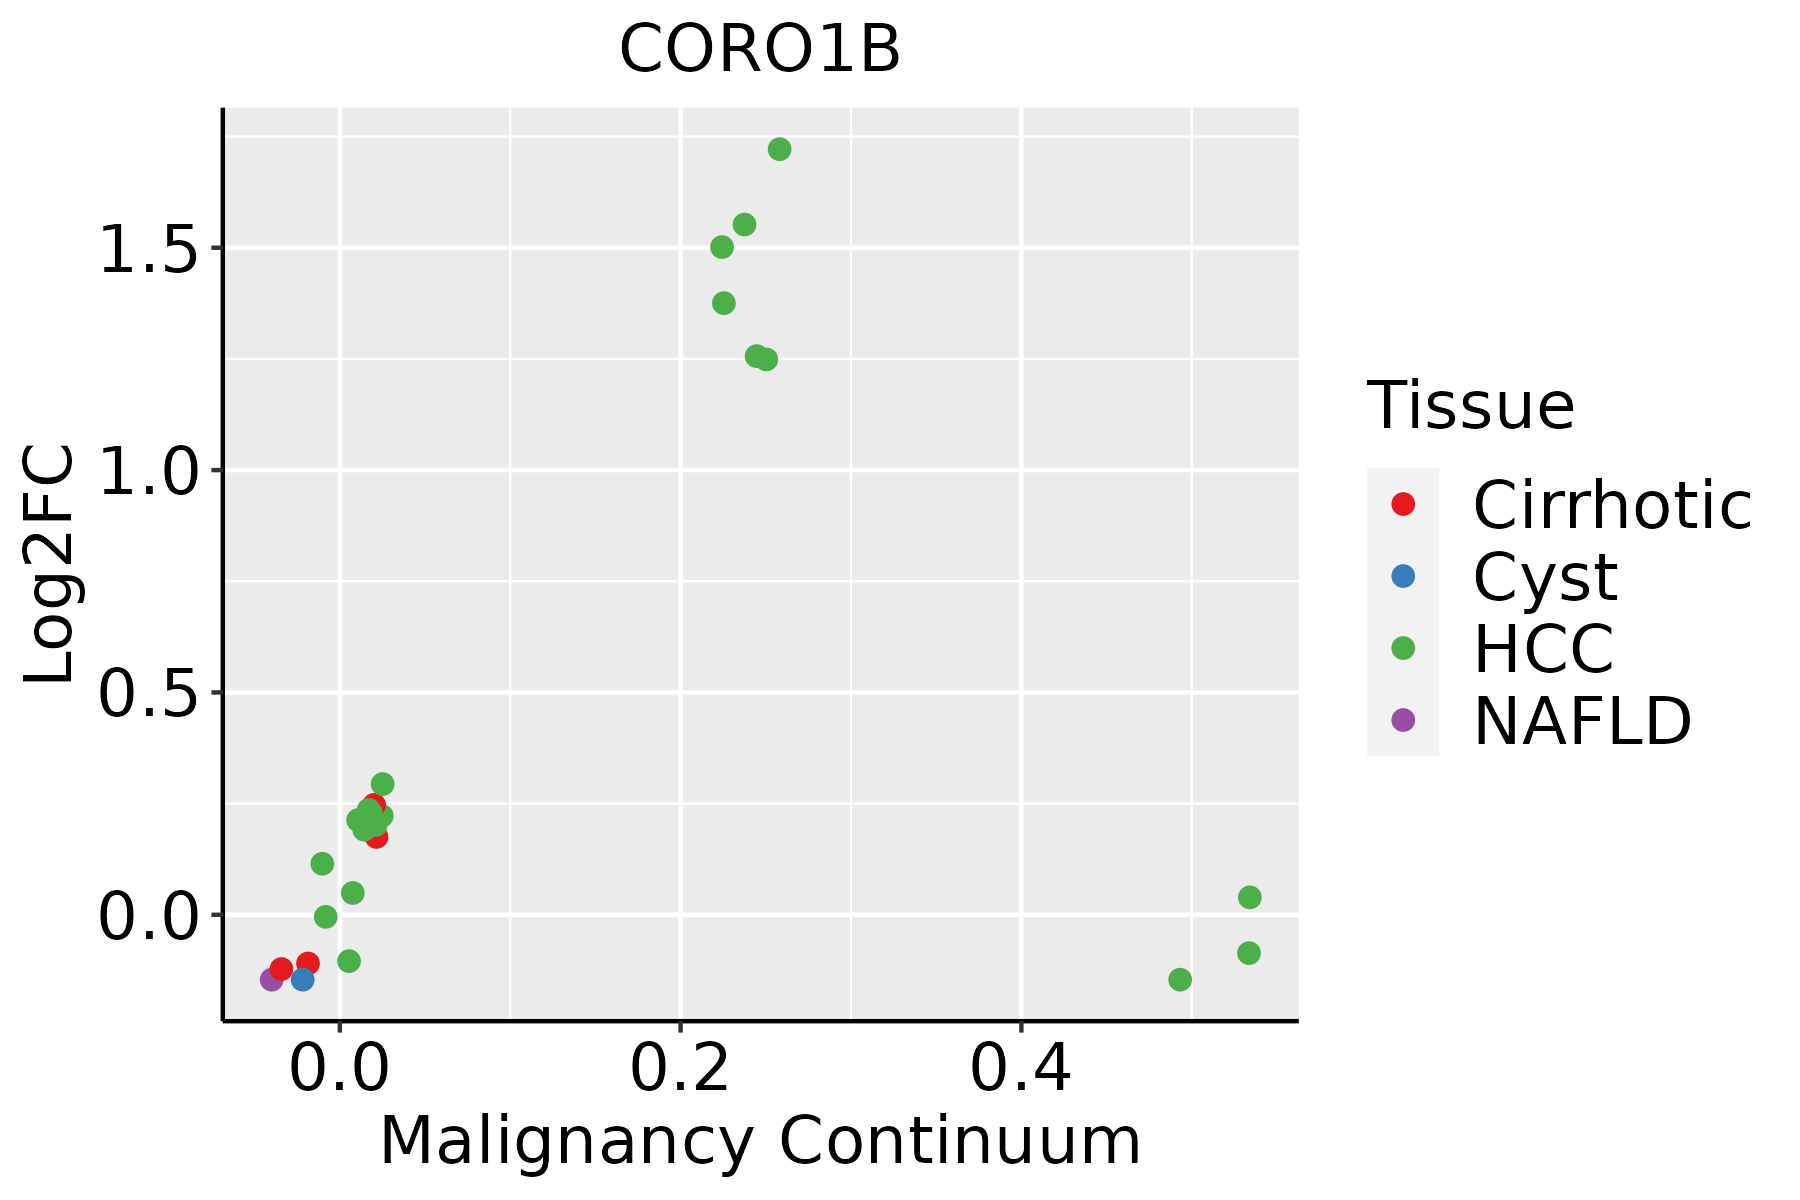 | HCC: Hepatocellular carcinoma |
| NAFLD: Non-alcoholic fatty liver disease | ||
| Oral Cavity | 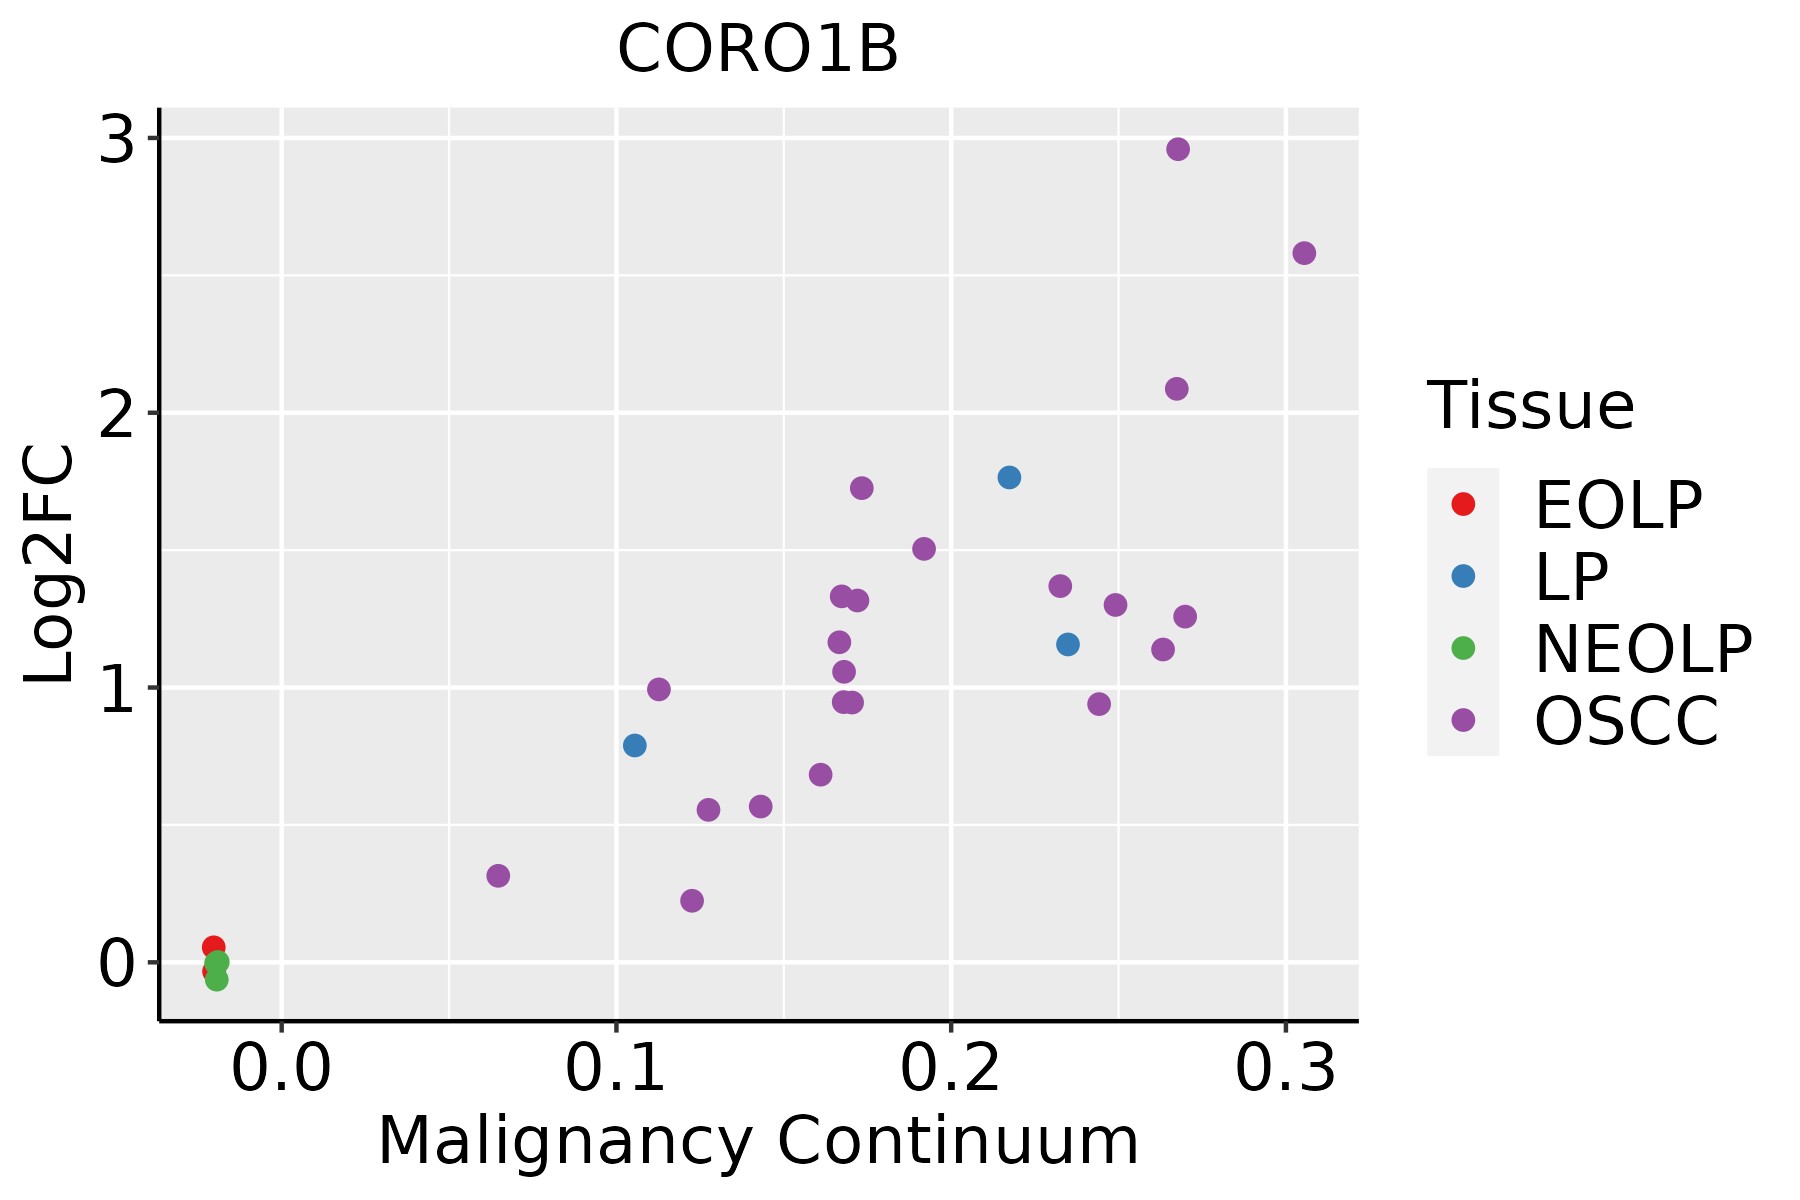 | EOLP: Erosive Oral lichen planus |
| LP: leukoplakia | ||
| NEOLP: Non-erosive oral lichen planus | ||
| OSCC: Oral squamous cell carcinoma | ||
| Prostate | 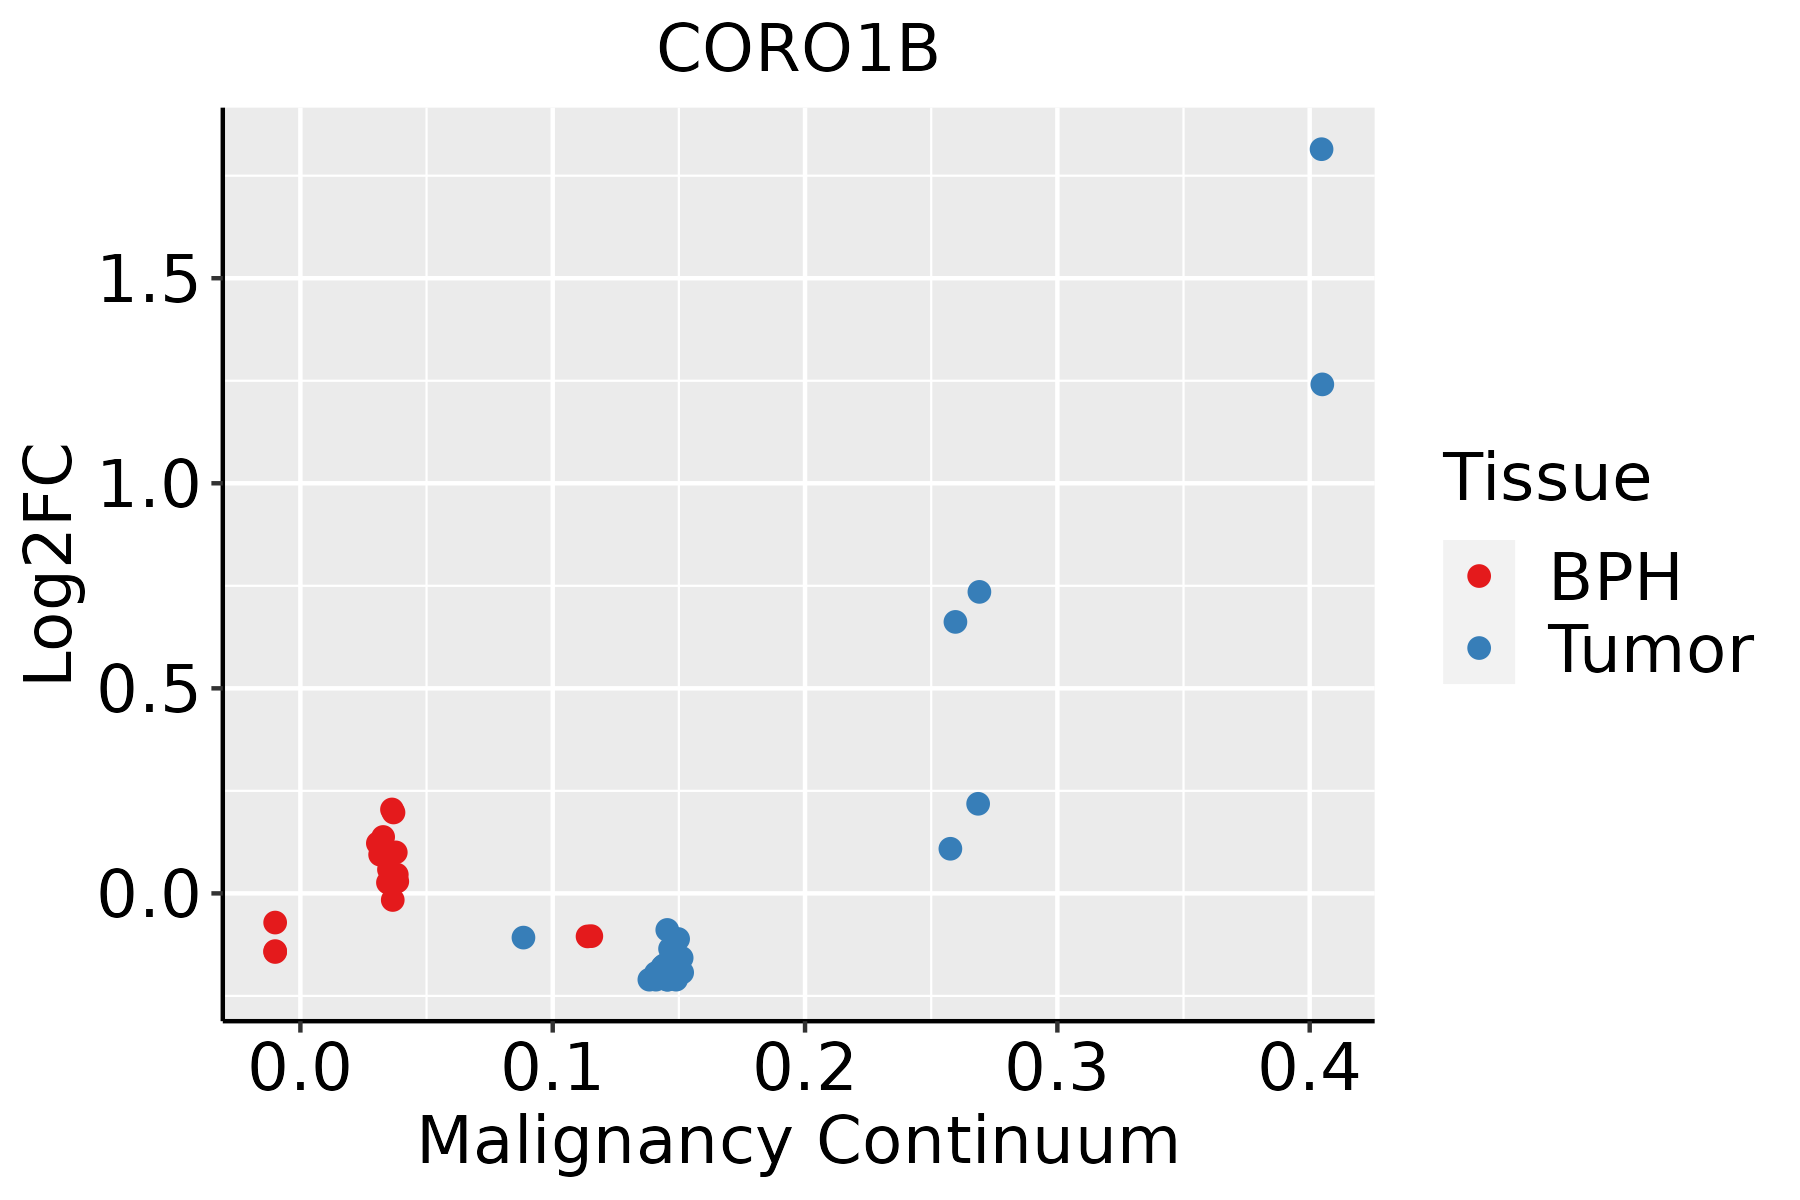 | BPH: Benign Prostatic Hyperplasia |
| Skin | 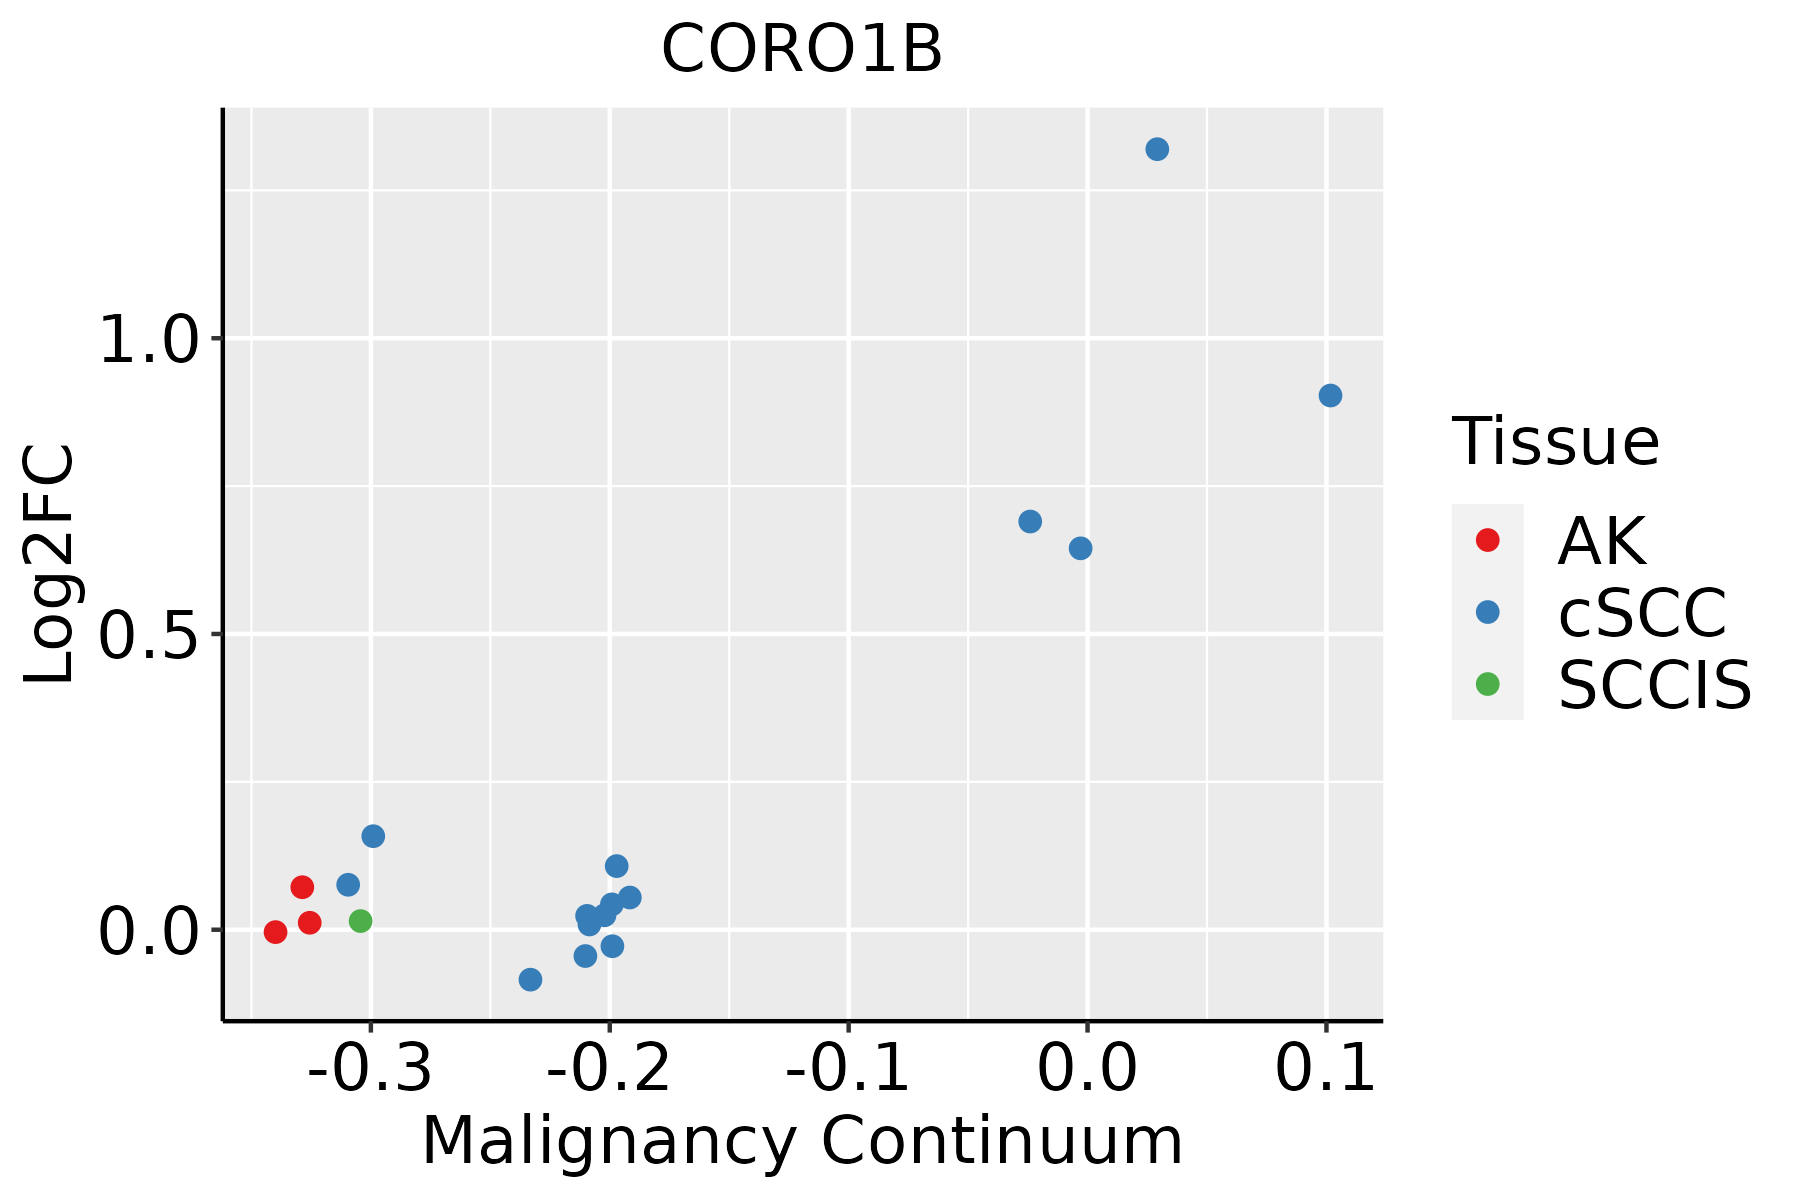 | AK: Actinic keratosis |
| cSCC: Cutaneous squamous cell carcinoma | ||
| SCCIS:squamous cell carcinoma in situ | ||
| Thyroid |  | ATC: Anaplastic thyroid cancer |
| HT: Hashimoto's thyroiditis | ||
| PTC: Papillary thyroid cancer |
| ∗log2FC in expression of this searched gene in stem-like cells from each diseased tissue sample relative to stem-like cells in normal samples in each tissue plotted against the malignancy continuum. Samples are colored based on if they are from different disease stage. |
Top |
Malignant transformation related pathway analysis |
| Find out the enriched GO biological processes and KEGG pathways involved in transition from healthy to precancer to cancer |
| Tissue | Disease Stage | Enriched GO biological Processes |
| Colorectum | AD |  |
| Colorectum | SER |  |
| Colorectum | MSS |  |
| Colorectum | MSI-H |  |
| Colorectum | FAP |  |
| ∗Top 15 enriched GO BP terms are showed in the bar plot of each disease state in each tissue. Each row represents a significant GO biological process which is colored according to the -log10(p.adjust). |
| Page: 1 2 3 4 5 6 7 8 9 |
| GO ID | Tissue | Disease Stage | Description | Gene Ratio | Bg Ratio | pvalue | p.adjust | Count |
| GO:00315294 | Liver | Cirrhotic | ruffle organization | 26/4634 | 56/18723 | 3.40e-04 | 2.91e-03 | 26 |
| GO:00308387 | Liver | Cirrhotic | positive regulation of actin filament polymerization | 40/4634 | 99/18723 | 4.21e-04 | 3.46e-03 | 40 |
| GO:190274511 | Liver | Cirrhotic | positive regulation of lamellipodium organization | 19/4634 | 37/18723 | 4.39e-04 | 3.57e-03 | 19 |
| GO:190274311 | Liver | Cirrhotic | regulation of lamellipodium organization | 25/4634 | 54/18723 | 4.63e-04 | 3.75e-03 | 25 |
| GO:000166712 | Liver | Cirrhotic | ameboidal-type cell migration | 145/4634 | 475/18723 | 2.23e-03 | 1.36e-02 | 145 |
| GO:00450105 | Liver | Cirrhotic | actin nucleation | 22/4634 | 52/18723 | 4.07e-03 | 2.19e-02 | 22 |
| GO:00106317 | Liver | Cirrhotic | epithelial cell migration | 110/4634 | 357/18723 | 5.14e-03 | 2.65e-02 | 110 |
| GO:00343151 | Liver | Cirrhotic | regulation of Arp2/3 complex-mediated actin nucleation | 11/4634 | 21/18723 | 5.89e-03 | 2.95e-02 | 11 |
| GO:00901327 | Liver | Cirrhotic | epithelium migration | 110/4634 | 360/18723 | 6.79e-03 | 3.35e-02 | 110 |
| GO:00901307 | Liver | Cirrhotic | tissue migration | 111/4634 | 365/18723 | 7.66e-03 | 3.61e-02 | 111 |
| GO:004325422 | Liver | HCC | regulation of protein-containing complex assembly | 264/7958 | 428/18723 | 5.47e-16 | 4.39e-14 | 264 |
| GO:005125822 | Liver | HCC | protein polymerization | 182/7958 | 297/18723 | 4.17e-11 | 1.58e-09 | 182 |
| GO:002260422 | Liver | HCC | regulation of cell morphogenesis | 188/7958 | 309/18723 | 4.84e-11 | 1.82e-09 | 188 |
| GO:003133412 | Liver | HCC | positive regulation of protein-containing complex assembly | 150/7958 | 237/18723 | 7.35e-11 | 2.63e-09 | 150 |
| GO:190290322 | Liver | HCC | regulation of supramolecular fiber organization | 224/7958 | 383/18723 | 1.54e-10 | 5.33e-09 | 224 |
| GO:000701522 | Liver | HCC | actin filament organization | 252/7958 | 442/18723 | 3.83e-10 | 1.25e-08 | 252 |
| GO:001063912 | Liver | HCC | negative regulation of organelle organization | 204/7958 | 348/18723 | 7.67e-10 | 2.37e-08 | 204 |
| GO:190290522 | Liver | HCC | positive regulation of supramolecular fiber organization | 131/7958 | 209/18723 | 2.85e-09 | 7.69e-08 | 131 |
| GO:005149522 | Liver | HCC | positive regulation of cytoskeleton organization | 138/7958 | 226/18723 | 1.26e-08 | 3.12e-07 | 138 |
| GO:003253522 | Liver | HCC | regulation of cellular component size | 217/7958 | 383/18723 | 1.28e-08 | 3.14e-07 | 217 |
| Page: 1 2 3 4 5 6 7 8 9 10 11 12 13 14 15 16 17 18 19 20 21 22 23 24 25 26 27 28 |
| Pathway ID | Tissue | Disease Stage | Description | Gene Ratio | Bg Ratio | pvalue | p.adjust | qvalue | Count |
| Page: 1 |
Top |
Cell-cell communication analysis |
| Identification of potential cell-cell interactions between two cell types and their ligand-receptor pairs for different disease states |
| Ligand | Receptor | LRpair | Pathway | Tissue | Disease Stage |
| Page: 1 |
Top |
Single-cell gene regulatory network inference analysis |
| Find out the significant the regulons (TFs) and the target genes of each regulon across cell types for different disease states |
| TF | Cell Type | Tissue | Disease Stage | Target Gene | RSS | Regulon Activity |
| ∗The dot plots of a searched regulon are shown for all cell subpopulations in each disease state of each tissue based on the regulon specific score inferred using pySCENIC and by calculating the average expression. |
| Page: 1 |
Top |
Somatic mutation of malignant transformation related genes |
| Annotation of somatic variants for genes involved in malignant transformation |
| Hugo Symbol | Variant Class | Variant Classification | dbSNP RS | HGVSc | HGVSp | HGVSp Short | SWISSPROT | BIOTYPE | SIFT | PolyPhen | Tumor Sample Barcode | Tissue | Histology | Sex | Age | Stage | Therapy Types | Drugs | Outcome |
| CORO1B | SNV | Missense_Mutation | c.1385N>A | p.Ala462Asp | p.A462D | Q9BR76 | protein_coding | tolerated(0.21) | benign(0.001) | TCGA-AR-A2LK-01 | Breast | breast invasive carcinoma | Female | <65 | III/IV | Hormone Therapy | anastrozole | PD | |
| CORO1B | SNV | Missense_Mutation | rs757671047 | c.209N>A | p.Arg70His | p.R70H | Q9BR76 | protein_coding | deleterious(0.02) | possibly_damaging(0.684) | TCGA-BH-A18G-01 | Breast | breast invasive carcinoma | Female | >=65 | I/II | Unknown | Unknown | SD |
| CORO1B | SNV | Missense_Mutation | c.619N>T | p.Arg207Trp | p.R207W | Q9BR76 | protein_coding | deleterious(0) | possibly_damaging(0.821) | TCGA-DR-A0ZM-01 | Cervix | cervical & endocervical cancer | Female | <65 | III/IV | Unspecific | Cisplatin | SD | |
| CORO1B | SNV | Missense_Mutation | rs767771419 | c.1003G>A | p.Ala335Thr | p.A335T | Q9BR76 | protein_coding | tolerated(0.07) | benign(0.281) | TCGA-EA-A3HU-01 | Cervix | cervical & endocervical cancer | Female | <65 | I/II | Unknown | Unknown | SD |
| CORO1B | SNV | Missense_Mutation | rs772528176 | c.1148N>A | p.Arg383Gln | p.R383Q | Q9BR76 | protein_coding | tolerated(0.39) | benign(0) | TCGA-AZ-4313-01 | Colorectum | colon adenocarcinoma | Female | <65 | I/II | Unknown | Unknown | SD |
| CORO1B | SNV | Missense_Mutation | rs769428845 | c.286N>A | p.Glu96Lys | p.E96K | Q9BR76 | protein_coding | deleterious(0.02) | benign(0.007) | TCGA-AZ-6601-01 | Colorectum | colon adenocarcinoma | Male | >=65 | I/II | Unknown | Unknown | PD |
| CORO1B | SNV | Missense_Mutation | c.517N>G | p.Ser173Gly | p.S173G | Q9BR76 | protein_coding | tolerated(0.26) | benign(0.003) | TCGA-AH-6897-01 | Colorectum | rectum adenocarcinoma | Male | <65 | I/II | Unknown | Unknown | SD | |
| CORO1B | insertion | In_Frame_Ins | novel | c.562_563insTCAGCTGGAACCACAATG | p.Val182_Asn187dup | p.V182_N187dup | Q9BR76 | protein_coding | TCGA-G5-6233-01 | Colorectum | rectum adenocarcinoma | Male | >=65 | III/IV | Chemotherapy | 5-fluorouracil | PD | ||
| CORO1B | SNV | Missense_Mutation | novel | c.81N>T | p.Glu27Asp | p.E27D | Q9BR76 | protein_coding | tolerated(1) | benign(0) | TCGA-A5-A1OF-01 | Endometrium | uterine corpus endometrioid carcinoma | Female | <65 | I/II | Unknown | Unknown | SD |
| CORO1B | SNV | Missense_Mutation | novel | c.236N>A | p.Cys79Tyr | p.C79Y | Q9BR76 | protein_coding | deleterious(0.01) | probably_damaging(0.954) | TCGA-AJ-A3EK-01 | Endometrium | uterine corpus endometrioid carcinoma | Female | <65 | I/II | Chemotherapy | carboplatin | CR |
| Page: 1 2 3 4 |
Top |
Related drugs of malignant transformation related genes |
| Identification of chemicals and drugs interact with genes involved in malignant transfromation |
| (DGIdb 4.0) |
| Entrez ID | Symbol | Category | Interaction Types | Drug Claim Name | Drug Name | PMIDs |
| Page: 1 |

Copyright 2023-Present -The University of Texas Health Science Center at Houston |