Schematic overview of the cellular and molecular mechanisms involved in the cancer progression, including the proposed cellular and molecular mechanisms in cancer cells trajectory. AT1: alveolar type 1 cells; AT2: alveolar type 2 cells; AAH: atypical adenomatous hyperplasia; AIS: adenocarcinoma in situ; MIA: minimally invasive adenocarcinoma; IA: invasive adenocarcinoma; EMT: epithelial-mesenchymal transition

Home

Download

Statistics

Help

Contact

Center for Computational Systems Medicine
leaf

Gene summary

leaf

Malignant transformation analysis

leaf

Malignant transformation related pathway analysis

leaf

Cell-cell communication analysis

leaf

Single-cell gene regulatory network inference analysis

leaf

Somatic mutation of malignant transformation related genes

leaf

Related drugs of malignant transformation related genes

Gene: COPS5

Gene summary for COPS5

check button Gene summary.

Gene informationSpeciesHuman
Gene symbol

COPS5

Gene ID

10987

Gene nameCOP9 signalosome subunit 5
Gene AliasCSN5
Cytomap8q13.1
Gene Typeprotein-coding
GO ID

GO:0000165

UniProtAcc

A0A024R7W9


Top

Malignant transformation analysis

check button Identification of the aberrant gene expression in precancerous and cancerous lesions by comparing the gene expression of stem-like cells in diseased tissues with normal stem cells
check button Malignant transformation involving gene list.
Entrez IDSymbolReplicatesSpeciesOrganTissueAdj P-valueLog2FCMalignancy
10987COPS5HTA11_2487_2000001011HumanColorectumSER4.07e-021.83e-01-0.1808
10987COPS5HTA11_78_2000001011HumanColorectumAD1.53e-033.29e-01-0.1088
10987COPS5HTA11_347_2000001011HumanColorectumAD2.96e-072.54e-01-0.1954
10987COPS5HTA11_866_3004761011HumanColorectumAD6.99e-031.79e-010.096
10987COPS5HTA11_6801_2000001011HumanColorectumSER9.65e-033.66e-010.0171
10987COPS5HTA11_99999970781_79442HumanColorectumMSS2.04e-062.61e-010.294
10987COPS5HTA11_99999965062_69753HumanColorectumMSI-H1.17e-025.83e-010.3487
10987COPS5HTA11_99999971662_82457HumanColorectumMSS1.20e-134.72e-010.3859
10987COPS5HTA11_99999974143_84620HumanColorectumMSS4.73e-021.49e-010.3005
10987COPS5LZE4THumanEsophagusESCC3.43e-248.28e-010.0811
10987COPS5LZE5THumanEsophagusESCC6.45e-033.05e-010.0514
10987COPS5LZE7THumanEsophagusESCC5.70e-094.03e-010.0667
10987COPS5LZE8THumanEsophagusESCC2.35e-176.14e-010.067
10987COPS5LZE20THumanEsophagusESCC1.05e-157.09e-010.0662
10987COPS5LZE22D1HumanEsophagusHGIN3.03e-041.83e-010.0595
10987COPS5LZE22THumanEsophagusESCC3.21e-023.54e-010.068
10987COPS5LZE24THumanEsophagusESCC1.41e-351.16e+000.0596
10987COPS5LZE21THumanEsophagusESCC6.89e-032.47e-010.0655
10987COPS5LZE6THumanEsophagusESCC4.84e-104.78e-010.0845
10987COPS5P1T-EHumanEsophagusESCC1.34e-158.50e-010.0875
Page: 1 2 3 4 5 6 7 

check button Transcriptomic changes along malignancy continuum.
TissueExpression DynamicsAbbreviation
Colorectum (GSE201348)The image shows the transcriptomic changes along malignancy continuum.log2FC in expression of this searched gene in stem-like cells from each diseased tissue sample relative to stem-like cells in normal samples in each tissue plotted against the malignancy continuum. Samples are colored based on if they are from different disease stage.FAP: Familial adenomatous polyposis
CRC: Colorectal cancer
Colorectum (HTA11)The image shows the transcriptomic changes along malignancy continuum.log2FC in expression of this searched gene in stem-like cells from each diseased tissue sample relative to stem-like cells in normal samples in each tissue plotted against the malignancy continuum. Samples are colored based on if they are from different disease stage.AD: Adenomas
SER: Sessile serrated lesions
MSI-H: Microsatellite-high colorectal cancer
MSS: Microsatellite stable colorectal cancer
EsophagusThe image shows the transcriptomic changes along malignancy continuum.log2FC in expression of this searched gene in stem-like cells from each diseased tissue sample relative to stem-like cells in normal samples in each tissue plotted against the malignancy continuum. Samples are colored based on if they are from different disease stage.ESCC: Esophageal squamous cell carcinoma
HGIN: High-grade intraepithelial neoplasias
LGIN: Low-grade intraepithelial neoplasias
LiverThe image shows the transcriptomic changes along malignancy continuum.log2FC in expression of this searched gene in stem-like cells from each diseased tissue sample relative to stem-like cells in normal samples in each tissue plotted against the malignancy continuum. Samples are colored based on if they are from different disease stage.
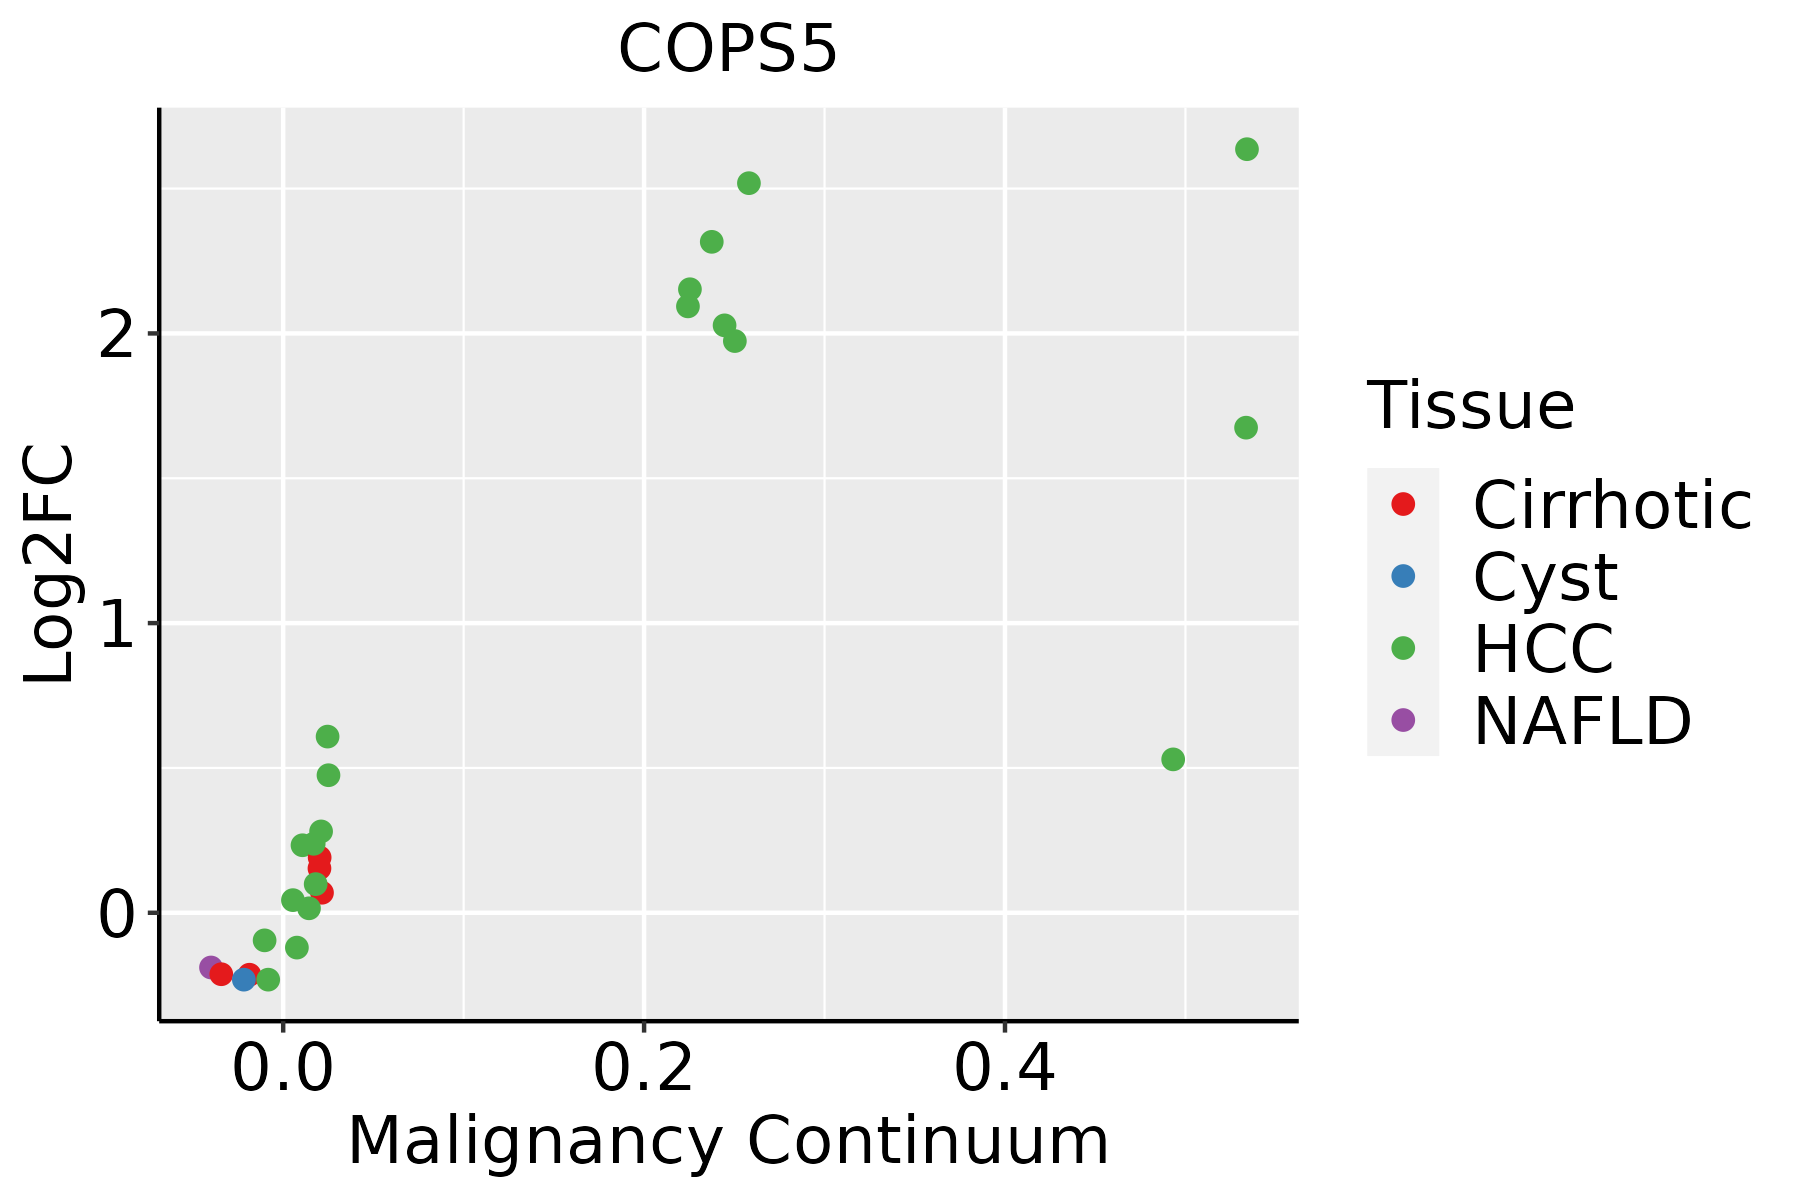
HCC: Hepatocellular carcinoma
NAFLD: Non-alcoholic fatty liver disease
Oral CavityThe image shows the transcriptomic changes along malignancy continuum.log2FC in expression of this searched gene in stem-like cells from each diseased tissue sample relative to stem-like cells in normal samples in each tissue plotted against the malignancy continuum. Samples are colored based on if they are from different disease stage.
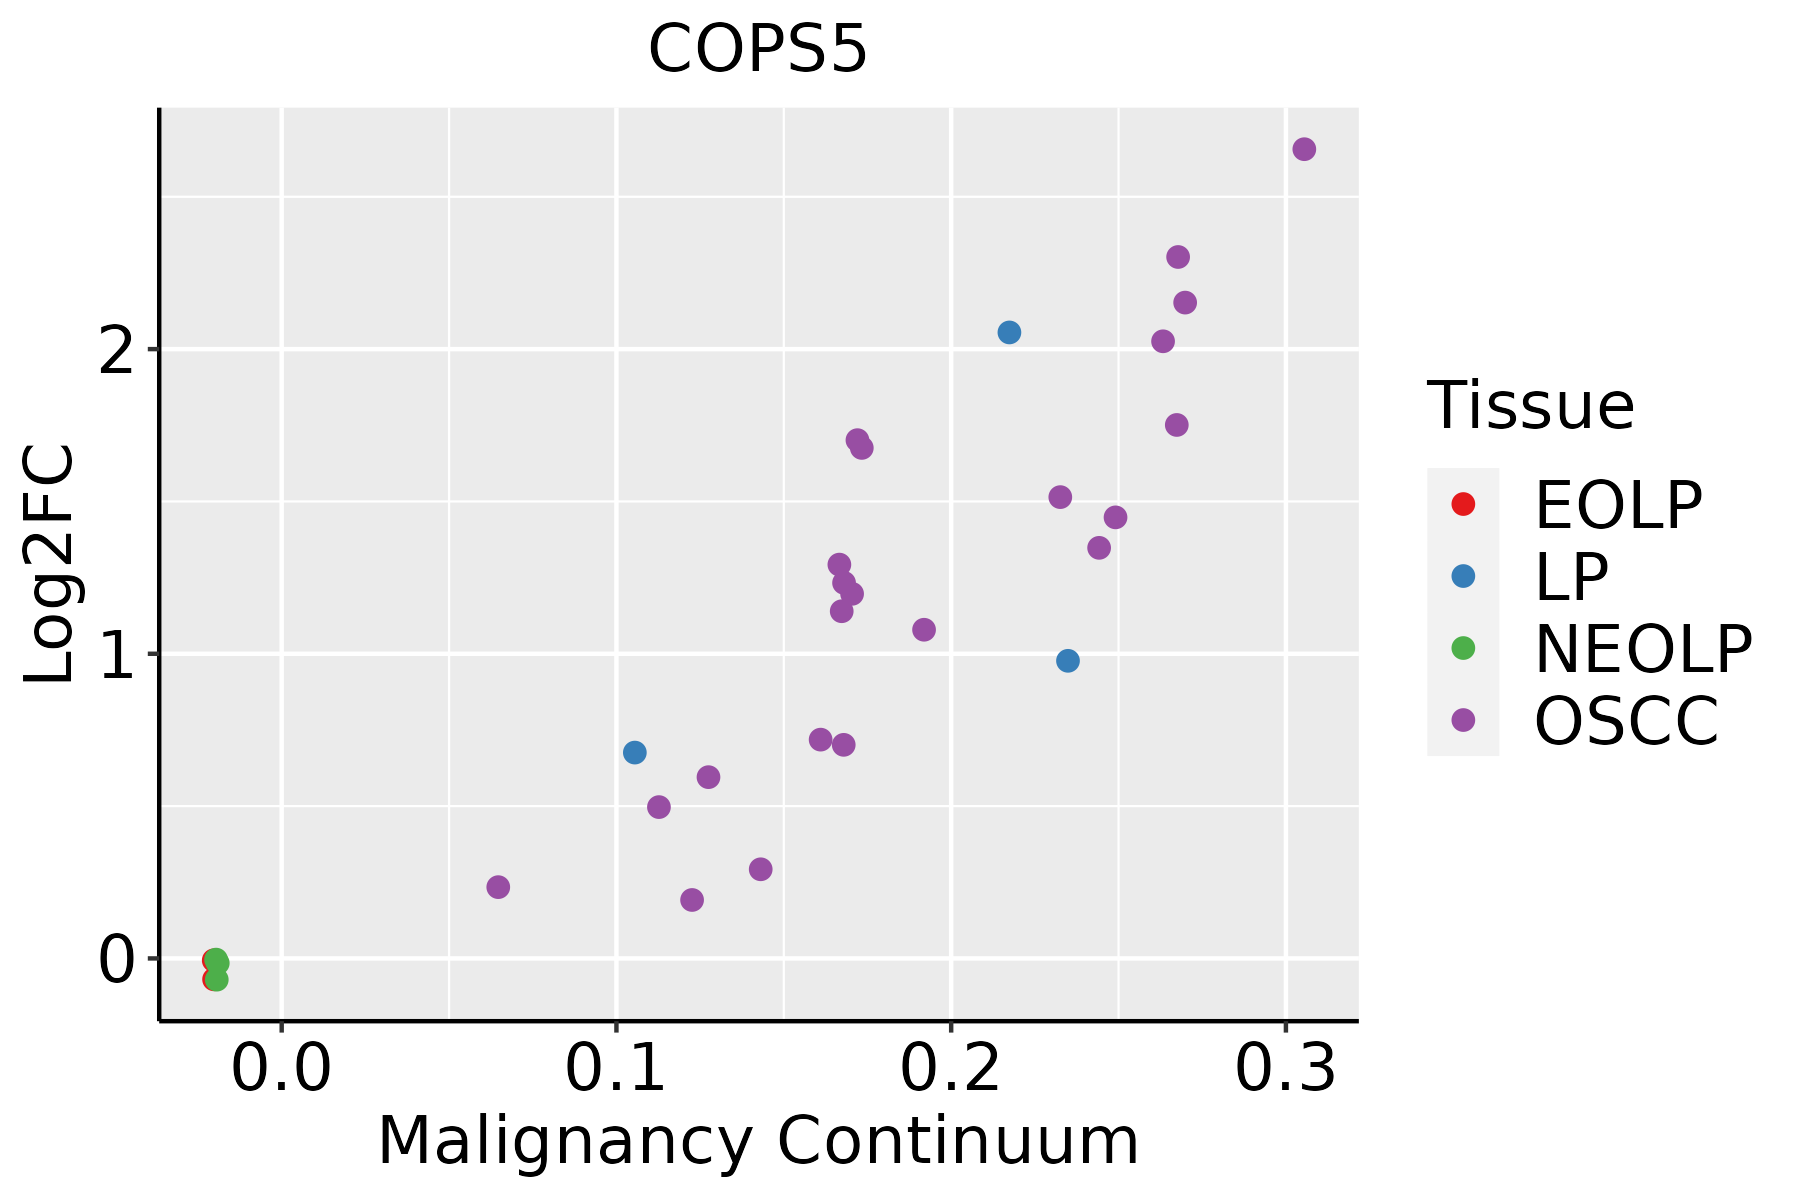
EOLP: Erosive Oral lichen planus
LP: leukoplakia
NEOLP: Non-erosive oral lichen planus
OSCC: Oral squamous cell carcinoma
SkinThe image shows the transcriptomic changes along malignancy continuum.log2FC in expression of this searched gene in stem-like cells from each diseased tissue sample relative to stem-like cells in normal samples in each tissue plotted against the malignancy continuum. Samples are colored based on if they are from different disease stage.
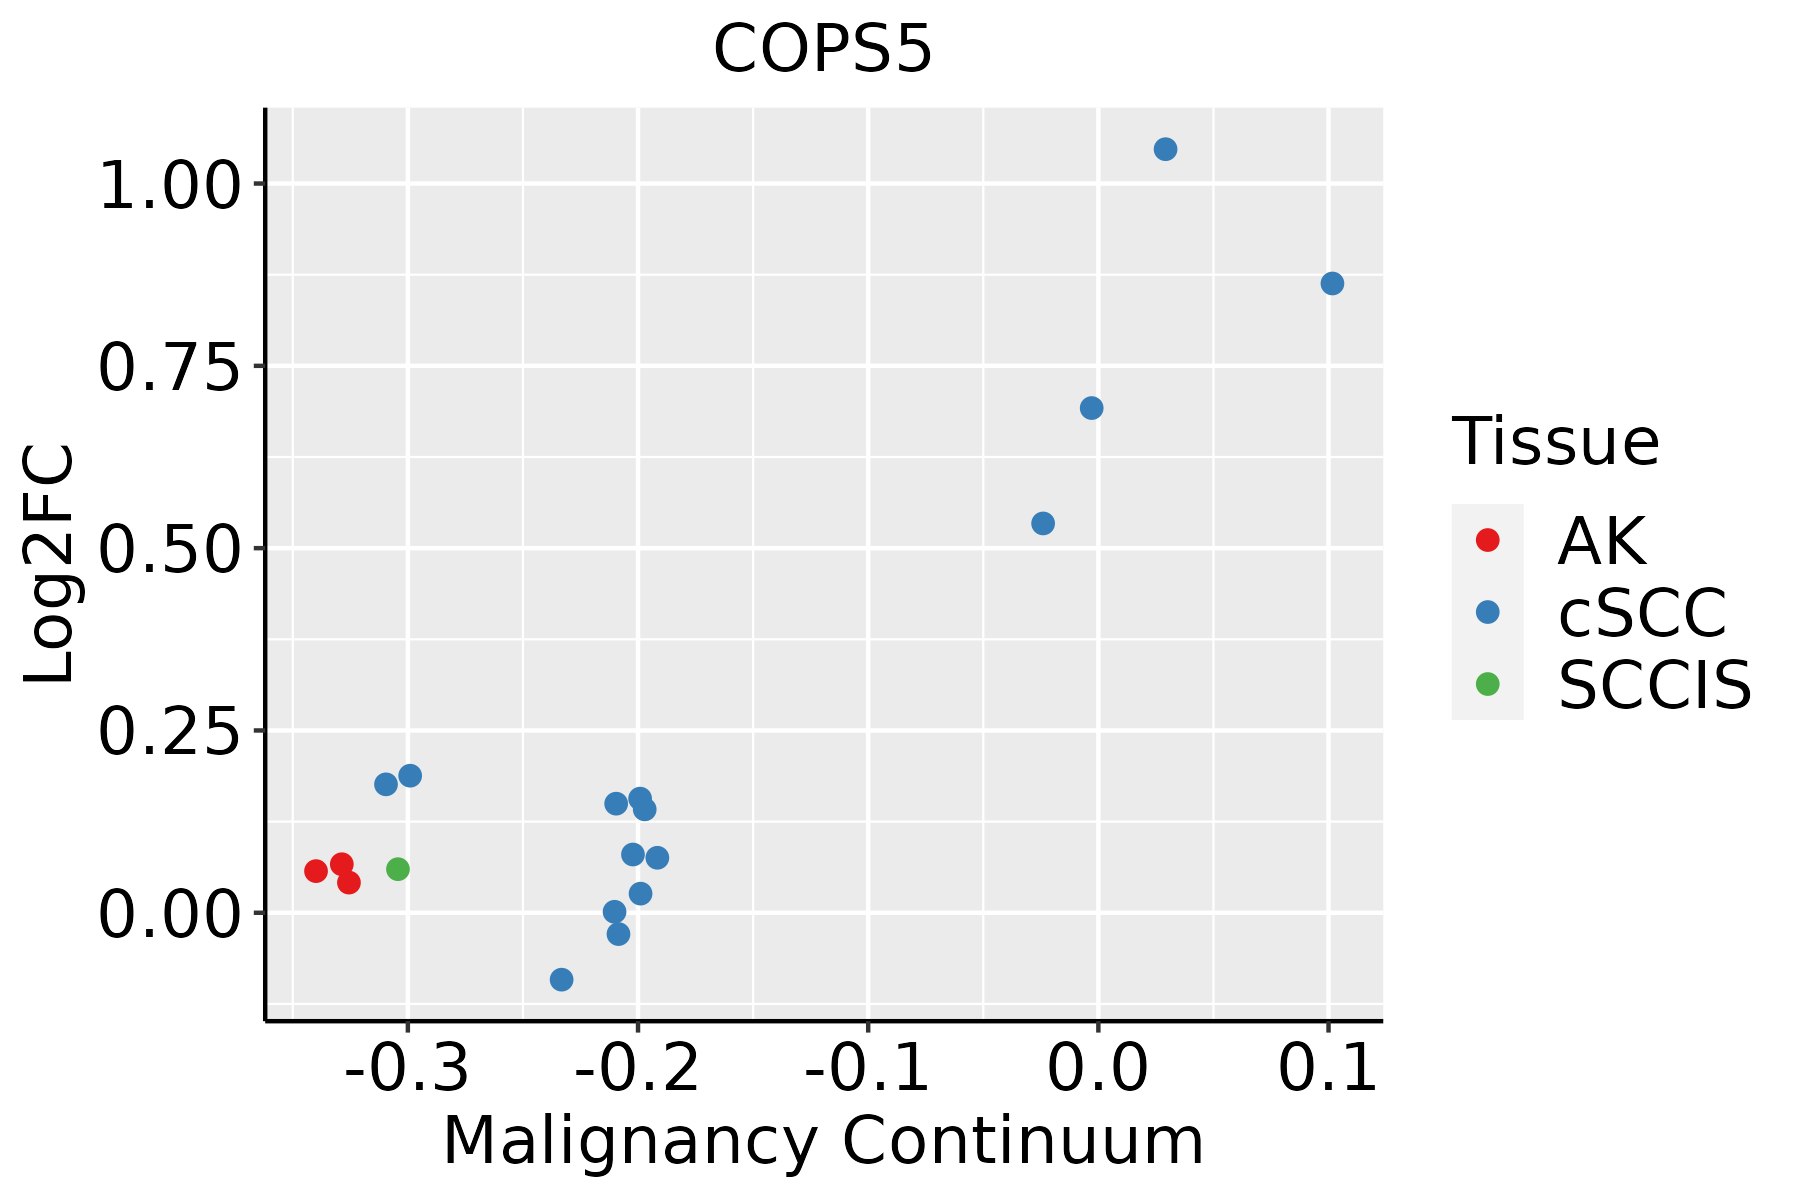
AK: Actinic keratosis
cSCC: Cutaneous squamous cell carcinoma
SCCIS:squamous cell carcinoma in situ
ThyroidThe image shows the transcriptomic changes along malignancy continuum.log2FC in expression of this searched gene in stem-like cells from each diseased tissue sample relative to stem-like cells in normal samples in each tissue plotted against the malignancy continuum. Samples are colored based on if they are from different disease stage.
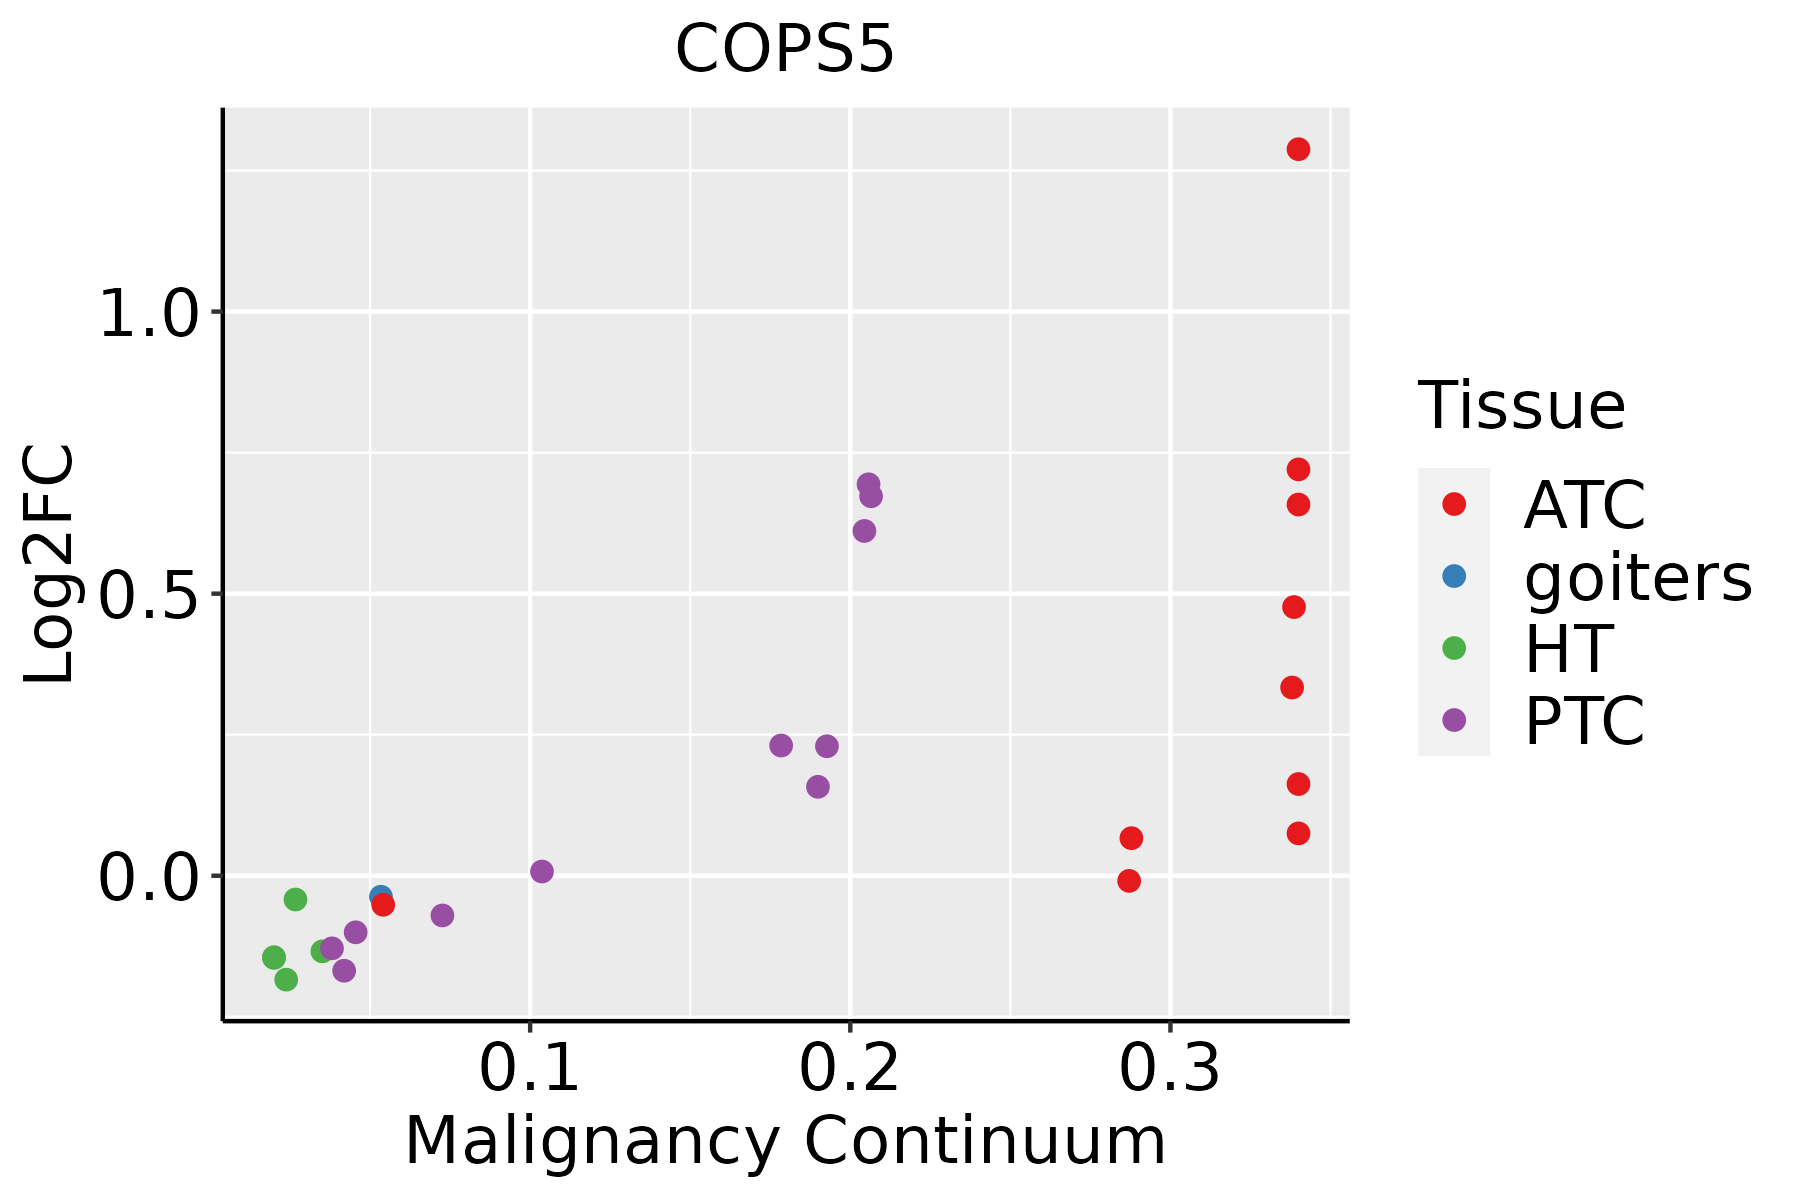
ATC: Anaplastic thyroid cancer
HT: Hashimoto's thyroiditis
PTC: Papillary thyroid cancer
∗log2FC in expression of this searched gene in stem-like cells from each diseased tissue sample relative to stem-like cells in normal samples in each tissue plotted against the malignancy continuum. Samples are colored based on if they are from different disease stage.

Top

Malignant transformation related pathway analysis

check buttonFind out the enriched GO biological processes and KEGG pathways involved in transition from healthy to precancer to cancer
check button Figure of enriched GO biological processes.
TissueDisease StageEnriched GO biological Processes
ColorectumADGO analysis - Figure of enriched GO biological processes: Top 15 enriched GO BP terms are showed in the bar plot of each disease state in each tissue. Each row represents a significant GO biological process which is colored according to the -log10(p.adjust).
ColorectumSERGO analysis - Figure of enriched GO biological processes: Top 15 enriched GO BP terms are showed in the bar plot of each disease state in each tissue. Each row represents a significant GO biological process which is colored according to the -log10(p.adjust).
ColorectumMSSGO analysis - Figure of enriched GO biological processes: Top 15 enriched GO BP terms are showed in the bar plot of each disease state in each tissue. Each row represents a significant GO biological process which is colored according to the -log10(p.adjust).
ColorectumMSI-HGO analysis - Figure of enriched GO biological processes: Top 15 enriched GO BP terms are showed in the bar plot of each disease state in each tissue. Each row represents a significant GO biological process which is colored according to the -log10(p.adjust).
ColorectumFAPGO analysis - Figure of enriched GO biological processes: Top 15 enriched GO BP terms are showed in the bar plot of each disease state in each tissue. Each row represents a significant GO biological process which is colored according to the -log10(p.adjust).
∗Top 15 enriched GO BP terms are showed in the bar plot of each disease state in each tissue. Each row represents a significant GO biological process which is colored according to the -log10(p.adjust).
Page: 1 2 3 4 5 6 7 8 9 

check button Enriched GO biological processes.
GO IDTissueDisease StageDescriptionGene RatioBg Ratiopvaluep.adjustCount
GO:0032872110ThyroidPTCregulation of stress-activated MAPK cascade81/5968192/187231.62e-038.95e-0381
GO:00165794ThyroidPTCprotein deubiquitination59/5968139/187235.50e-032.50e-0259
GO:003497633ThyroidATCresponse to endoplasmic reticulum stress167/6293256/187232.62e-251.03e-22167
GO:000641334ThyroidATCtranslational initiation83/6293118/187233.44e-162.88e-1483
GO:003596633ThyroidATCresponse to topologically incorrect protein102/6293159/187232.87e-151.99e-13102
GO:000698633ThyroidATCresponse to unfolded protein88/6293137/187232.04e-139.91e-1288
GO:003596733ThyroidATCcellular response to topologically incorrect protein74/6293116/187232.69e-119.20e-1074
GO:003462033ThyroidATCcellular response to unfolded protein61/629396/187231.84e-094.52e-0861
GO:190589728ThyroidATCregulation of response to endoplasmic reticulum stress54/629382/187232.34e-095.58e-0854
GO:003096823ThyroidATCendoplasmic reticulum unfolded protein response49/629374/187239.75e-092.03e-0749
GO:003109826ThyroidATCstress-activated protein kinase signaling cascade120/6293247/187237.06e-079.46e-06120
GO:005140326ThyroidATCstress-activated MAPK cascade115/6293239/187232.17e-062.58e-05115
GO:199018216ThyroidATCexosomal secretion17/629320/187233.20e-063.62e-0517
GO:009773416ThyroidATCextracellular exosome biogenesis17/629321/187231.15e-051.12e-0417
GO:014011214ThyroidATCextracellular vesicle biogenesis18/629323/187231.47e-051.39e-0418
GO:005109022ThyroidATCregulation of DNA-binding transcription factor activity190/6293440/187231.49e-051.39e-04190
GO:190010118ThyroidATCregulation of endoplasmic reticulum unfolded protein response20/629330/187232.18e-041.43e-0320
GO:007030226ThyroidATCregulation of stress-activated protein kinase signaling cascade89/6293195/187233.05e-041.93e-0389
GO:003287226ThyroidATCregulation of stress-activated MAPK cascade87/6293192/187234.72e-042.77e-0387
GO:190389411ThyroidATCregulation of IRE1-mediated unfolded protein response11/629314/187237.46e-044.14e-0311
Page: 1 2 3 4 5 6 7 8 9 10 11 12 13 

check button Enriched KEGG pathways.
Pathway IDTissueDisease StageDescriptionGene RatioBg Ratiopvaluep.adjustqvalueCount
Page: 1 

Top

Cell-cell communication analysis

check buttonIdentification of potential cell-cell interactions between two cell types and their ligand-receptor pairs for different disease states
LigandReceptorLRpairPathwayTissueDisease Stage
Page: 1 

Top

Single-cell gene regulatory network inference analysis

check buttonFind out the significant the regulons (TFs) and the target genes of each regulon across cell types for different disease states
TFCell TypeTissueDisease StageTarget GeneRSSRegulon Activity
∗The dot plots of a searched regulon are shown for all cell subpopulations in each disease state of each tissue based on the regulon specific score inferred using pySCENIC and by calculating the average expression.
Page: 1 

Top

Somatic mutation of malignant transformation related genes

check buttonAnnotation of somatic variants for genes involved in malignant transformation
Hugo SymbolVariant ClassVariant ClassificationdbSNP RSHGVScHGVSpHGVSp ShortSWISSPROTBIOTYPESIFTPolyPhenTumor Sample BarcodeTissueHistologySexAgeStageTherapy TypesDrugsOutcome
COPS5insertionFrame_Shift_Insnovelc.98_99insCp.Lys33AsnfsTer15p.K33Nfs*15Q92905protein_codingTCGA-AN-A046-01Breastbreast invasive carcinomaFemale>=65I/IIUnknownUnknownSD
COPS5insertionIn_Frame_Insnovelc.96_97insCTTGAGCCCAGTGTCGACATGCACCTTGTTTGGGTCTTCp.Asp32_Lys33insLeuGluProSerValAspMetHisLeuValTrpValPhep.D32_K33insLEPSVDMHLVWVFQ92905protein_codingTCGA-AN-A046-01Breastbreast invasive carcinomaFemale>=65I/IIUnknownUnknownSD
COPS5SNVMissense_Mutationc.592N>Ap.Glu198Lysp.E198KQ92905protein_codingtolerated(0.26)benign(0.367)TCGA-C5-A1BQ-01Cervixcervical & endocervical cancerFemale>=65III/IVChemotherapycisplatinCR
COPS5SNVMissense_Mutationnovelc.94N>Ap.Asp32Asnp.D32NQ92905protein_codingtolerated(0.11)benign(0.056)TCGA-C5-A2LZ-01Cervixcervical & endocervical cancerFemale>=65III/IVUnknownUnknownPD
COPS5SNVMissense_Mutationnovelc.715N>Cp.Glu239Glnp.E239QQ92905protein_codingtolerated(0.05)benign(0.027)TCGA-MA-AA41-01Cervixcervical & endocervical cancerFemale<65I/IIUnknownUnknownSD
COPS5SNVMissense_Mutationnovelc.86N>Gp.Tyr29Cysp.Y29CQ92905protein_codingdeleterious(0)possibly_damaging(0.873)TCGA-AD-6964-01Colorectumcolon adenocarcinomaMale<65III/IVChemotherapyfolfoxPD
COPS5SNVMissense_Mutationrs143525514c.872C>Tp.Thr291Metp.T291MQ92905protein_codingtolerated(0.13)benign(0.15)TCGA-AG-3902-01Colorectumrectum adenocarcinomaMale<65I/IIUnknownUnknownSD
COPS5SNVMissense_Mutationc.881N>Ap.Arg294Glnp.R294QQ92905protein_codingtolerated(0.16)benign(0.048)TCGA-EI-6882-01Colorectumrectum adenocarcinomaMale<65I/IIUnknownUnknownSD
COPS5SNVMissense_Mutationc.804T>Ap.Asp268Glup.D268EQ92905protein_codingdeleterious(0.02)probably_damaging(0.976)TCGA-A5-A0GA-01Endometriumuterine corpus endometrioid carcinomaFemale>=65III/IVChemotherapytaxolPD
COPS5SNVMissense_Mutationc.34N>Gp.Thr12Alap.T12AQ92905protein_codingtolerated(0.19)benign(0.006)TCGA-AP-A056-01Endometriumuterine corpus endometrioid carcinomaFemale<65I/IIUnknownUnknownSD
Page: 1 2 3 4 

Top

Related drugs of malignant transformation related genes

check buttonIdentification of chemicals and drugs interact with genes involved in malignant transfromation
(DGIdb 4.0)
Entrez IDSymbolCategoryInteraction TypesDrug Claim NameDrug NamePMIDs
Page: 1