
|
|||||
|
 | |
| |
| |
| |
| |
| |
|
Gene: APEX1 |
Gene summary for APEX1 |
| Gene information | Species | Human | Gene symbol | APEX1 | Gene ID | 328 |
| Gene name | apurinic/apyrimidinic endodeoxyribonuclease 1 | |
| Gene Alias | APE | |
| Cytomap | 14q11.2 | |
| Gene Type | protein-coding | GO ID | GO:0000082 | UniProtAcc | P27695 |
Top |
Malignant transformation analysis |
| Identification of the aberrant gene expression in precancerous and cancerous lesions by comparing the gene expression of stem-like cells in diseased tissues with normal stem cells |
| Entrez ID | Symbol | Replicates | Species | Organ | Tissue | Adj P-value | Log2FC | Malignancy |
| 328 | APEX1 | GSM4909285 | Human | Breast | IDC | 1.63e-09 | 4.12e-01 | 0.21 |
| 328 | APEX1 | GSM4909286 | Human | Breast | IDC | 7.32e-03 | 2.18e-01 | 0.1081 |
| 328 | APEX1 | GSM4909291 | Human | Breast | IDC | 4.85e-15 | 6.07e-01 | 0.1753 |
| 328 | APEX1 | GSM4909293 | Human | Breast | IDC | 5.95e-09 | 3.84e-01 | 0.1581 |
| 328 | APEX1 | GSM4909296 | Human | Breast | IDC | 5.46e-07 | -1.99e-01 | 0.1524 |
| 328 | APEX1 | GSM4909297 | Human | Breast | IDC | 9.89e-09 | -1.36e-01 | 0.1517 |
| 328 | APEX1 | GSM4909305 | Human | Breast | IDC | 5.01e-04 | 2.97e-01 | 0.0436 |
| 328 | APEX1 | GSM4909311 | Human | Breast | IDC | 1.20e-26 | -3.58e-01 | 0.1534 |
| 328 | APEX1 | GSM4909312 | Human | Breast | IDC | 6.98e-09 | 4.26e-03 | 0.1552 |
| 328 | APEX1 | GSM4909319 | Human | Breast | IDC | 2.61e-29 | -3.42e-01 | 0.1563 |
| 328 | APEX1 | GSM4909320 | Human | Breast | IDC | 5.68e-03 | -2.18e-01 | 0.1575 |
| 328 | APEX1 | GSM4909321 | Human | Breast | IDC | 2.23e-10 | 4.03e-03 | 0.1559 |
| 328 | APEX1 | brca2 | Human | Breast | Precancer | 1.49e-05 | 2.10e-01 | -0.024 |
| 328 | APEX1 | brca3 | Human | Breast | Precancer | 1.63e-05 | 2.17e-01 | -0.0263 |
| 328 | APEX1 | NCCBC14 | Human | Breast | DCIS | 6.62e-05 | -1.20e-01 | 0.2021 |
| 328 | APEX1 | NCCBC3 | Human | Breast | DCIS | 4.00e-04 | 3.05e-01 | 0.1198 |
| 328 | APEX1 | NCCBC5 | Human | Breast | DCIS | 8.68e-06 | -2.11e-01 | 0.2046 |
| 328 | APEX1 | P1 | Human | Breast | IDC | 1.22e-14 | -2.73e-01 | 0.1527 |
| 328 | APEX1 | DCIS2 | Human | Breast | DCIS | 1.71e-69 | 2.43e-01 | 0.0085 |
| 328 | APEX1 | HTA11_3410_2000001011 | Human | Colorectum | AD | 1.44e-06 | 3.54e-01 | 0.0155 |
| Page: 1 2 3 4 5 6 7 8 9 10 11 |
| Tissue | Expression Dynamics | Abbreviation |
| Breast | 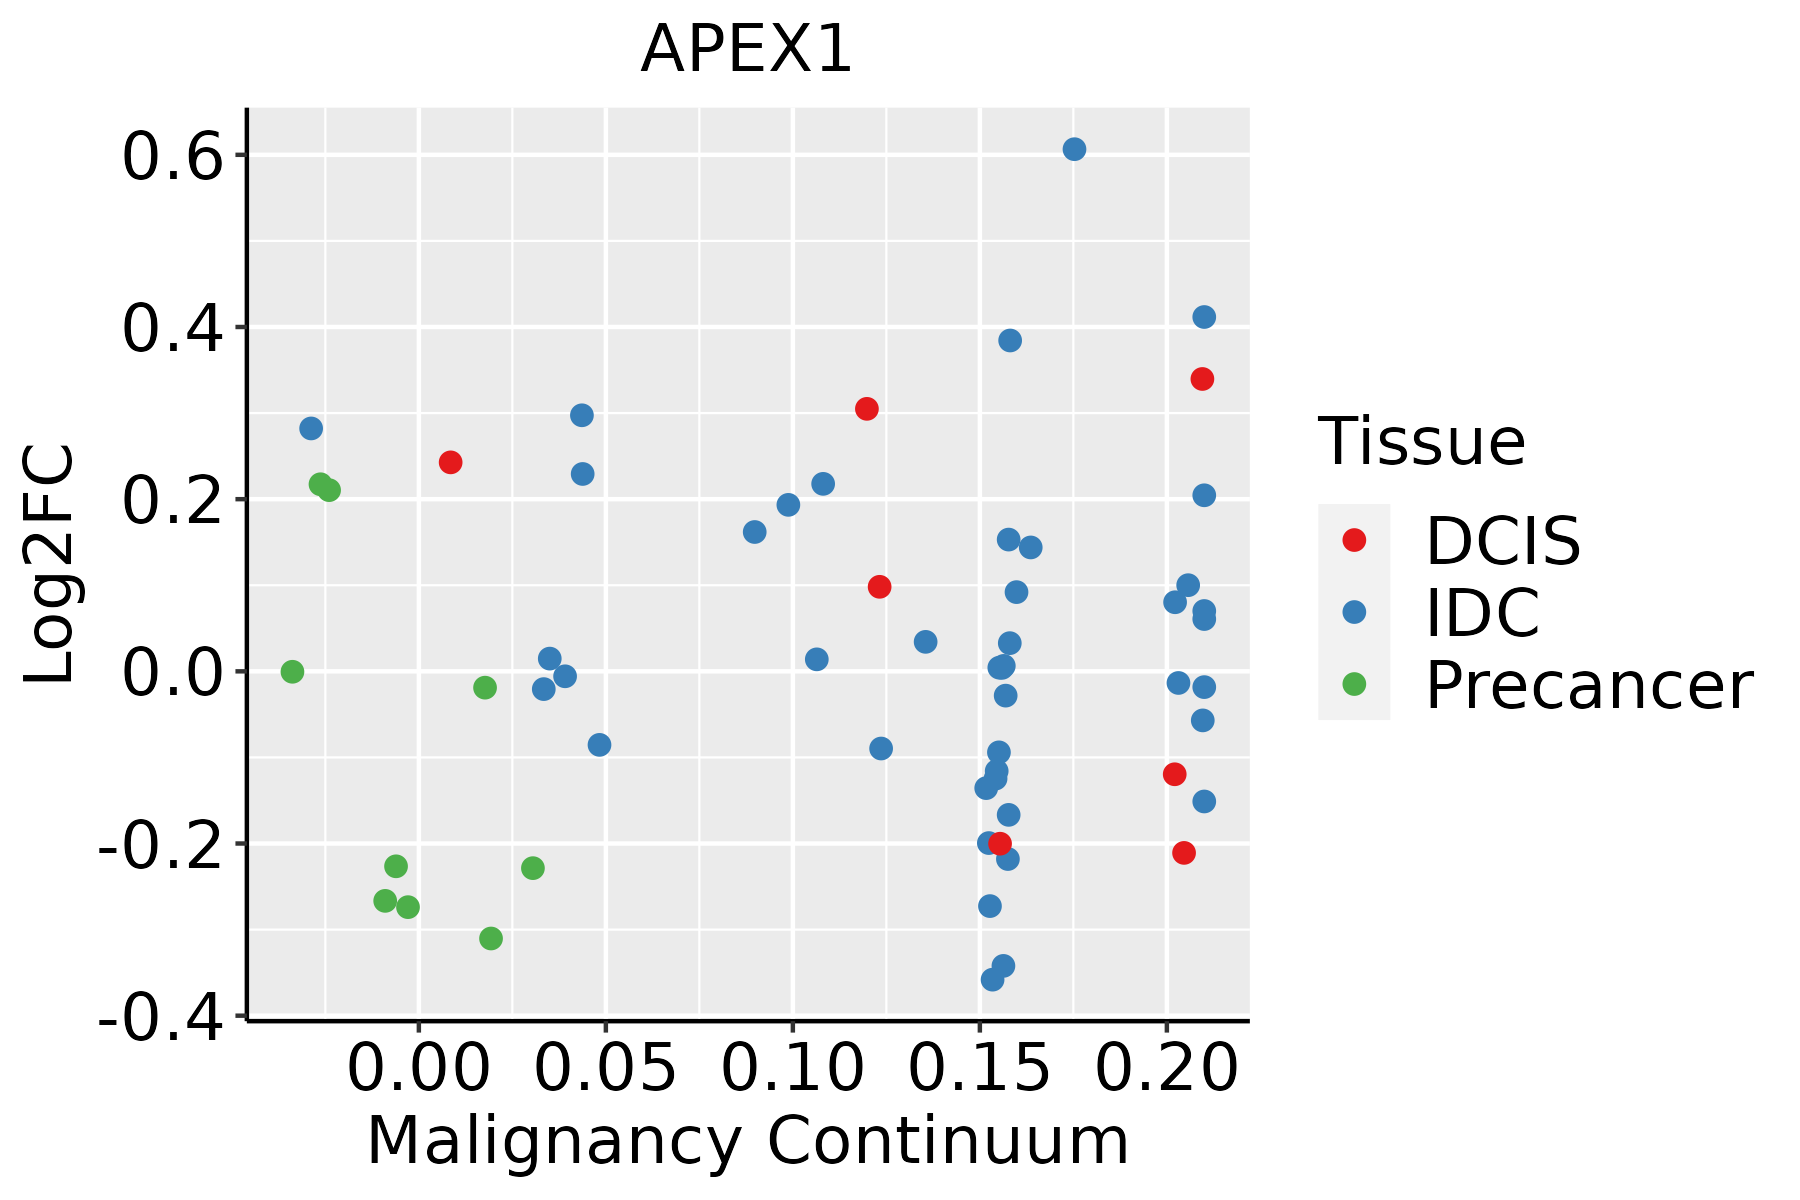 | IDC: Invasive ductal carcinoma |
| DCIS: Ductal carcinoma in situ | ||
| Precancer(BRCA1-mut): Precancerous lesion from BRCA1 mutation carriers | ||
| Colorectum (GSE201348) |  | FAP: Familial adenomatous polyposis |
| CRC: Colorectal cancer | ||
| Colorectum (HTA11) | 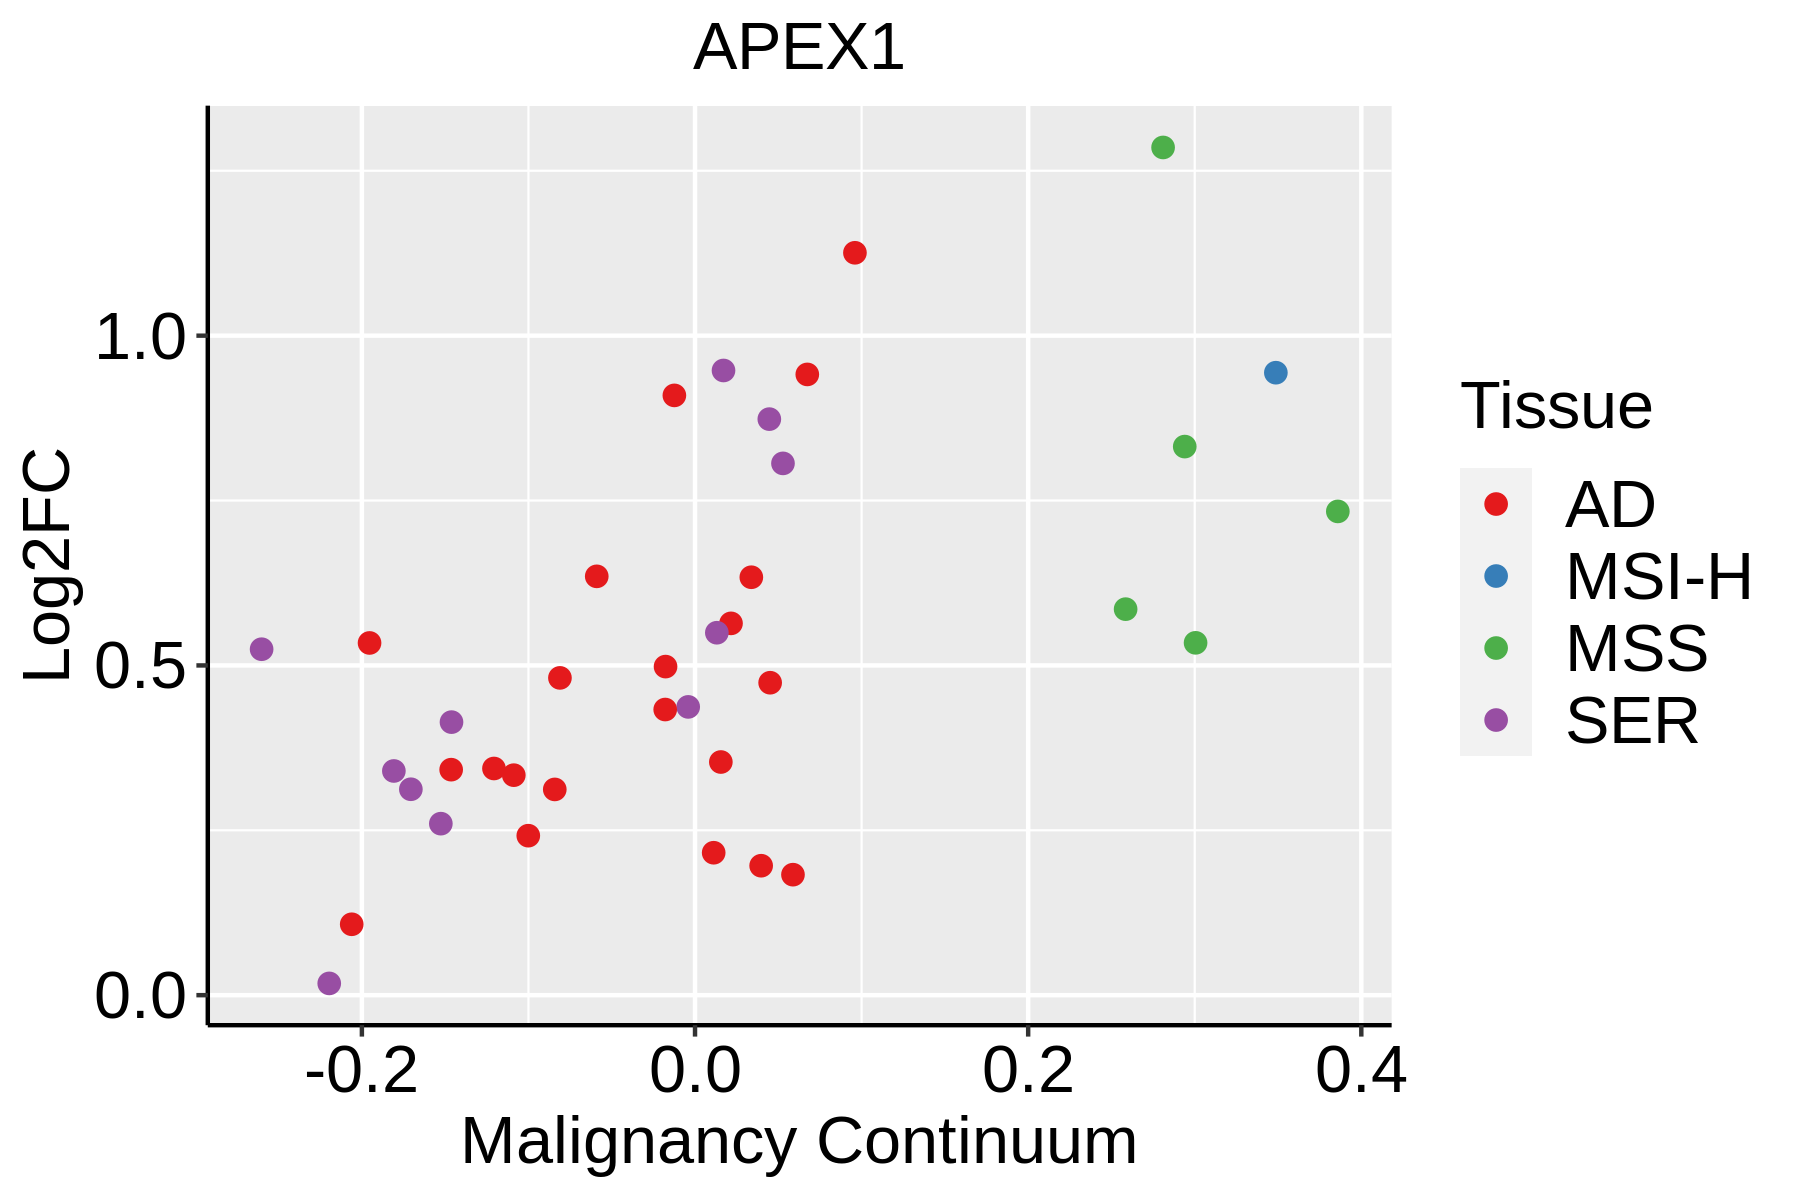 | AD: Adenomas |
| SER: Sessile serrated lesions | ||
| MSI-H: Microsatellite-high colorectal cancer | ||
| MSS: Microsatellite stable colorectal cancer | ||
| Endometrium |  | AEH: Atypical endometrial hyperplasia |
| EEC: Endometrioid Cancer | ||
| Esophagus | 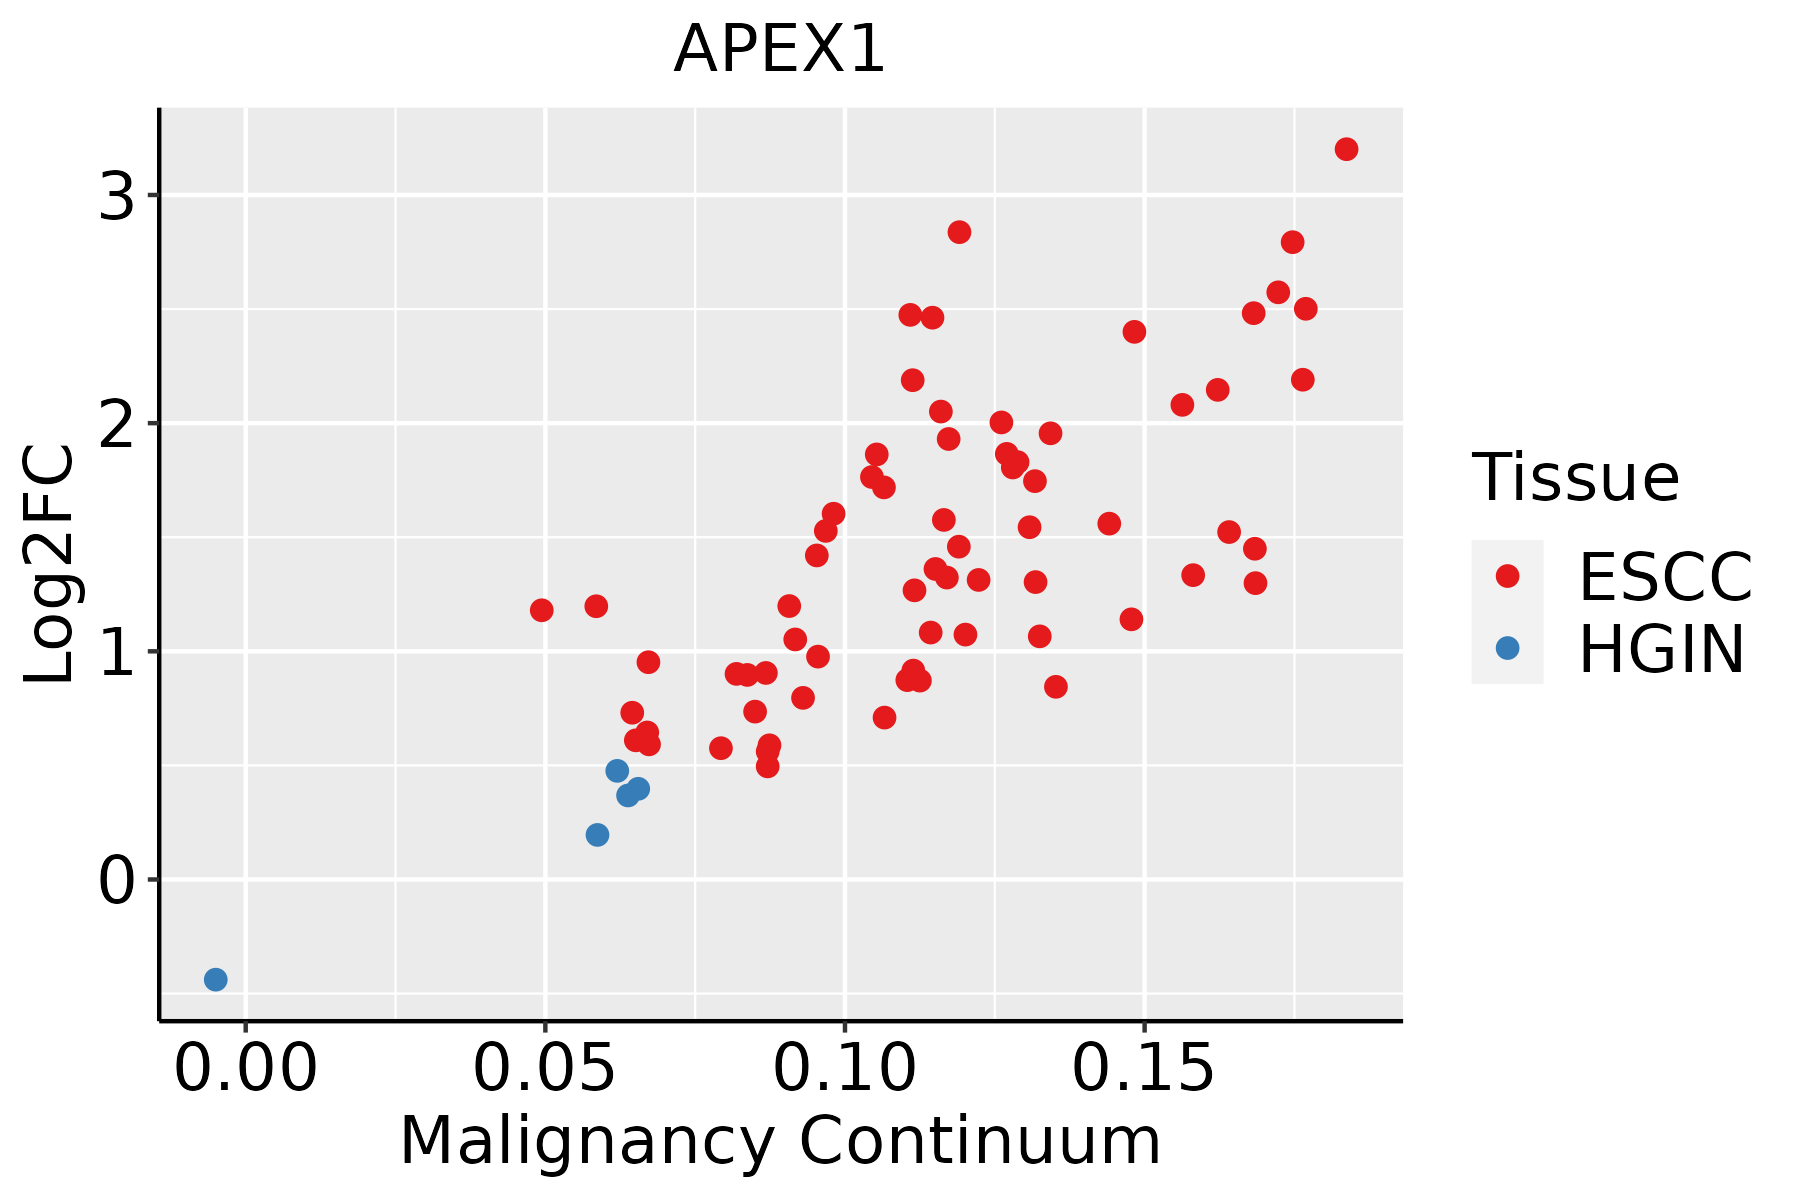 | ESCC: Esophageal squamous cell carcinoma |
| HGIN: High-grade intraepithelial neoplasias | ||
| LGIN: Low-grade intraepithelial neoplasias | ||
| Liver |  | HCC: Hepatocellular carcinoma |
| NAFLD: Non-alcoholic fatty liver disease | ||
| Oral Cavity | 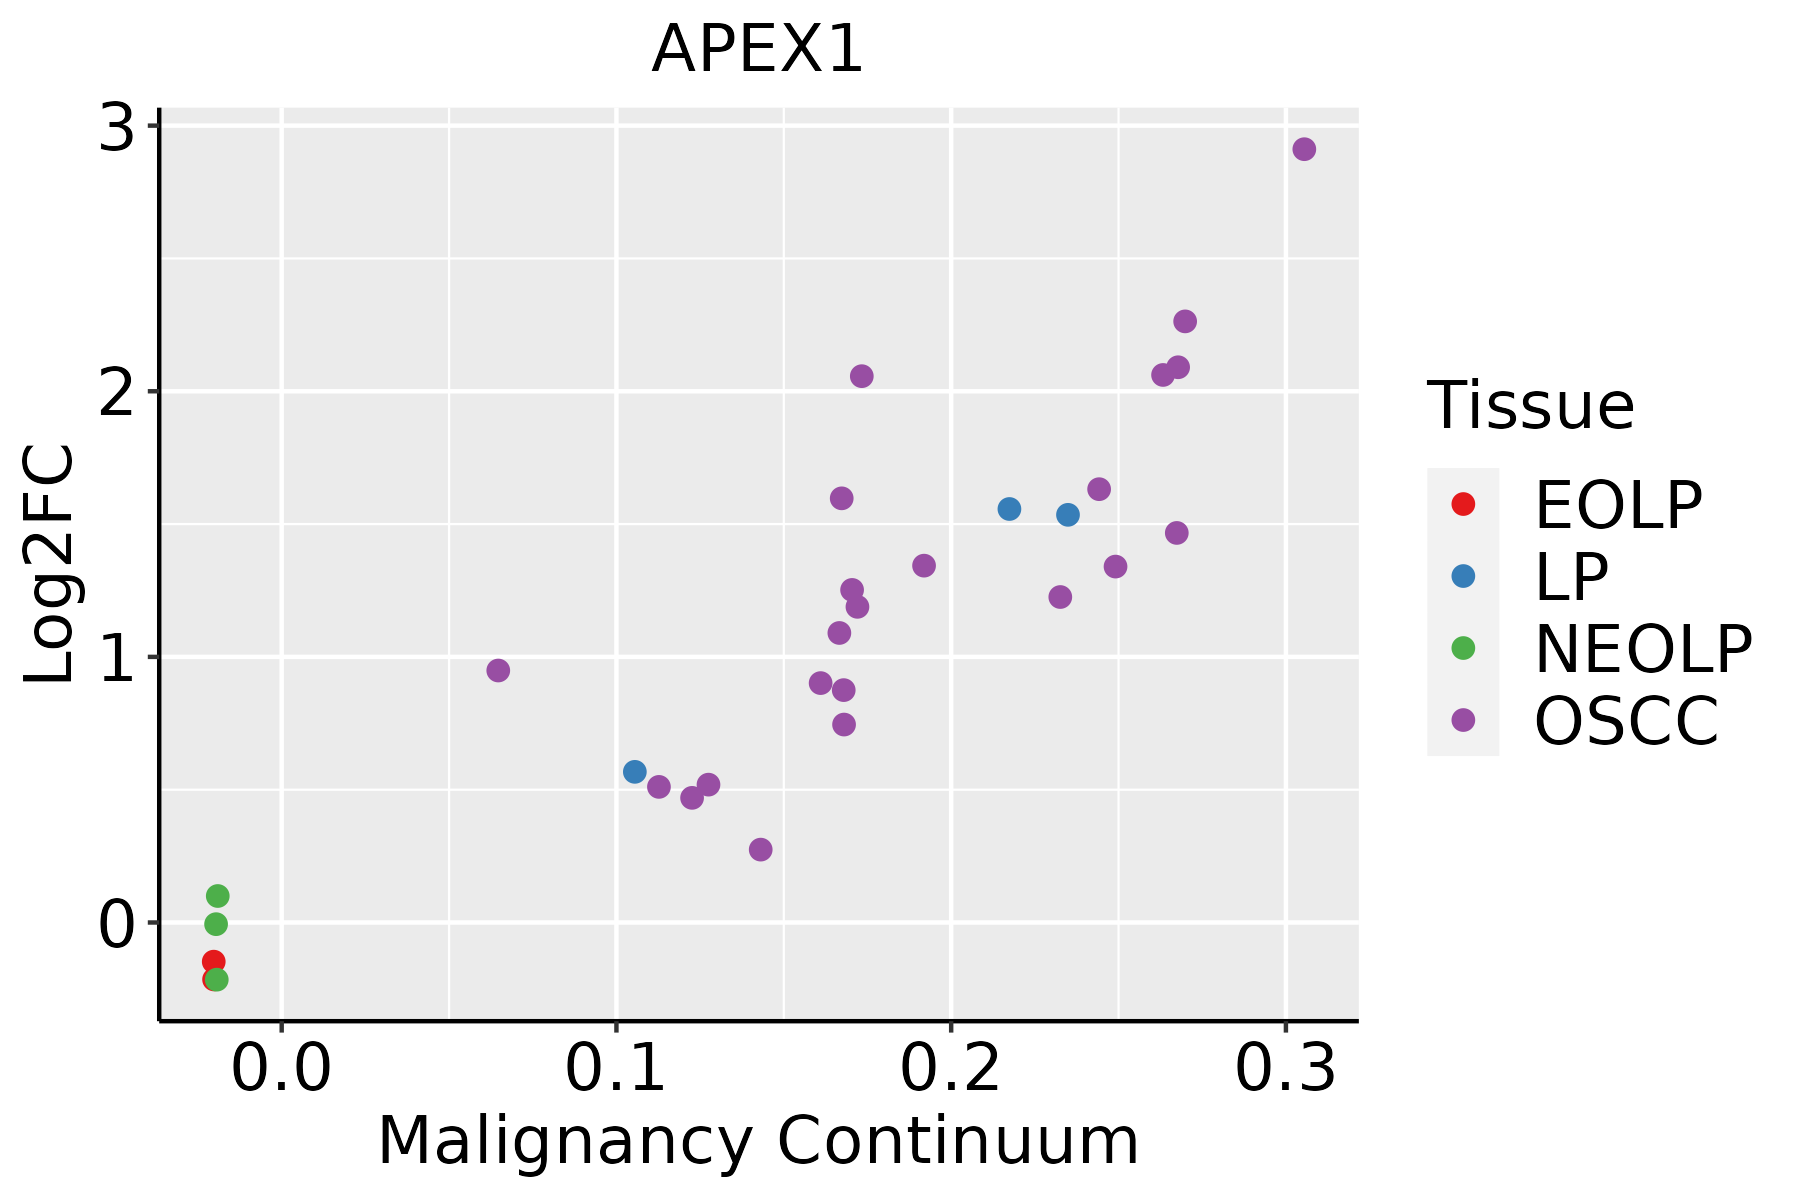 | EOLP: Erosive Oral lichen planus |
| LP: leukoplakia | ||
| NEOLP: Non-erosive oral lichen planus | ||
| OSCC: Oral squamous cell carcinoma | ||
| Prostate |  | BPH: Benign Prostatic Hyperplasia |
| Skin | 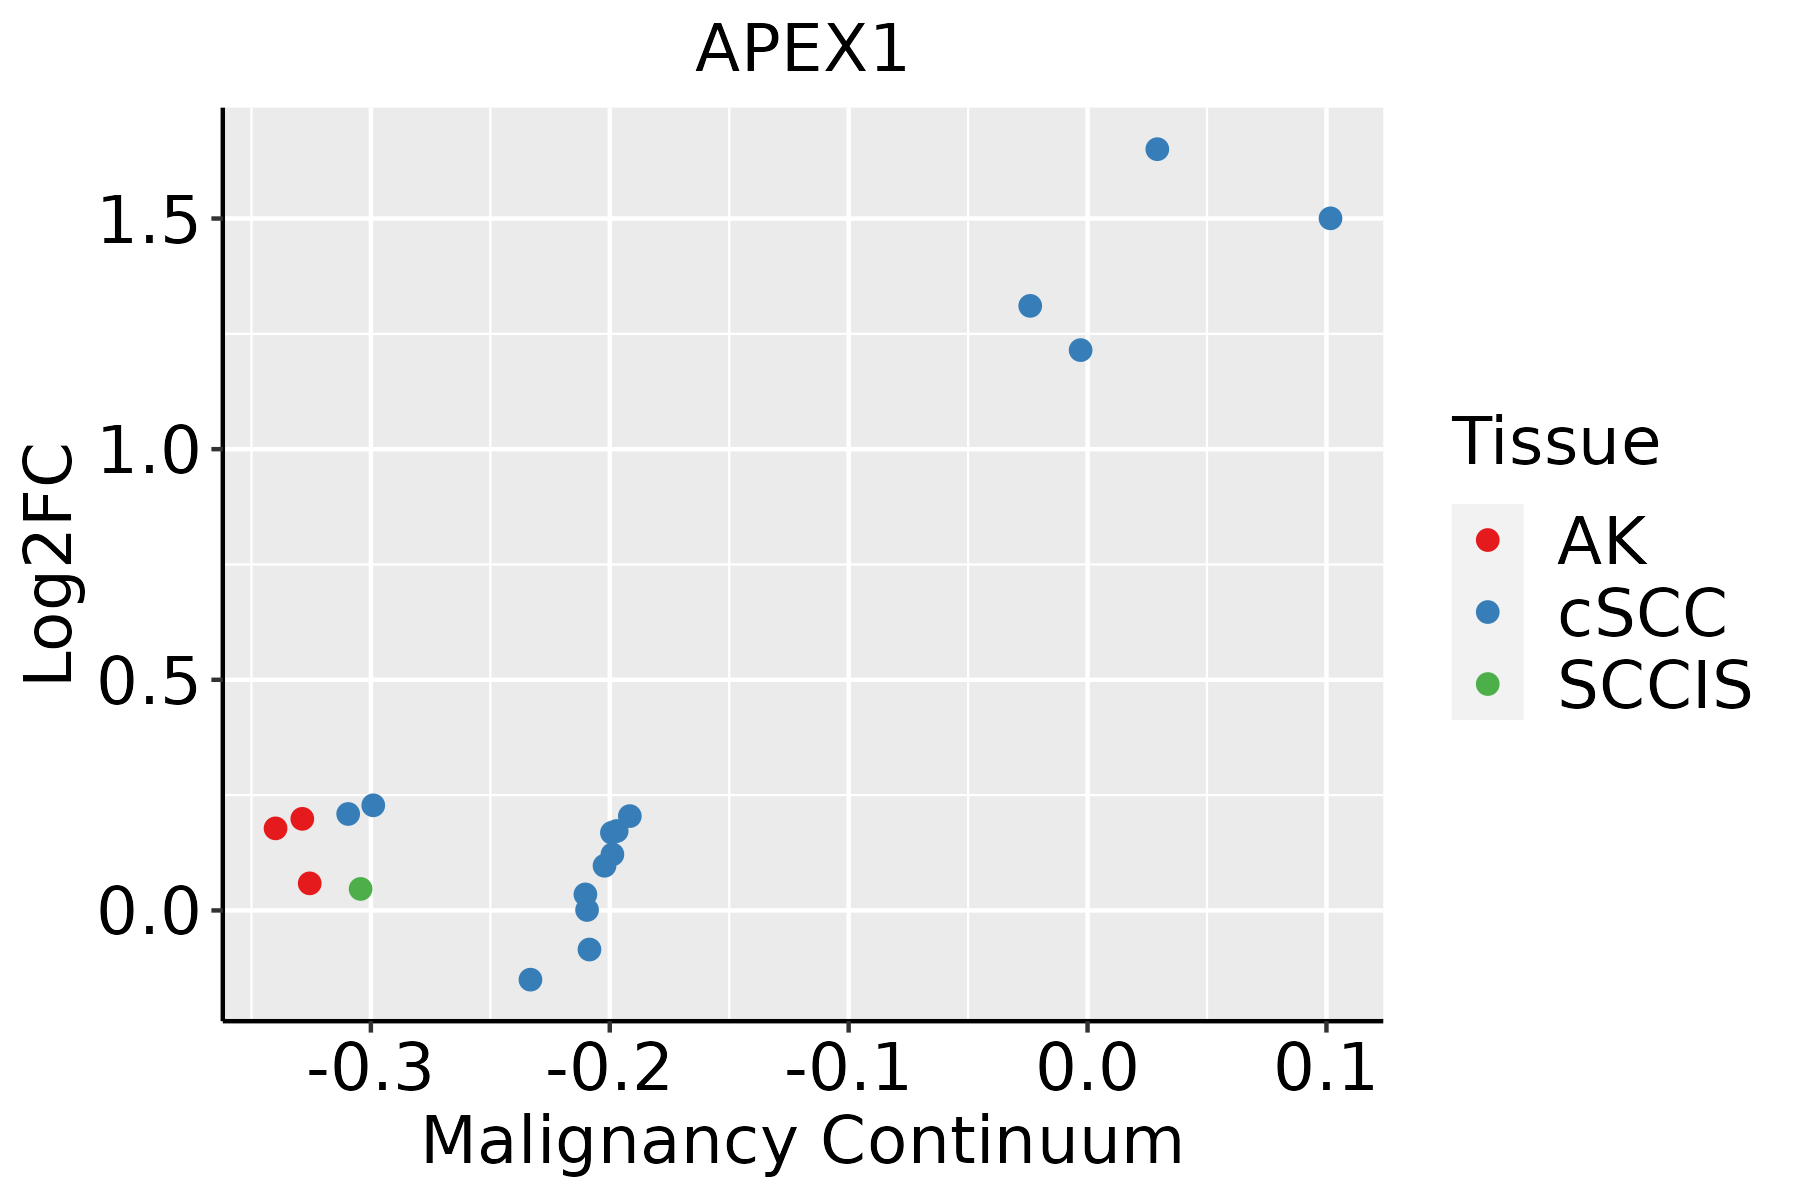 | AK: Actinic keratosis |
| cSCC: Cutaneous squamous cell carcinoma | ||
| SCCIS:squamous cell carcinoma in situ | ||
| Thyroid | 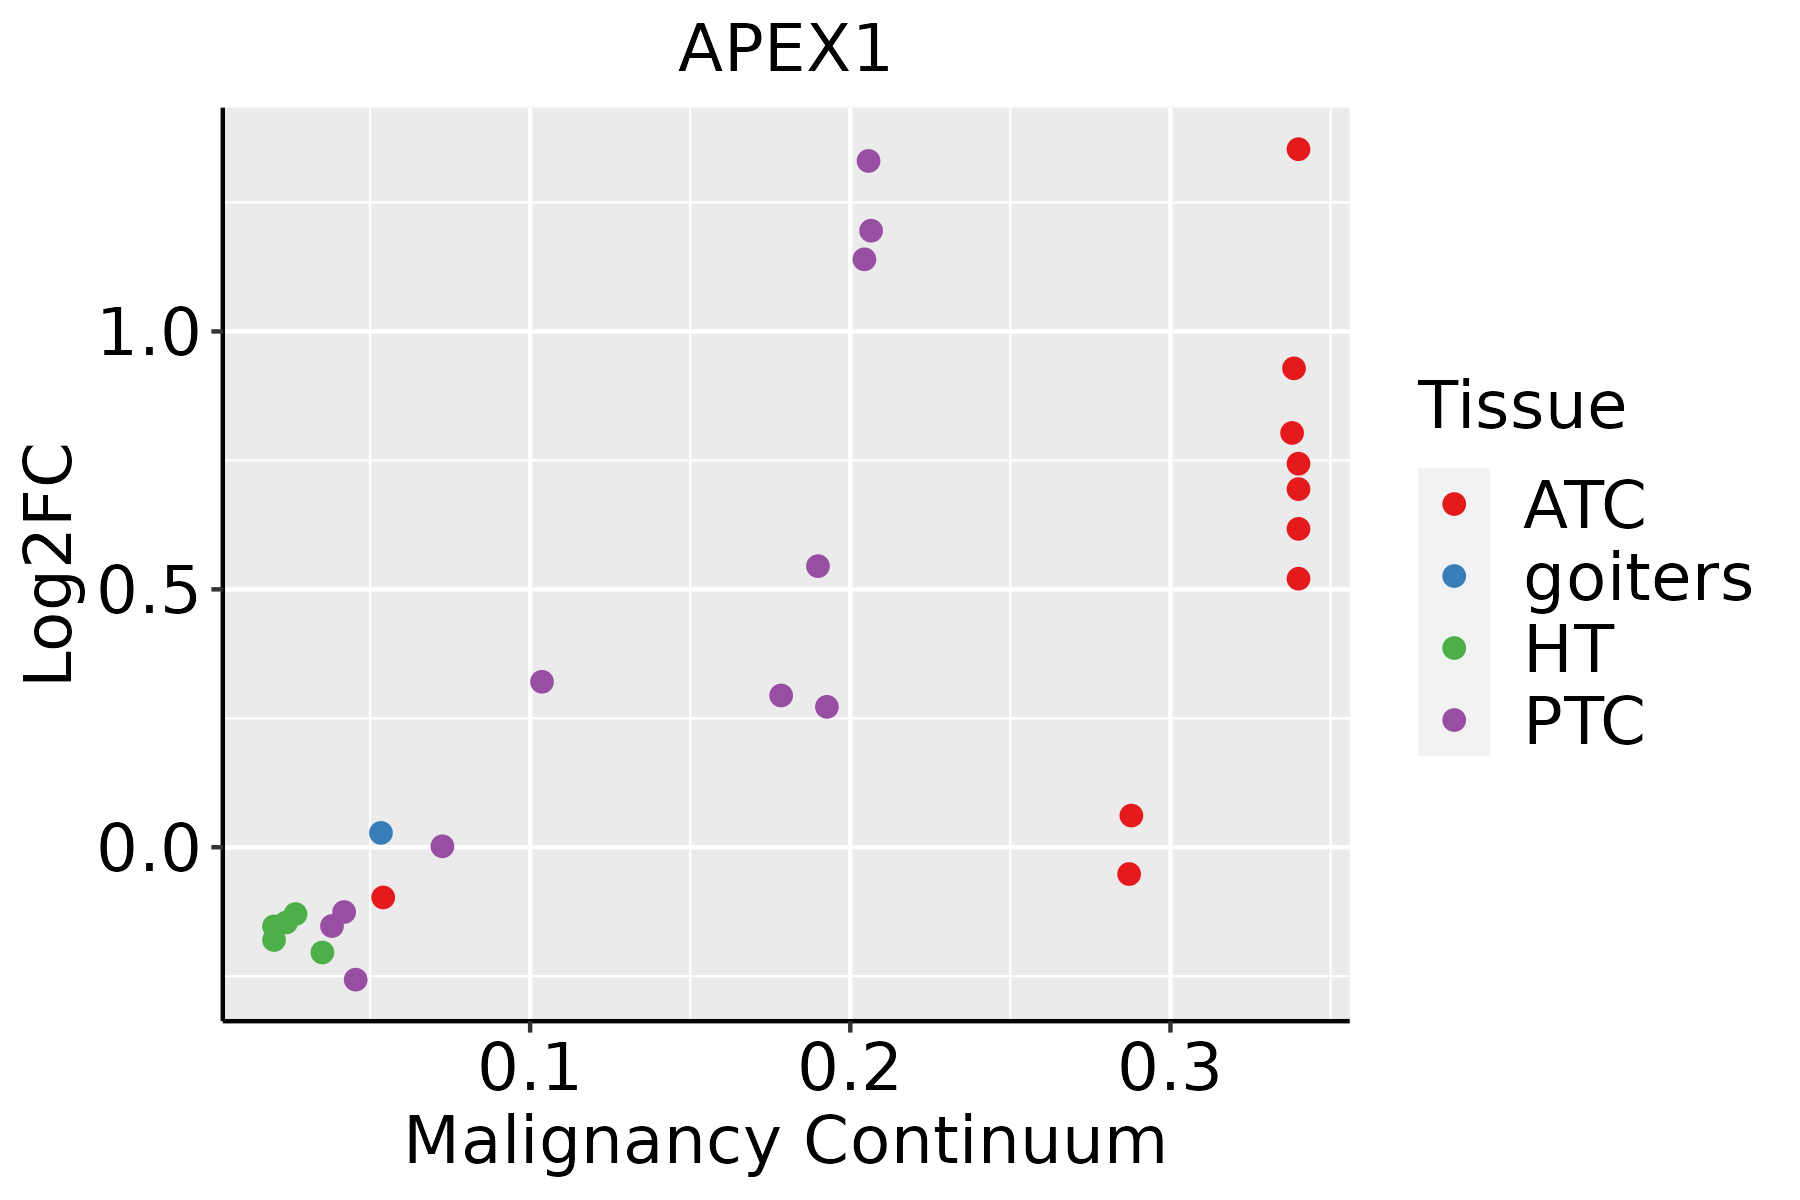 | ATC: Anaplastic thyroid cancer |
| HT: Hashimoto's thyroiditis | ||
| PTC: Papillary thyroid cancer |
| ∗log2FC in expression of this searched gene in stem-like cells from each diseased tissue sample relative to stem-like cells in normal samples in each tissue plotted against the malignancy continuum. Samples are colored based on if they are from different disease stage. |
Top |
Malignant transformation related pathway analysis |
| Find out the enriched GO biological processes and KEGG pathways involved in transition from healthy to precancer to cancer |
| Tissue | Disease Stage | Enriched GO biological Processes |
| Colorectum | AD |  |
| Colorectum | SER |  |
| Colorectum | MSS |  |
| Colorectum | MSI-H |  |
| Colorectum | FAP |  |
| ∗Top 15 enriched GO BP terms are showed in the bar plot of each disease state in each tissue. Each row represents a significant GO biological process which is colored according to the -log10(p.adjust). |
| Page: 1 2 3 4 5 6 7 8 9 |
| GO ID | Tissue | Disease Stage | Description | Gene Ratio | Bg Ratio | pvalue | p.adjust | Count |
| GO:00459317 | Endometrium | AEH | positive regulation of mitotic cell cycle | 23/2100 | 121/18723 | 7.76e-03 | 4.33e-02 | 23 |
| GO:190331115 | Endometrium | EEC | regulation of mRNA metabolic process | 79/2168 | 288/18723 | 1.01e-13 | 2.64e-11 | 79 |
| GO:000697917 | Endometrium | EEC | response to oxidative stress | 99/2168 | 446/18723 | 9.02e-11 | 1.13e-08 | 99 |
| GO:000640215 | Endometrium | EEC | mRNA catabolic process | 60/2168 | 232/18723 | 1.17e-09 | 9.92e-08 | 60 |
| GO:006219717 | Endometrium | EEC | cellular response to chemical stress | 77/2168 | 337/18723 | 2.87e-09 | 2.10e-07 | 77 |
| GO:000030217 | Endometrium | EEC | response to reactive oxygen species | 57/2168 | 222/18723 | 4.04e-09 | 2.82e-07 | 57 |
| GO:000640115 | Endometrium | EEC | RNA catabolic process | 65/2168 | 278/18723 | 1.90e-08 | 1.16e-06 | 65 |
| GO:004254216 | Endometrium | EEC | response to hydrogen peroxide | 41/2168 | 146/18723 | 4.12e-08 | 2.29e-06 | 41 |
| GO:003459917 | Endometrium | EEC | cellular response to oxidative stress | 63/2168 | 288/18723 | 4.05e-07 | 1.58e-05 | 63 |
| GO:200014613 | Endometrium | EEC | negative regulation of cell motility | 71/2168 | 359/18723 | 3.98e-06 | 1.04e-04 | 71 |
| GO:006101313 | Endometrium | EEC | regulation of mRNA catabolic process | 40/2168 | 166/18723 | 4.47e-06 | 1.14e-04 | 40 |
| GO:005127113 | Endometrium | EEC | negative regulation of cellular component movement | 72/2168 | 367/18723 | 4.59e-06 | 1.15e-04 | 72 |
| GO:004348813 | Endometrium | EEC | regulation of mRNA stability | 38/2168 | 158/18723 | 8.03e-06 | 1.81e-04 | 38 |
| GO:004427013 | Endometrium | EEC | cellular nitrogen compound catabolic process | 83/2168 | 451/18723 | 1.17e-05 | 2.43e-04 | 83 |
| GO:003033612 | Endometrium | EEC | negative regulation of cell migration | 67/2168 | 344/18723 | 1.24e-05 | 2.54e-04 | 67 |
| GO:003461416 | Endometrium | EEC | cellular response to reactive oxygen species | 37/2168 | 155/18723 | 1.26e-05 | 2.55e-04 | 37 |
| GO:004670013 | Endometrium | EEC | heterocycle catabolic process | 82/2168 | 445/18723 | 1.26e-05 | 2.55e-04 | 82 |
| GO:004001312 | Endometrium | EEC | negative regulation of locomotion | 74/2168 | 391/18723 | 1.28e-05 | 2.59e-04 | 74 |
| GO:000756815 | Endometrium | EEC | aging | 66/2168 | 339/18723 | 1.46e-05 | 2.87e-04 | 66 |
| GO:003465514 | Endometrium | EEC | nucleobase-containing compound catabolic process | 76/2168 | 407/18723 | 1.61e-05 | 3.12e-04 | 76 |
| Page: 1 2 3 4 5 6 7 8 9 10 11 12 13 14 15 16 17 18 19 20 21 22 23 24 25 26 27 28 29 30 31 32 33 34 35 36 37 38 39 40 41 |
| Pathway ID | Tissue | Disease Stage | Description | Gene Ratio | Bg Ratio | pvalue | p.adjust | qvalue | Count |
| hsa034104 | Esophagus | ESCC | Base excision repair | 38/4205 | 44/8465 | 3.59e-07 | 2.62e-06 | 1.34e-06 | 38 |
| hsa0341011 | Esophagus | ESCC | Base excision repair | 38/4205 | 44/8465 | 3.59e-07 | 2.62e-06 | 1.34e-06 | 38 |
| Page: 1 |
Top |
Cell-cell communication analysis |
| Identification of potential cell-cell interactions between two cell types and their ligand-receptor pairs for different disease states |
| Ligand | Receptor | LRpair | Pathway | Tissue | Disease Stage |
| Page: 1 |
Top |
Single-cell gene regulatory network inference analysis |
| Find out the significant the regulons (TFs) and the target genes of each regulon across cell types for different disease states |
| TF | Cell Type | Tissue | Disease Stage | Target Gene | RSS | Regulon Activity |
| APEX1 | pDC | Lung | MIAC | GPR82,ZBTB46,SLC25A19, etc. | 4.54e-03 |  |
| APEX1 | cDC | Lung | MIAC | GPR82,ZBTB46,SLC25A19, etc. | 3.63e-03 | |
| ∗The dot plots of a searched regulon are shown for all cell subpopulations in each disease state of each tissue based on the regulon specific score inferred using pySCENIC and by calculating the average expression. |
| Page: 1 |
Top |
Somatic mutation of malignant transformation related genes |
| Annotation of somatic variants for genes involved in malignant transformation |
| Hugo Symbol | Variant Class | Variant Classification | dbSNP RS | HGVSc | HGVSp | HGVSp Short | SWISSPROT | BIOTYPE | SIFT | PolyPhen | Tumor Sample Barcode | Tissue | Histology | Sex | Age | Stage | Therapy Types | Drugs | Outcome |
| APEX1 | SNV | Missense_Mutation | c.14N>C | p.Gly5Ala | p.G5A | P27695 | protein_coding | tolerated(0.29) | benign(0.007) | TCGA-A8-A0A2-01 | Breast | breast invasive carcinoma | Female | >=65 | I/II | Hormone Therapy | tamoxiphen | SD | |
| APEX1 | SNV | Missense_Mutation | c.865N>T | p.His289Tyr | p.H289Y | P27695 | protein_coding | deleterious(0) | benign(0.125) | TCGA-AC-A23H-01 | Breast | breast invasive carcinoma | Female | >=65 | I/II | Unknown | Unknown | PD | |
| APEX1 | SNV | Missense_Mutation | rs765234188 | c.553N>T | p.Arg185Trp | p.R185W | P27695 | protein_coding | deleterious(0) | probably_damaging(1) | TCGA-AC-A8OS-01 | Breast | breast invasive carcinoma | Female | >=65 | I/II | Unknown | Unknown | SD |
| APEX1 | SNV | Missense_Mutation | rs751223947 | c.841N>T | p.Arg281Cys | p.R281C | P27695 | protein_coding | deleterious(0) | probably_damaging(1) | TCGA-2W-A8YY-01 | Cervix | cervical & endocervical cancer | Female | <65 | I/II | Chemotherapy | cisplatin | CR |
| APEX1 | SNV | Missense_Mutation | novel | c.20N>G | p.Lys7Arg | p.K7R | P27695 | protein_coding | tolerated(0.26) | benign(0.337) | TCGA-ZJ-AAXJ-01 | Cervix | cervical & endocervical cancer | Female | <65 | I/II | Unknown | Unknown | SD |
| APEX1 | SNV | Missense_Mutation | c.689C>A | p.Ala230Asp | p.A230D | P27695 | protein_coding | deleterious(0) | probably_damaging(0.992) | TCGA-AA-3492-01 | Colorectum | colon adenocarcinoma | Female | >=65 | I/II | Unknown | Unknown | SD | |
| APEX1 | SNV | Missense_Mutation | c.389G>A | p.Gly130Asp | p.G130D | P27695 | protein_coding | deleterious(0) | probably_damaging(0.999) | TCGA-AA-3715-01 | Colorectum | colon adenocarcinoma | Male | >=65 | I/II | Unknown | Unknown | PD | |
| APEX1 | SNV | Missense_Mutation | novel | c.813N>T | p.Met271Ile | p.M271I | P27695 | protein_coding | tolerated(0.4) | benign(0.376) | TCGA-AA-3984-01 | Colorectum | colon adenocarcinoma | Female | <65 | I/II | Unknown | Unknown | SD |
| APEX1 | SNV | Missense_Mutation | rs778698391 | c.662N>A | p.Arg221His | p.R221H | P27695 | protein_coding | tolerated(0.09) | possibly_damaging(0.653) | TCGA-AD-6964-01 | Colorectum | colon adenocarcinoma | Male | <65 | III/IV | Chemotherapy | folfox | PD |
| APEX1 | SNV | Missense_Mutation | c.688G>A | p.Ala230Thr | p.A230T | P27695 | protein_coding | deleterious(0) | probably_damaging(0.981) | TCGA-AZ-6601-01 | Colorectum | colon adenocarcinoma | Male | >=65 | I/II | Unknown | Unknown | PD |
| Page: 1 2 3 |
Top |
Related drugs of malignant transformation related genes |
| Identification of chemicals and drugs interact with genes involved in malignant transfromation |
| (DGIdb 4.0) |
| Entrez ID | Symbol | Category | Interaction Types | Drug Claim Name | Drug Name | PMIDs |
| 328 | APEX1 | DNA REPAIR, TRANSCRIPTION FACTOR COMPLEX, DRUGGABLE GENOME | CARMINE | CARMINE | ||
| 328 | APEX1 | DNA REPAIR, TRANSCRIPTION FACTOR COMPLEX, DRUGGABLE GENOME | DOPAMINE HYDROCHLORIDE | DOPAMINE HYDROCHLORIDE | ||
| 328 | APEX1 | DNA REPAIR, TRANSCRIPTION FACTOR COMPLEX, DRUGGABLE GENOME | BENZOQUINONE | BENZOQUINONE | ||
| 328 | APEX1 | DNA REPAIR, TRANSCRIPTION FACTOR COMPLEX, DRUGGABLE GENOME | 3-METHOXYCATECHOL | 3-METHOXYCATECHOL | ||
| 328 | APEX1 | DNA REPAIR, TRANSCRIPTION FACTOR COMPLEX, DRUGGABLE GENOME | IRIGENOL | IRIGENOL | ||
| 328 | APEX1 | DNA REPAIR, TRANSCRIPTION FACTOR COMPLEX, DRUGGABLE GENOME | SURAMIN HEXASODIUM | SURAMIN HEXASODIUM | ||
| 328 | APEX1 | DNA REPAIR, TRANSCRIPTION FACTOR COMPLEX, DRUGGABLE GENOME | ARACHIDONOYL GLYCINE | ARACHIDONOYL GLYCINE | ||
| 328 | APEX1 | DNA REPAIR, TRANSCRIPTION FACTOR COMPLEX, DRUGGABLE GENOME | SENNOSIDE A | SENNOSIDE A | ||
| 328 | APEX1 | DNA REPAIR, TRANSCRIPTION FACTOR COMPLEX, DRUGGABLE GENOME | QUERCETIN | QUERCETIN | ||
| 328 | APEX1 | DNA REPAIR, TRANSCRIPTION FACTOR COMPLEX, DRUGGABLE GENOME | CEFAMANDOLE SODIUM | CEFAMANDOLE SODIUM |
| Page: 1 2 3 4 5 6 7 8 9 10 11 12 13 14 15 16 17 18 |

Copyright 2023-Present -The University of Texas Health Science Center at Houston |