| Tissue | Expression Dynamics | Abbreviation |
| Colorectum (GSE201348) |  | FAP: Familial adenomatous polyposis |
| CRC: Colorectal cancer |
| Colorectum (HTA11) |  | AD: Adenomas |
| SER: Sessile serrated lesions |
| MSI-H: Microsatellite-high colorectal cancer |
| MSS: Microsatellite stable colorectal cancer |
| Esophagus | 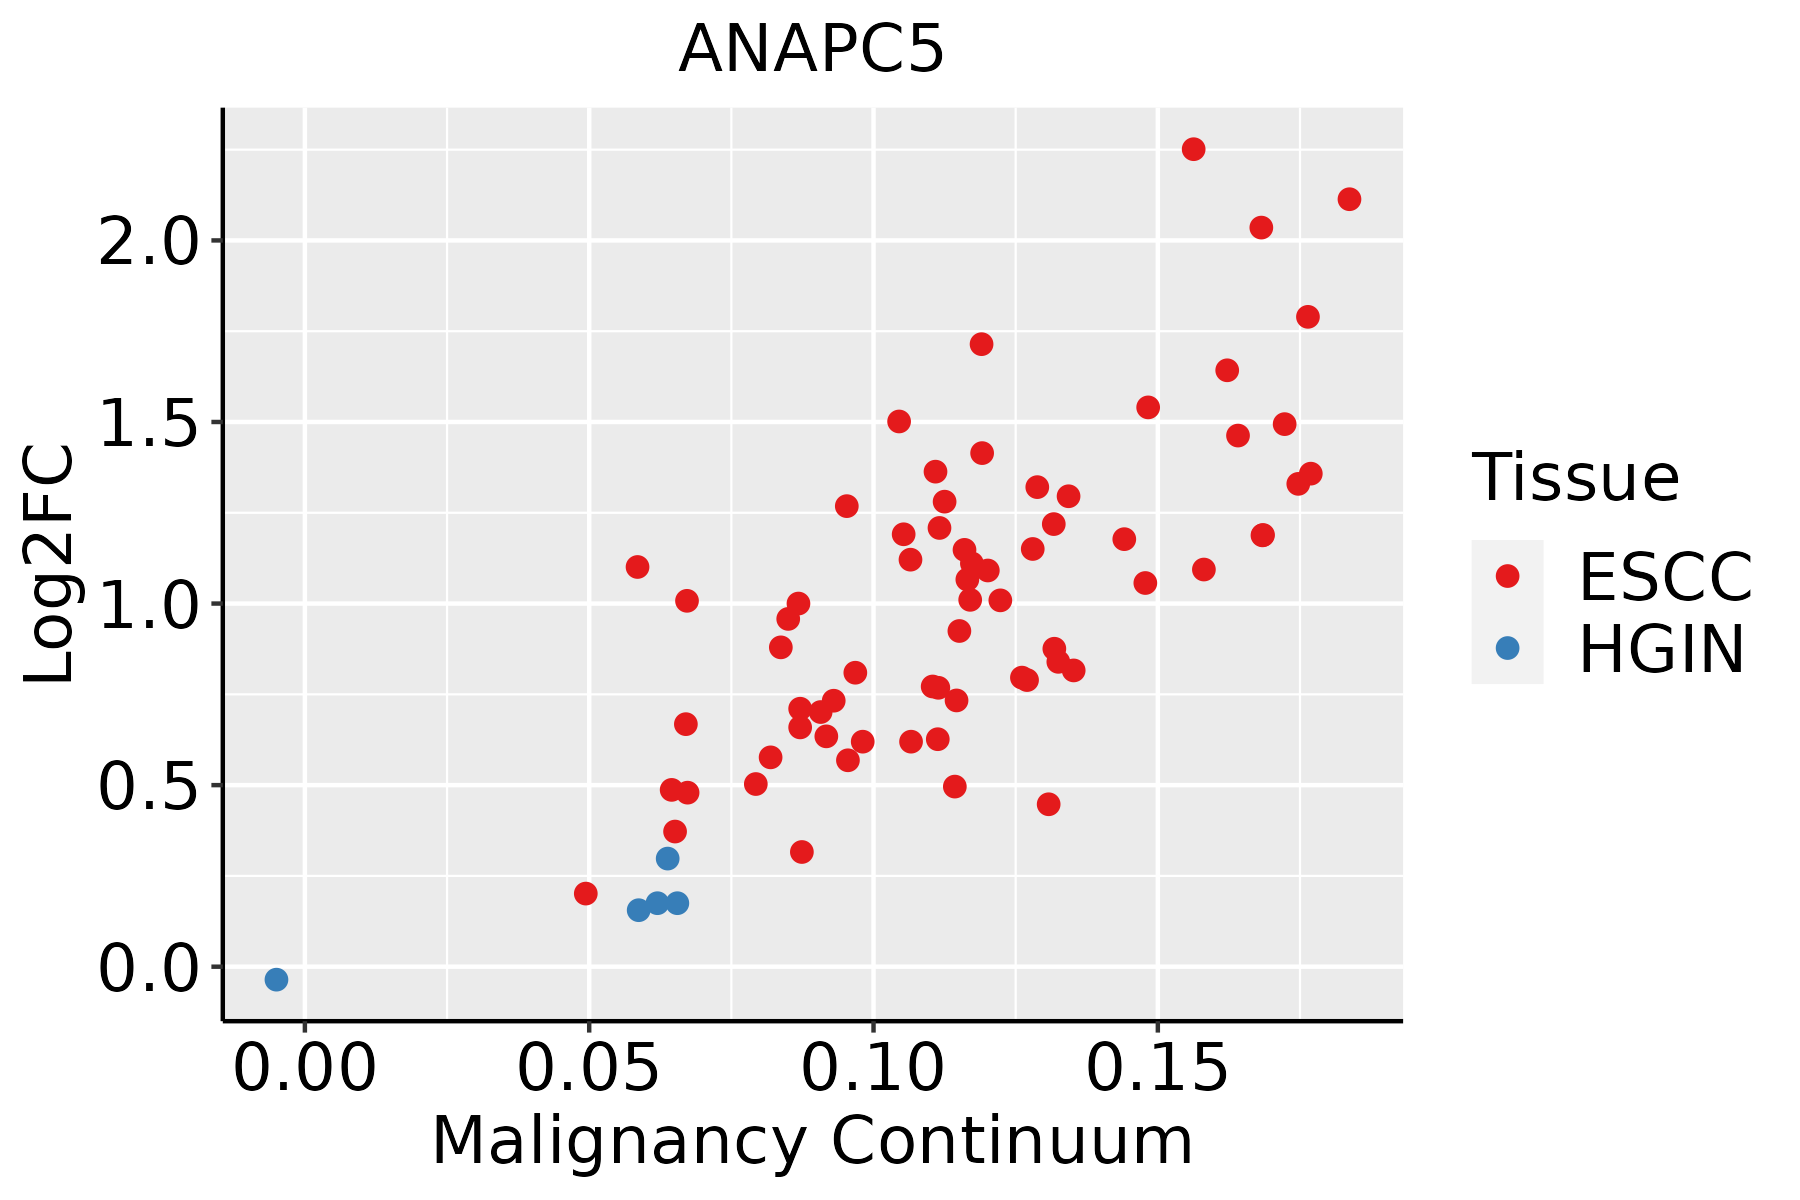 | ESCC: Esophageal squamous cell carcinoma |
| HGIN: High-grade intraepithelial neoplasias |
| LGIN: Low-grade intraepithelial neoplasias |
| Liver | 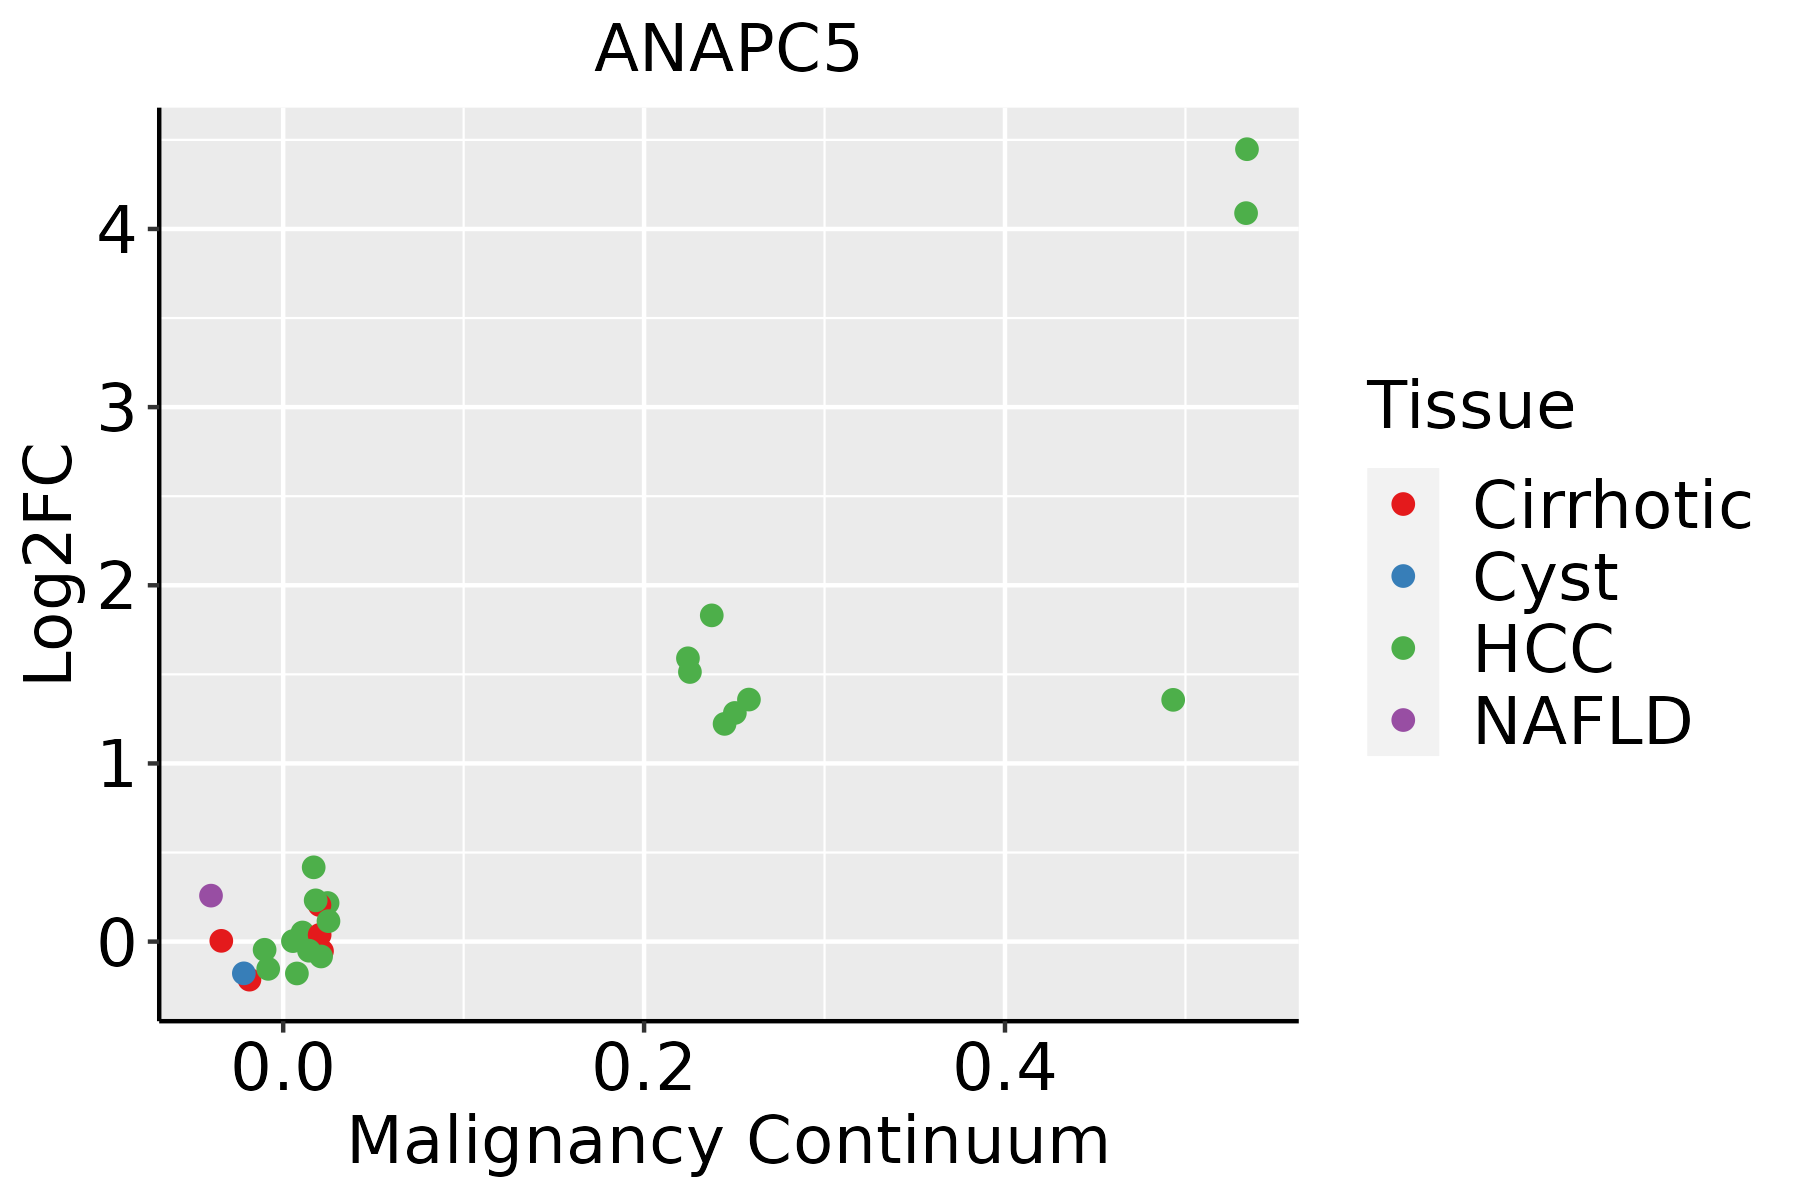 | HCC: Hepatocellular carcinoma |
| NAFLD: Non-alcoholic fatty liver disease |
| Oral Cavity | 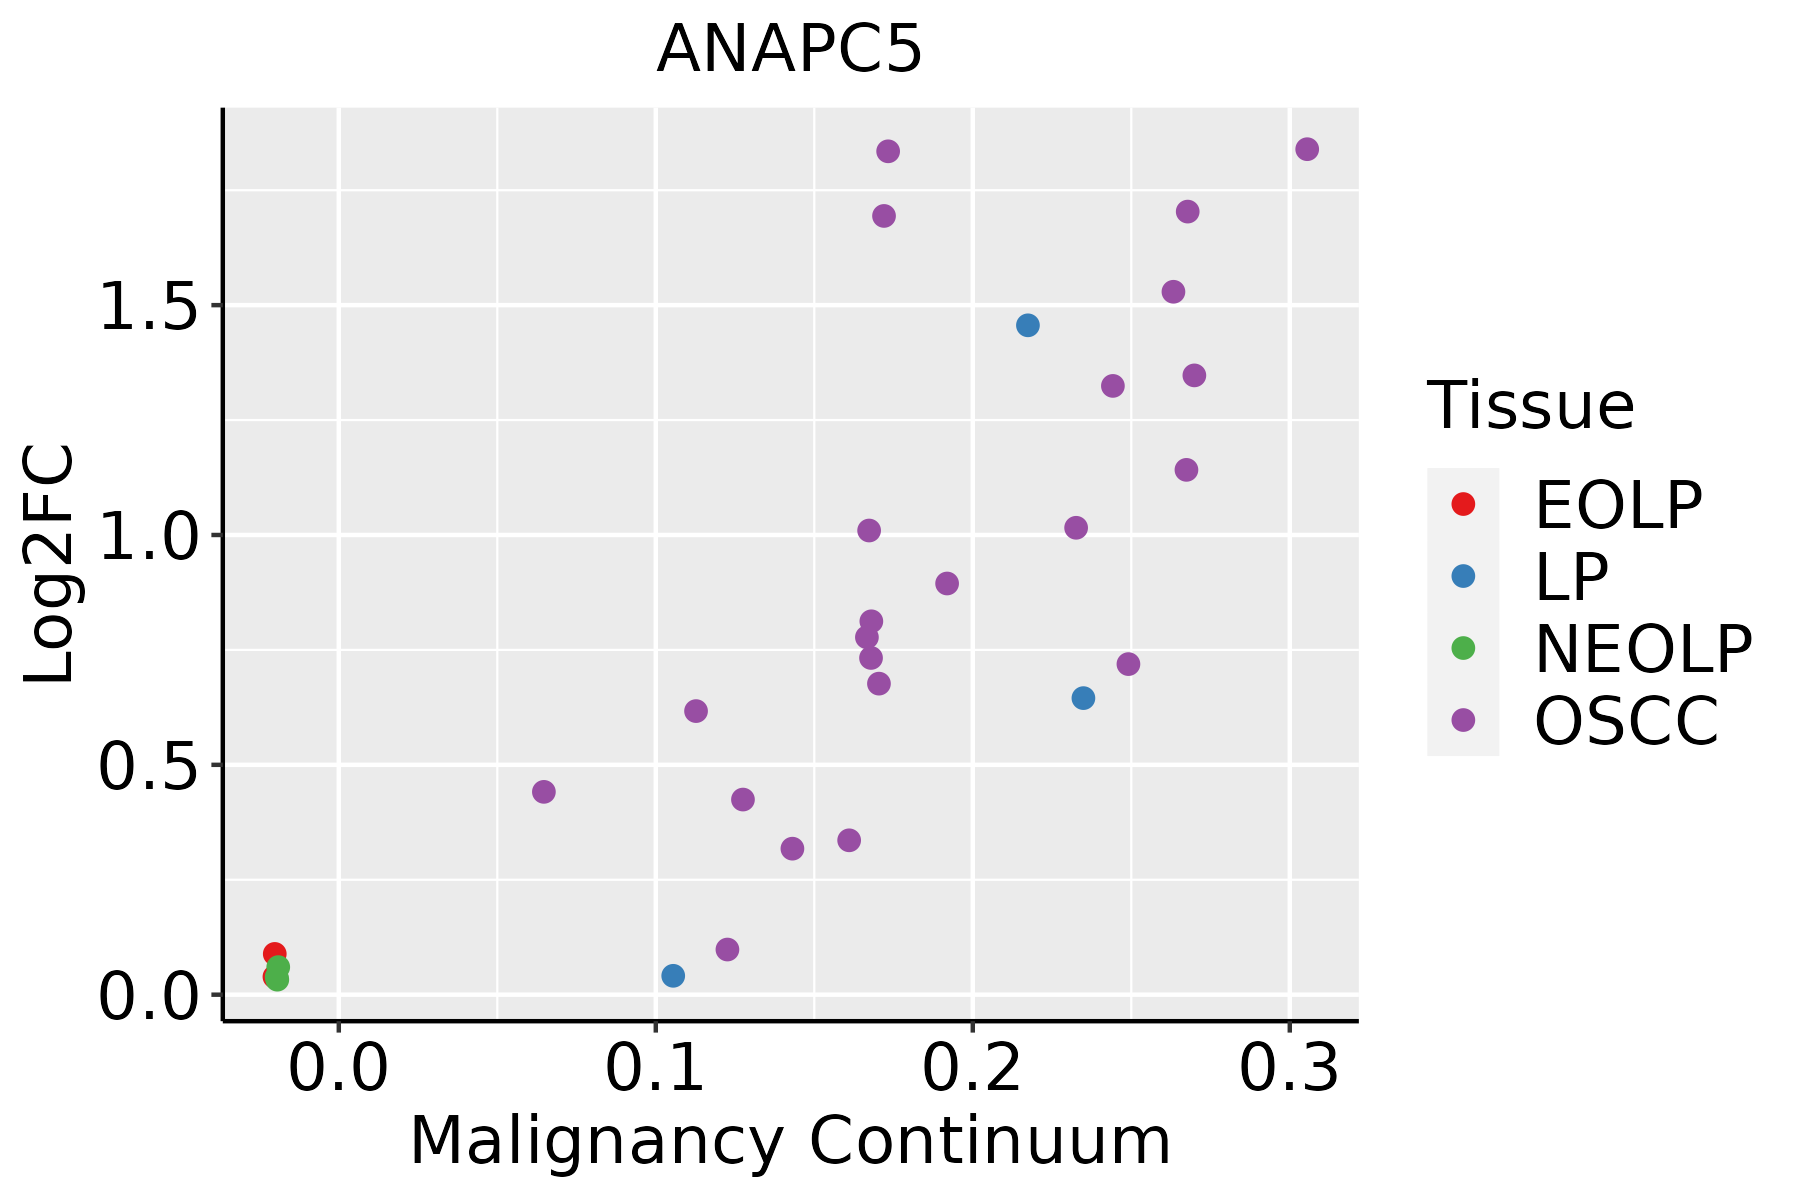 | EOLP: Erosive Oral lichen planus |
| LP: leukoplakia |
| NEOLP: Non-erosive oral lichen planus |
| OSCC: Oral squamous cell carcinoma |
| Prostate | 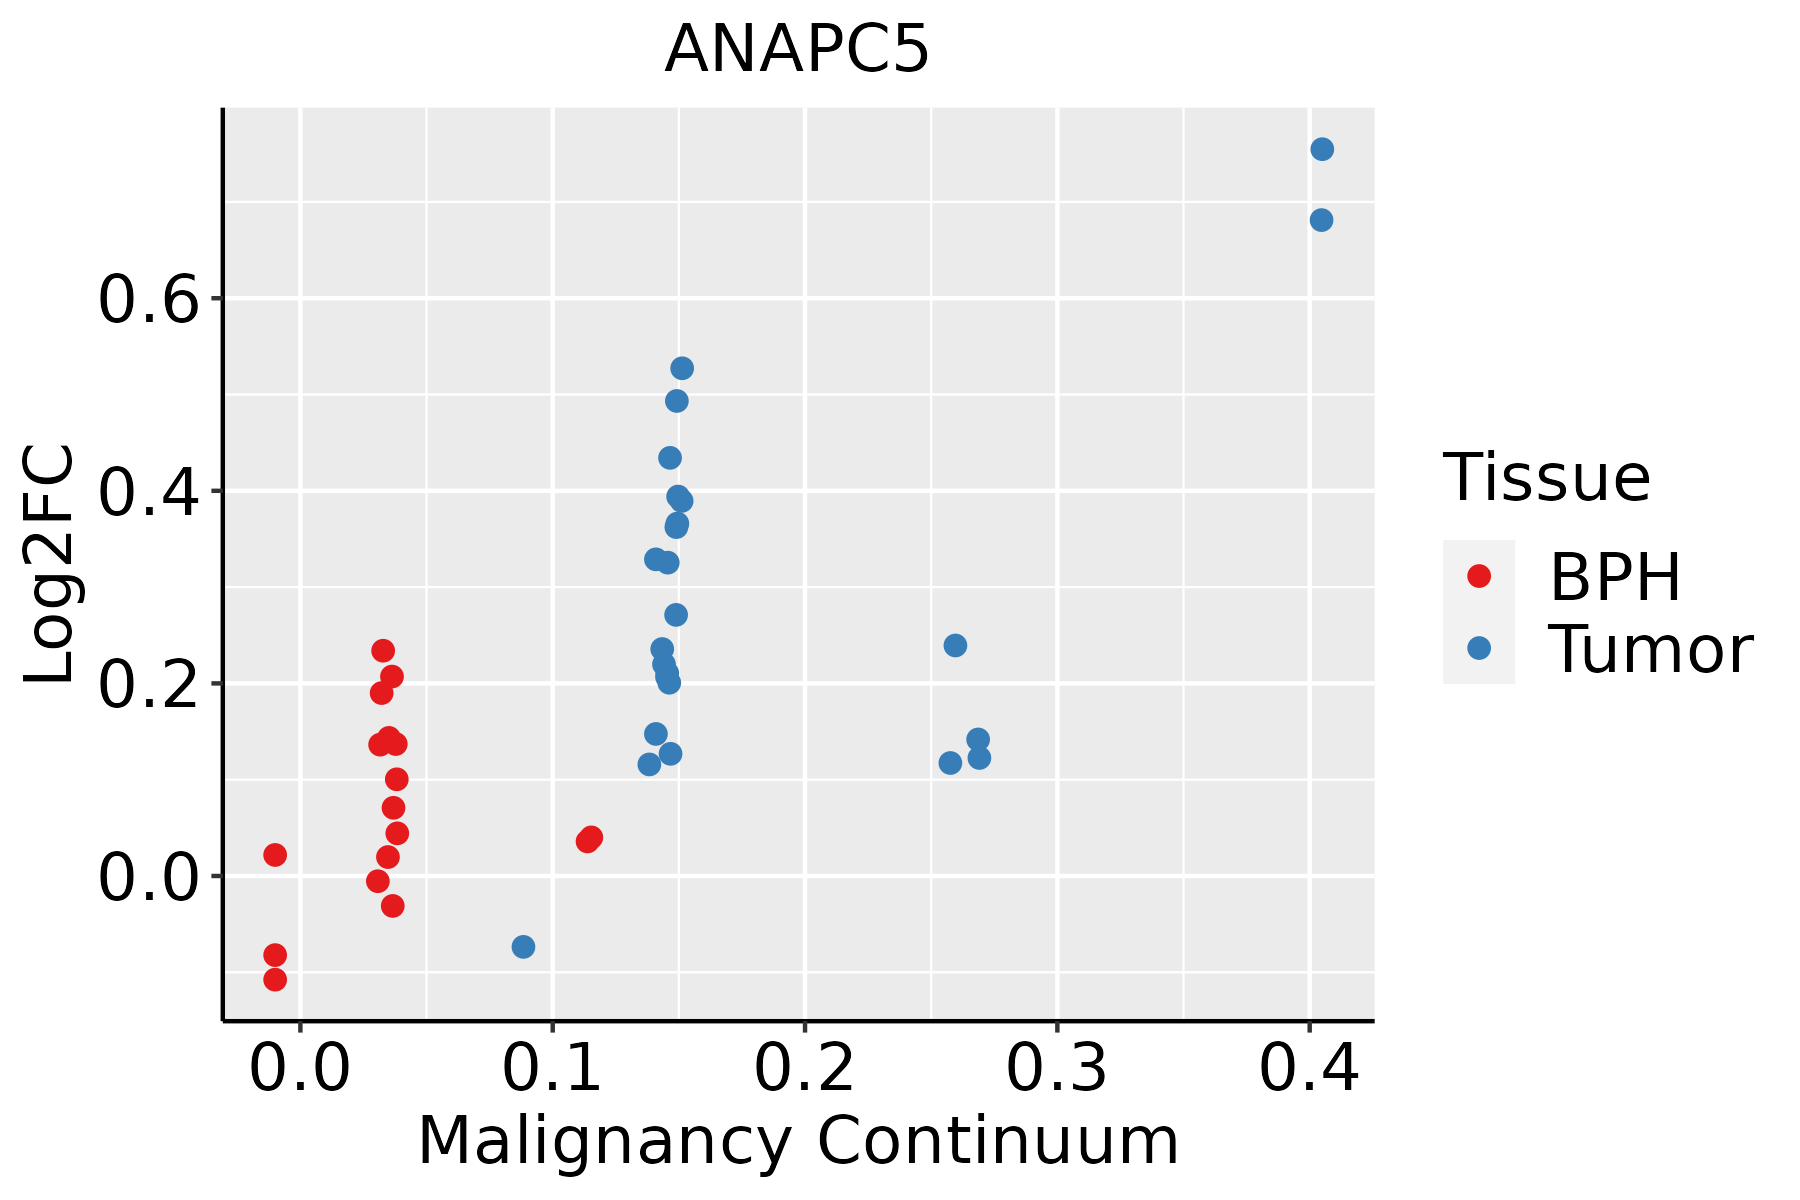 | BPH: Benign Prostatic Hyperplasia |
| Skin | 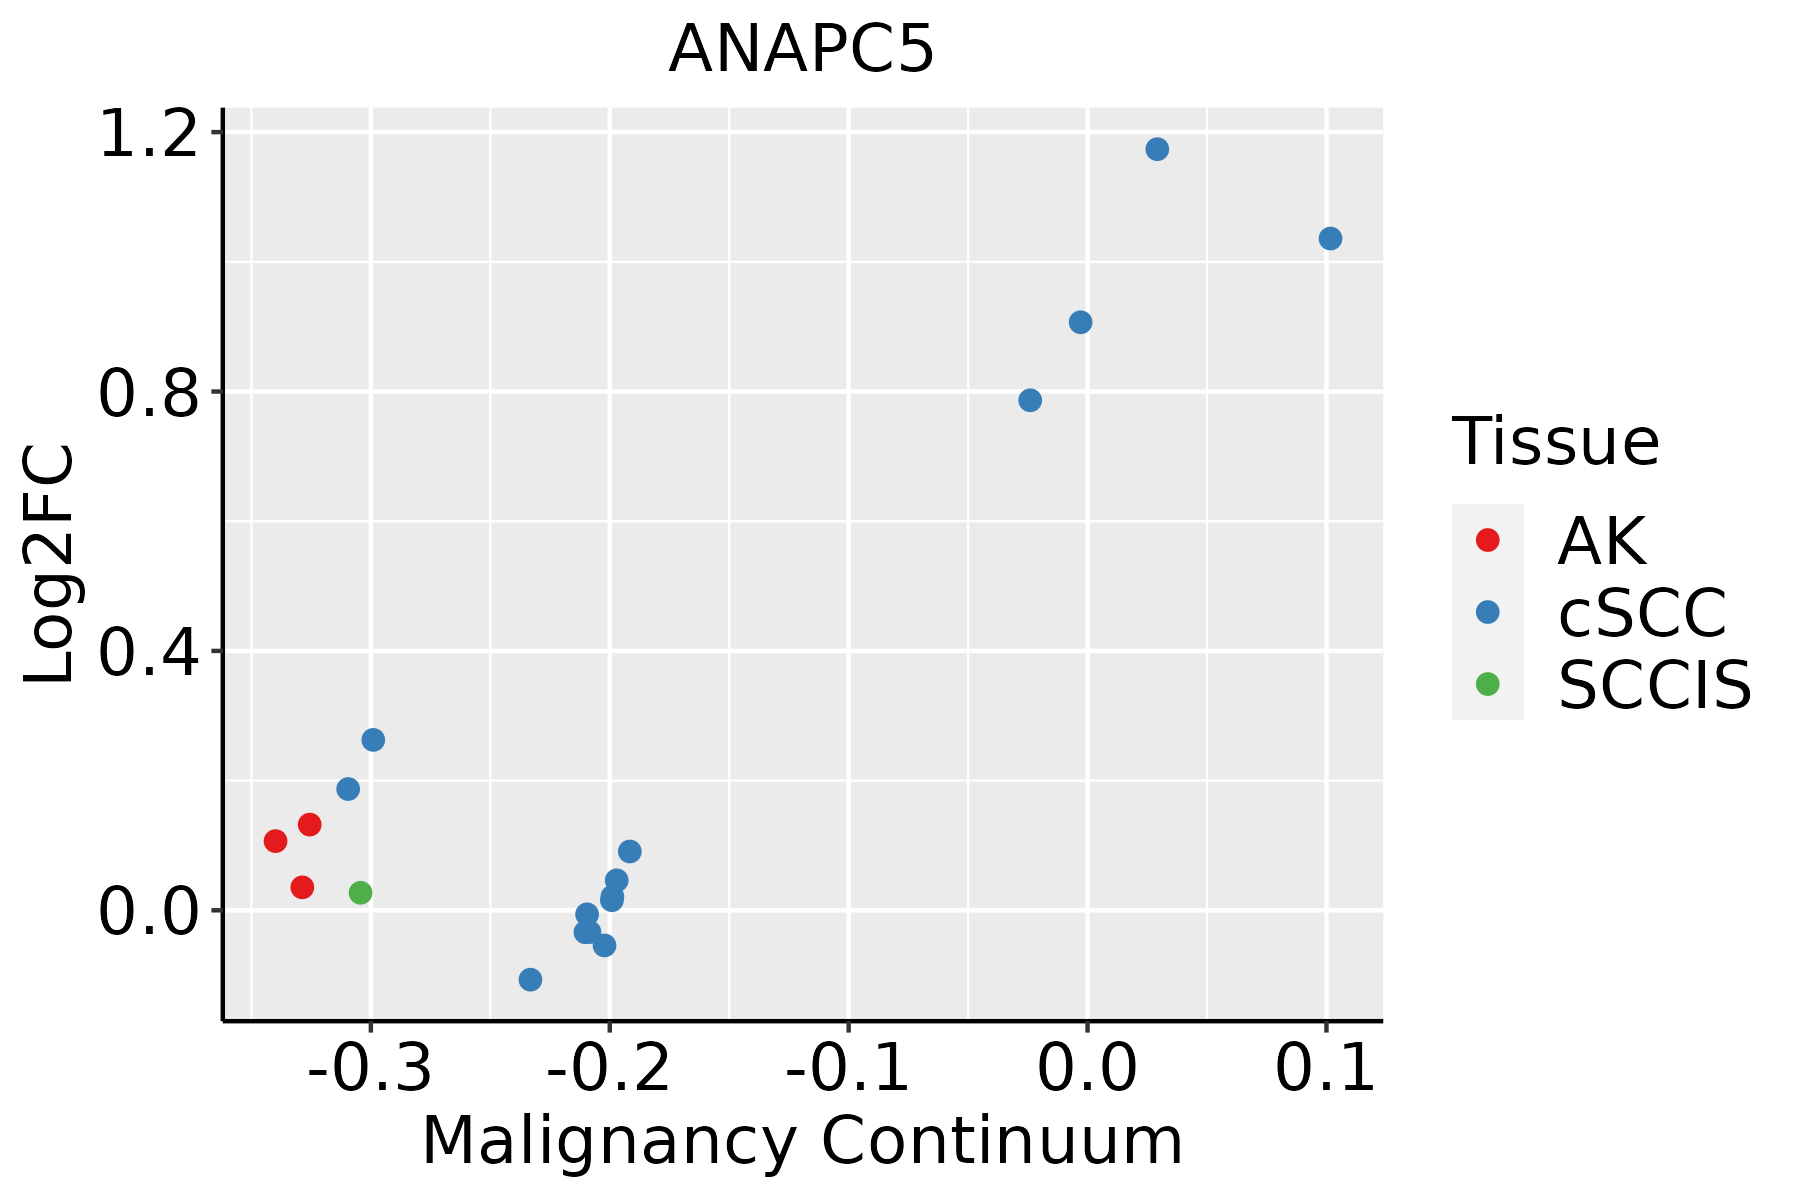 | AK: Actinic keratosis |
| cSCC: Cutaneous squamous cell carcinoma |
| SCCIS:squamous cell carcinoma in situ |
| Thyroid | 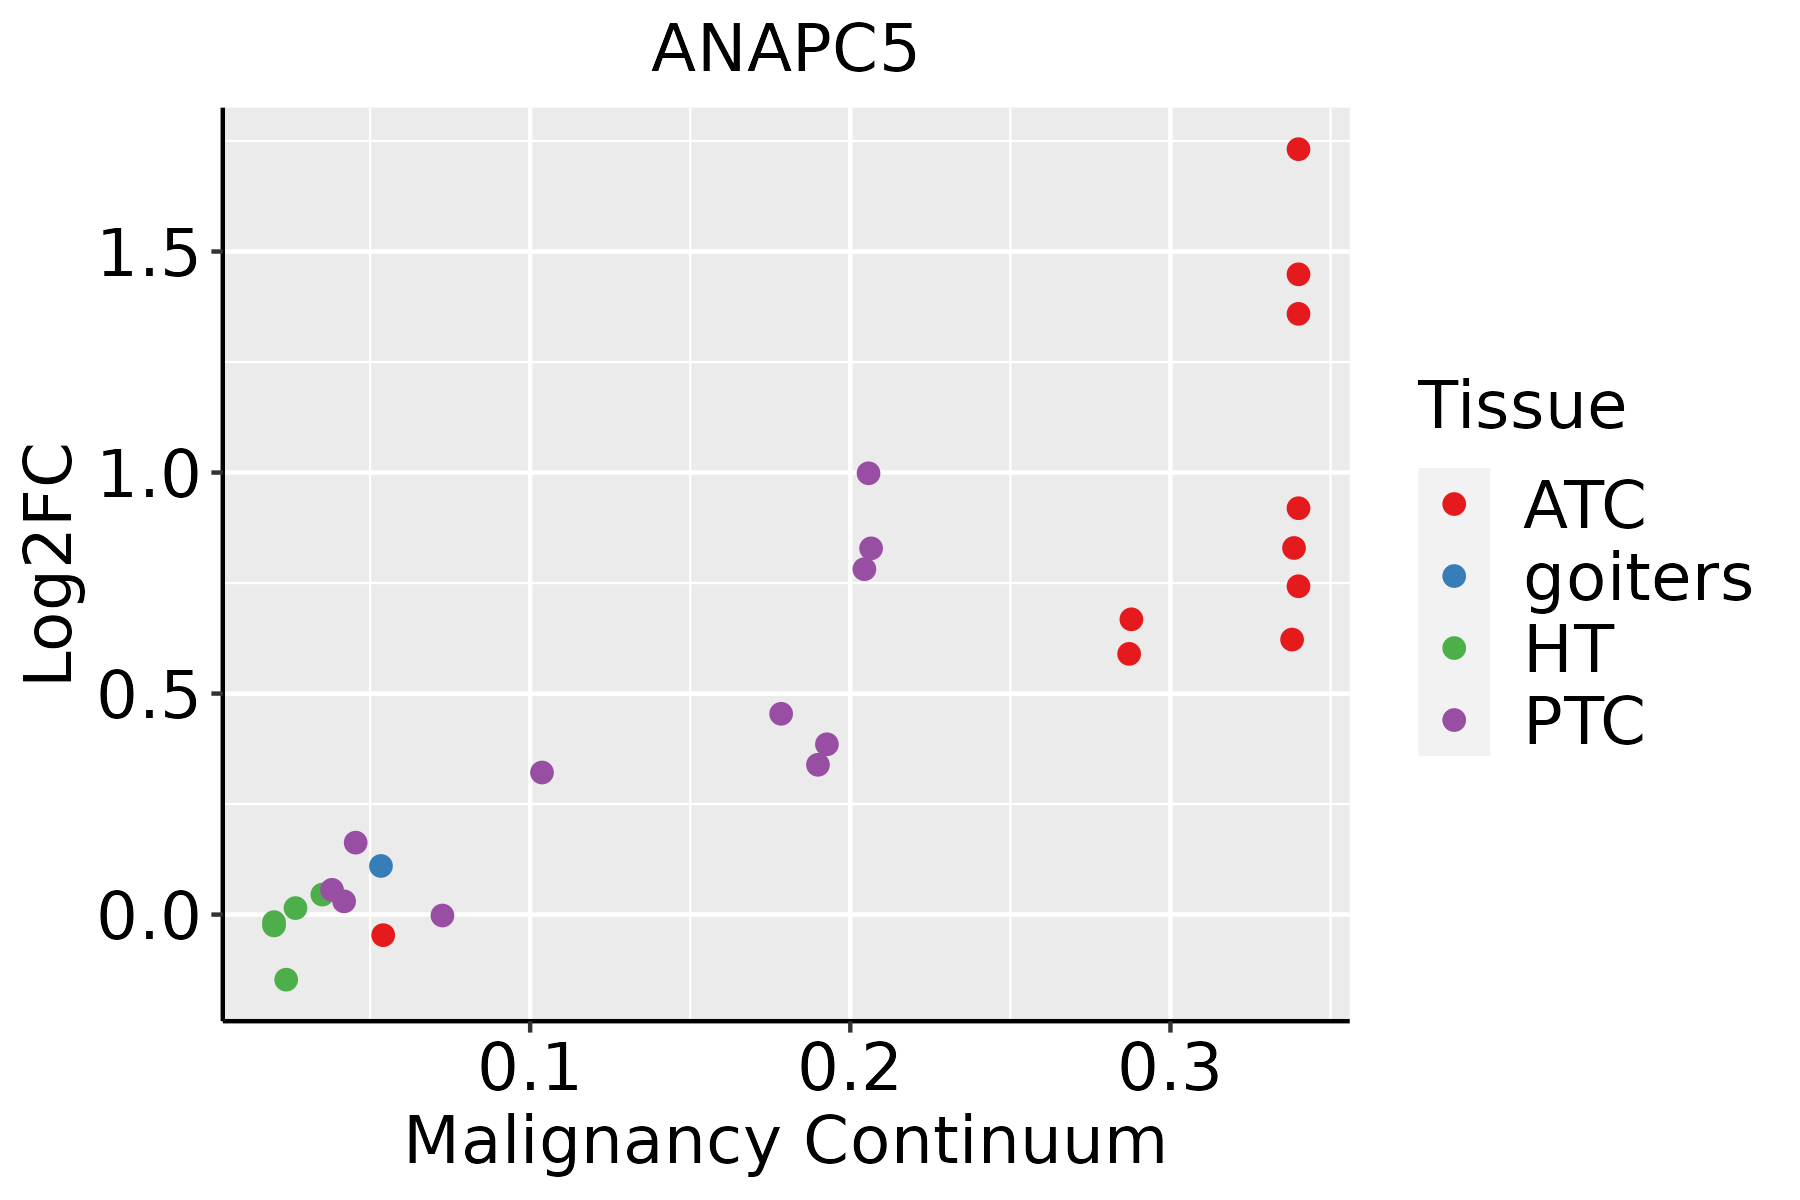 | ATC: Anaplastic thyroid cancer |
| HT: Hashimoto's thyroiditis |
| PTC: Papillary thyroid cancer |
| GO ID | Tissue | Disease Stage | Description | Gene Ratio | Bg Ratio | pvalue | p.adjust | Count |
| GO:00482854 | Skin | cSCC | organelle fission | 197/4864 | 488/18723 | 1.51e-12 | 8.36e-11 | 197 |
| GO:009881311 | Skin | cSCC | nuclear chromosome segregation | 126/4864 | 281/18723 | 4.76e-12 | 2.53e-10 | 126 |
| GO:00002803 | Skin | cSCC | nuclear division | 178/4864 | 439/18723 | 1.17e-11 | 5.93e-10 | 178 |
| GO:190199014 | Skin | cSCC | regulation of mitotic cell cycle phase transition | 128/4864 | 299/18723 | 1.48e-10 | 6.56e-09 | 128 |
| GO:00519834 | Skin | cSCC | regulation of chromosome segregation | 52/4864 | 91/18723 | 2.88e-10 | 1.20e-08 | 52 |
| GO:000020924 | Skin | cSCC | protein polyubiquitination | 103/4864 | 236/18723 | 2.57e-09 | 9.09e-08 | 103 |
| GO:00070913 | Skin | cSCC | metaphase/anaphase transition of mitotic cell cycle | 37/4864 | 62/18723 | 2.13e-08 | 6.11e-07 | 37 |
| GO:00330453 | Skin | cSCC | regulation of sister chromatid segregation | 41/4864 | 72/18723 | 2.48e-08 | 6.89e-07 | 41 |
| GO:19058183 | Skin | cSCC | regulation of chromosome separation | 41/4864 | 72/18723 | 2.48e-08 | 6.89e-07 | 41 |
| GO:00300713 | Skin | cSCC | regulation of mitotic metaphase/anaphase transition | 36/4864 | 60/18723 | 2.71e-08 | 7.41e-07 | 36 |
| GO:00109653 | Skin | cSCC | regulation of mitotic sister chromatid separation | 38/4864 | 65/18723 | 3.03e-08 | 8.18e-07 | 38 |
| GO:190198714 | Skin | cSCC | regulation of cell cycle phase transition | 150/4864 | 390/18723 | 3.21e-08 | 8.61e-07 | 150 |
| GO:00070884 | Skin | cSCC | regulation of mitotic nuclear division | 55/4864 | 110/18723 | 5.62e-08 | 1.44e-06 | 55 |
| GO:00513063 | Skin | cSCC | mitotic sister chromatid separation | 38/4864 | 67/18723 | 9.27e-08 | 2.22e-06 | 38 |
| GO:00447843 | Skin | cSCC | metaphase/anaphase transition of cell cycle | 37/4864 | 65/18723 | 1.20e-07 | 2.79e-06 | 37 |
| GO:19020993 | Skin | cSCC | regulation of metaphase/anaphase transition of cell cycle | 36/4864 | 63/18723 | 1.55e-07 | 3.51e-06 | 36 |
| GO:00517832 | Skin | cSCC | regulation of nuclear division | 64/4864 | 139/18723 | 2.49e-07 | 5.25e-06 | 64 |
| GO:004578717 | Skin | cSCC | positive regulation of cell cycle | 120/4864 | 313/18723 | 8.95e-07 | 1.64e-05 | 120 |
| GO:004593118 | Skin | cSCC | positive regulation of mitotic cell cycle | 56/4864 | 121/18723 | 1.11e-06 | 1.96e-05 | 56 |
| GO:009006815 | Skin | cSCC | positive regulation of cell cycle process | 92/4864 | 236/18723 | 7.33e-06 | 1.01e-04 | 92 |
| Pathway ID | Tissue | Disease Stage | Description | Gene Ratio | Bg Ratio | pvalue | p.adjust | qvalue | Count |
| hsa04120 | Colorectum | AD | Ubiquitin mediated proteolysis | 58/2092 | 142/8465 | 1.46e-05 | 1.53e-04 | 9.76e-05 | 58 |
| hsa05166 | Colorectum | AD | Human T-cell leukemia virus 1 infection | 72/2092 | 222/8465 | 5.24e-03 | 2.44e-02 | 1.55e-02 | 72 |
| hsa041201 | Colorectum | AD | Ubiquitin mediated proteolysis | 58/2092 | 142/8465 | 1.46e-05 | 1.53e-04 | 9.76e-05 | 58 |
| hsa051661 | Colorectum | AD | Human T-cell leukemia virus 1 infection | 72/2092 | 222/8465 | 5.24e-03 | 2.44e-02 | 1.55e-02 | 72 |
| hsa041206 | Colorectum | FAP | Ubiquitin mediated proteolysis | 51/1404 | 142/8465 | 1.55e-08 | 5.84e-07 | 3.55e-07 | 51 |
| hsa04110 | Colorectum | FAP | Cell cycle | 37/1404 | 157/8465 | 1.44e-02 | 4.77e-02 | 2.90e-02 | 37 |
| hsa041207 | Colorectum | FAP | Ubiquitin mediated proteolysis | 51/1404 | 142/8465 | 1.55e-08 | 5.84e-07 | 3.55e-07 | 51 |
| hsa041101 | Colorectum | FAP | Cell cycle | 37/1404 | 157/8465 | 1.44e-02 | 4.77e-02 | 2.90e-02 | 37 |
| hsa041208 | Colorectum | CRC | Ubiquitin mediated proteolysis | 42/1091 | 142/8465 | 9.98e-08 | 6.67e-06 | 4.52e-06 | 42 |
| hsa041209 | Colorectum | CRC | Ubiquitin mediated proteolysis | 42/1091 | 142/8465 | 9.98e-08 | 6.67e-06 | 4.52e-06 | 42 |
| hsa0412026 | Esophagus | HGIN | Ubiquitin mediated proteolysis | 49/1383 | 142/8465 | 7.78e-08 | 1.33e-06 | 1.06e-06 | 49 |
| hsa0516639 | Esophagus | HGIN | Human T-cell leukemia virus 1 infection | 51/1383 | 222/8465 | 5.84e-03 | 4.05e-02 | 3.22e-02 | 51 |
| hsa041109 | Esophagus | HGIN | Cell cycle | 38/1383 | 157/8465 | 6.70e-03 | 4.37e-02 | 3.47e-02 | 38 |
| hsa0465726 | Esophagus | HGIN | IL-17 signaling pathway | 25/1383 | 94/8465 | 7.52e-03 | 4.63e-02 | 3.68e-02 | 25 |
| hsa04120111 | Esophagus | HGIN | Ubiquitin mediated proteolysis | 49/1383 | 142/8465 | 7.78e-08 | 1.33e-06 | 1.06e-06 | 49 |
| hsa05166114 | Esophagus | HGIN | Human T-cell leukemia virus 1 infection | 51/1383 | 222/8465 | 5.84e-03 | 4.05e-02 | 3.22e-02 | 51 |
| hsa0411016 | Esophagus | HGIN | Cell cycle | 38/1383 | 157/8465 | 6.70e-03 | 4.37e-02 | 3.47e-02 | 38 |
| hsa04657113 | Esophagus | HGIN | IL-17 signaling pathway | 25/1383 | 94/8465 | 7.52e-03 | 4.63e-02 | 3.68e-02 | 25 |
| hsa0412027 | Esophagus | ESCC | Ubiquitin mediated proteolysis | 122/4205 | 142/8465 | 6.53e-20 | 7.29e-18 | 3.74e-18 | 122 |
| hsa0411023 | Esophagus | ESCC | Cell cycle | 126/4205 | 157/8465 | 1.34e-15 | 5.60e-14 | 2.87e-14 | 126 |
| Hugo Symbol | Variant Class | Variant Classification | dbSNP RS | HGVSc | HGVSp | HGVSp Short | SWISSPROT | BIOTYPE | SIFT | PolyPhen | Tumor Sample Barcode | Tissue | Histology | Sex | Age | Stage | Therapy Types | Drugs | Outcome |
| ANAPC5 | SNV | Missense_Mutation | novel | c.351T>G | p.Asp117Glu | p.D117E | Q9UJX4 | protein_coding | tolerated(0.26) | benign(0.01) | TCGA-A2-A0CL-01 | Breast | breast invasive carcinoma | Female | <65 | III/IV | Chemotherapy | cytoxan | SD |
| ANAPC5 | SNV | Missense_Mutation | rs778284423 | c.1984N>T | p.Arg662Cys | p.R662C | Q9UJX4 | protein_coding | tolerated(0.19) | benign(0.003) | TCGA-AR-A1AI-01 | Breast | breast invasive carcinoma | Female | <65 | I/II | Chemotherapy | cytoxan | PD |
| ANAPC5 | SNV | Missense_Mutation | | c.677N>T | p.Asp226Val | p.D226V | Q9UJX4 | protein_coding | deleterious(0) | probably_damaging(0.998) | TCGA-BH-A0DL-01 | Breast | breast invasive carcinoma | Female | <65 | I/II | Chemotherapy | cytoxan | CR |
| ANAPC5 | SNV | Missense_Mutation | | c.271A>G | p.Asn91Asp | p.N91D | Q9UJX4 | protein_coding | tolerated(0.57) | benign(0.026) | TCGA-D8-A1XQ-01 | Breast | breast invasive carcinoma | Female | >=65 | I/II | Unknown | Unknown | SD |
| ANAPC5 | SNV | Missense_Mutation | rs747383939 | c.2164N>G | p.His722Asp | p.H722D | Q9UJX4 | protein_coding | deleterious(0.04) | benign(0.015) | TCGA-UL-AAZ6-01 | Breast | breast invasive carcinoma | Female | >=65 | I/II | Chemotherapy | herceptin | SD |
| ANAPC5 | SNV | Missense_Mutation | rs552135290 | c.1534C>A | p.Gln512Lys | p.Q512K | Q9UJX4 | protein_coding | tolerated(0.32) | benign(0.024) | TCGA-DG-A2KJ-01 | Cervix | cervical & endocervical cancer | Female | <65 | III/IV | Chemotherapy | cisplatin | SD |
| ANAPC5 | SNV | Missense_Mutation | novel | c.1765N>C | p.Glu589Gln | p.E589Q | Q9UJX4 | protein_coding | tolerated(0.24) | benign(0.056) | TCGA-Q1-A73O-01 | Cervix | cervical & endocervical cancer | Female | <65 | I/II | Chemotherapy | cisplatin | CR |
| ANAPC5 | SNV | Missense_Mutation | | c.1553N>C | p.Arg518Thr | p.R518T | Q9UJX4 | protein_coding | deleterious(0.01) | benign(0.162) | TCGA-Q1-A73O-01 | Cervix | cervical & endocervical cancer | Female | <65 | I/II | Chemotherapy | cisplatin | CR |
| ANAPC5 | SNV | Missense_Mutation | novel | c.595N>C | p.Glu199Gln | p.E199Q | Q9UJX4 | protein_coding | tolerated(0.06) | benign(0.196) | TCGA-VS-A958-01 | Cervix | cervical & endocervical cancer | Female | <65 | I/II | Chemotherapy | cisplatin | CR |
| ANAPC5 | SNV | Missense_Mutation | | c.770G>A | p.Ser257Asn | p.S257N | Q9UJX4 | protein_coding | tolerated(0.12) | benign(0.103) | TCGA-AA-3672-01 | Colorectum | colon adenocarcinoma | Female | >=65 | III/IV | Unknown | Unknown | SD |


