| Tissue | Expression Dynamics | Abbreviation |
| Breast | 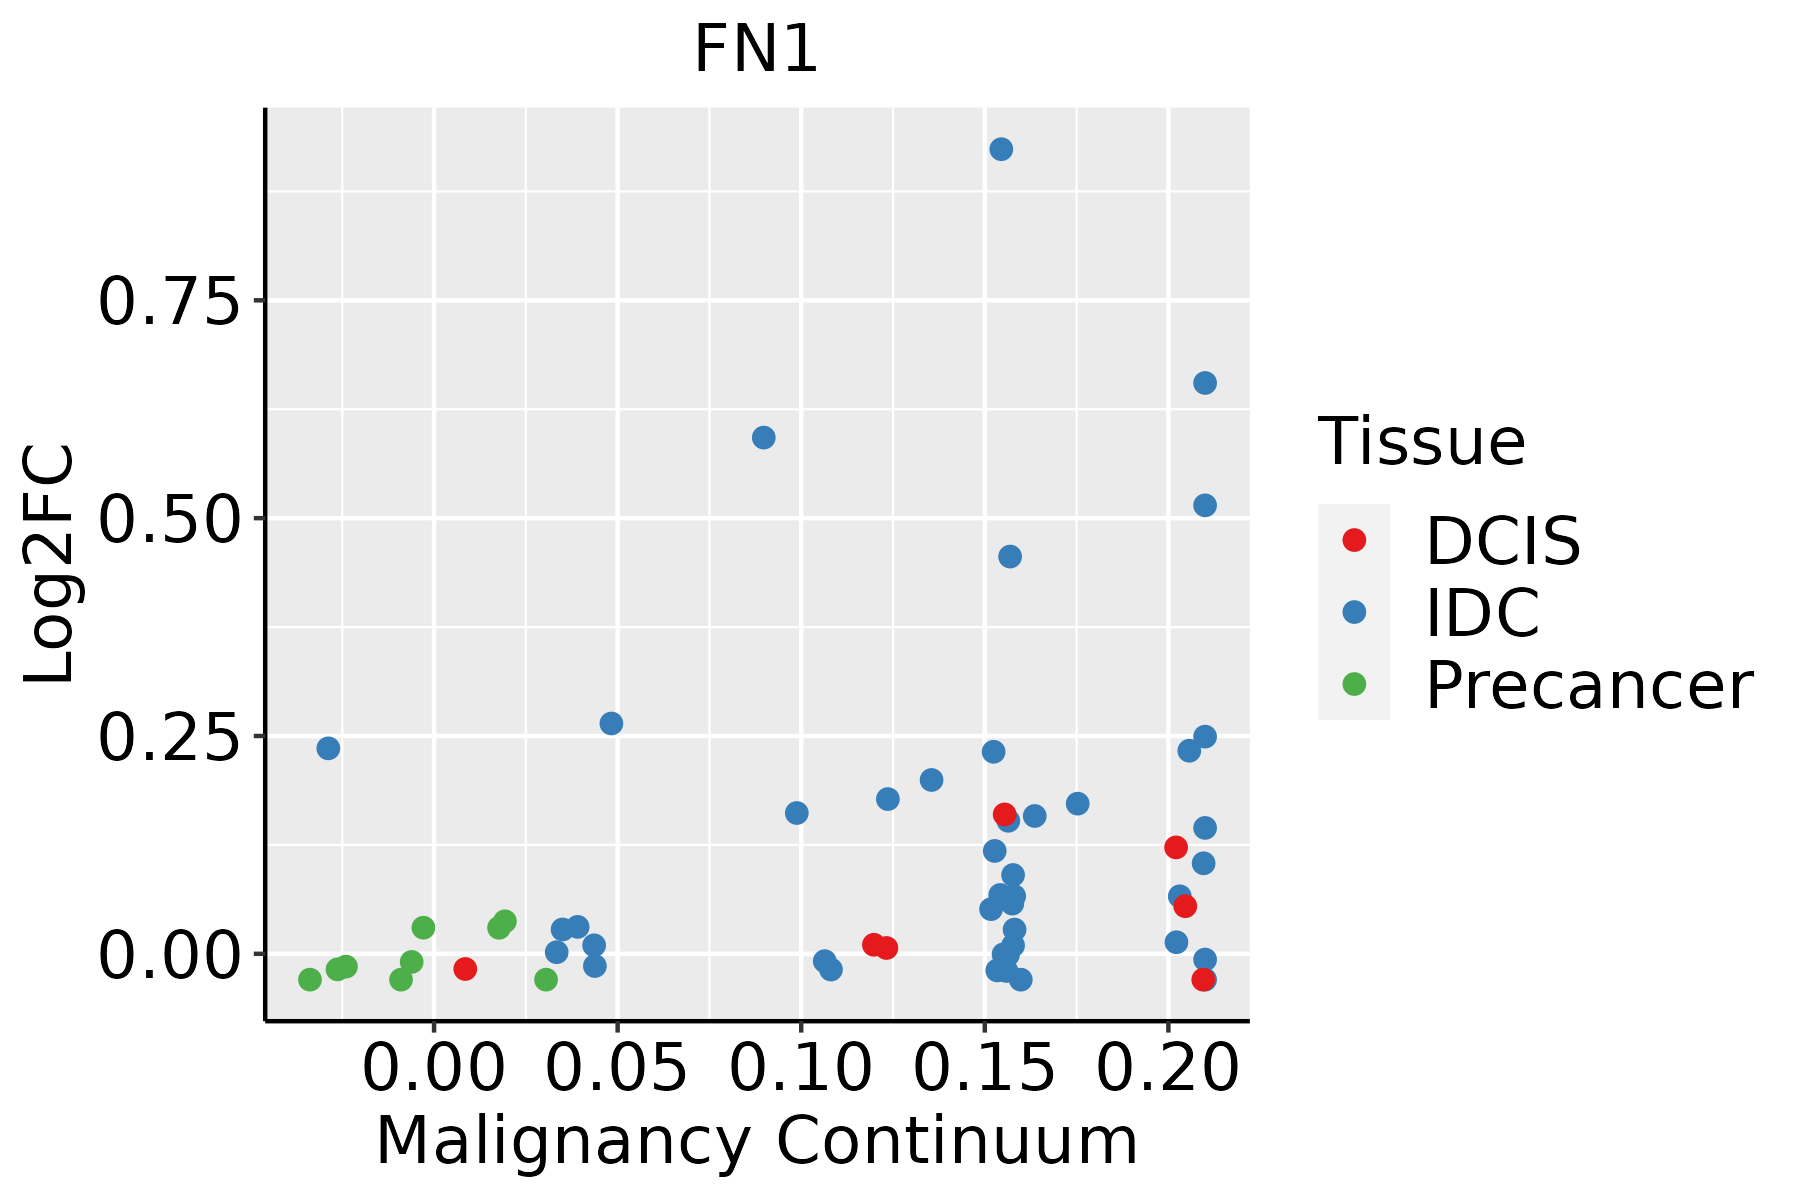 | IDC: Invasive ductal carcinoma |
| DCIS: Ductal carcinoma in situ |
| Precancer(BRCA1-mut): Precancerous lesion from BRCA1 mutation carriers |
| Colorectum (GSE201348) | 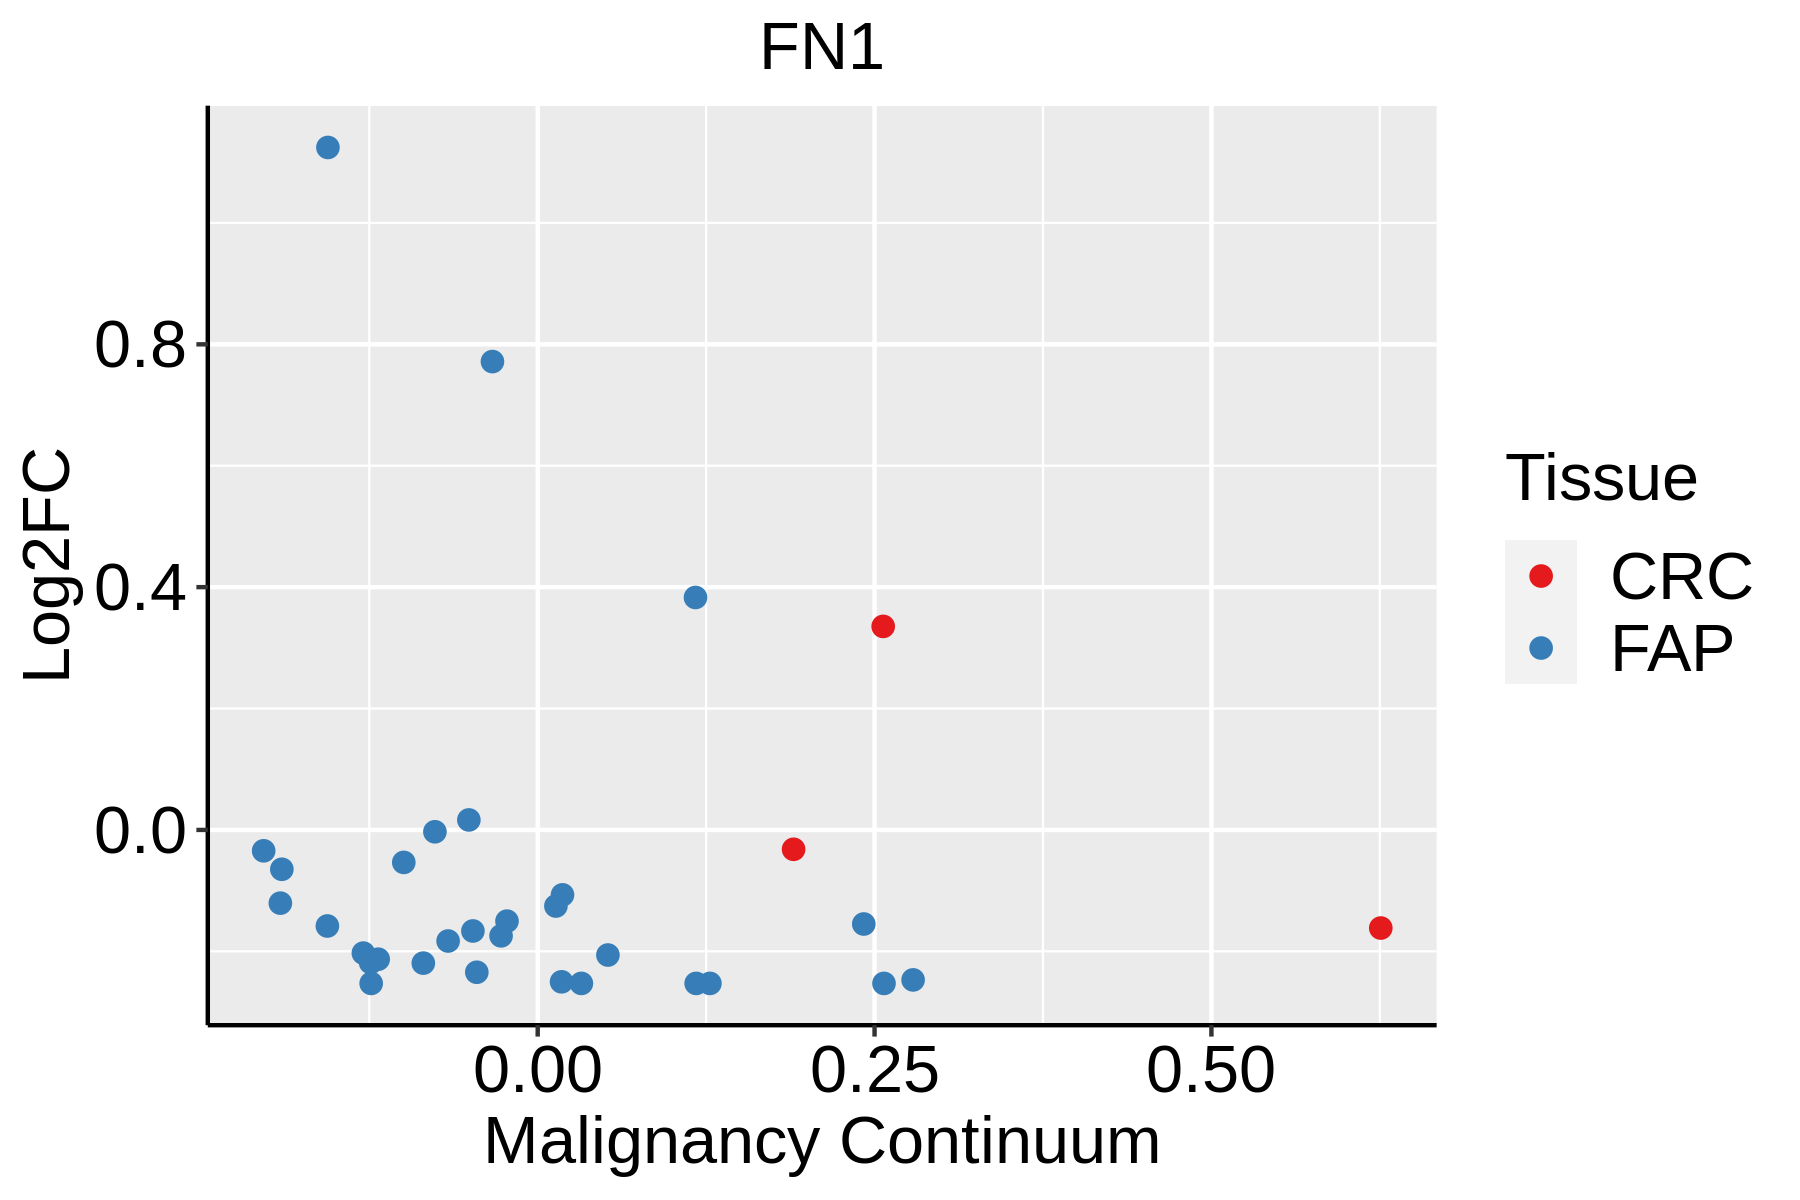 | FAP: Familial adenomatous polyposis |
| CRC: Colorectal cancer |
| Colorectum (HTA11) |  | AD: Adenomas |
| SER: Sessile serrated lesions |
| MSI-H: Microsatellite-high colorectal cancer |
| MSS: Microsatellite stable colorectal cancer |
| Esophagus | 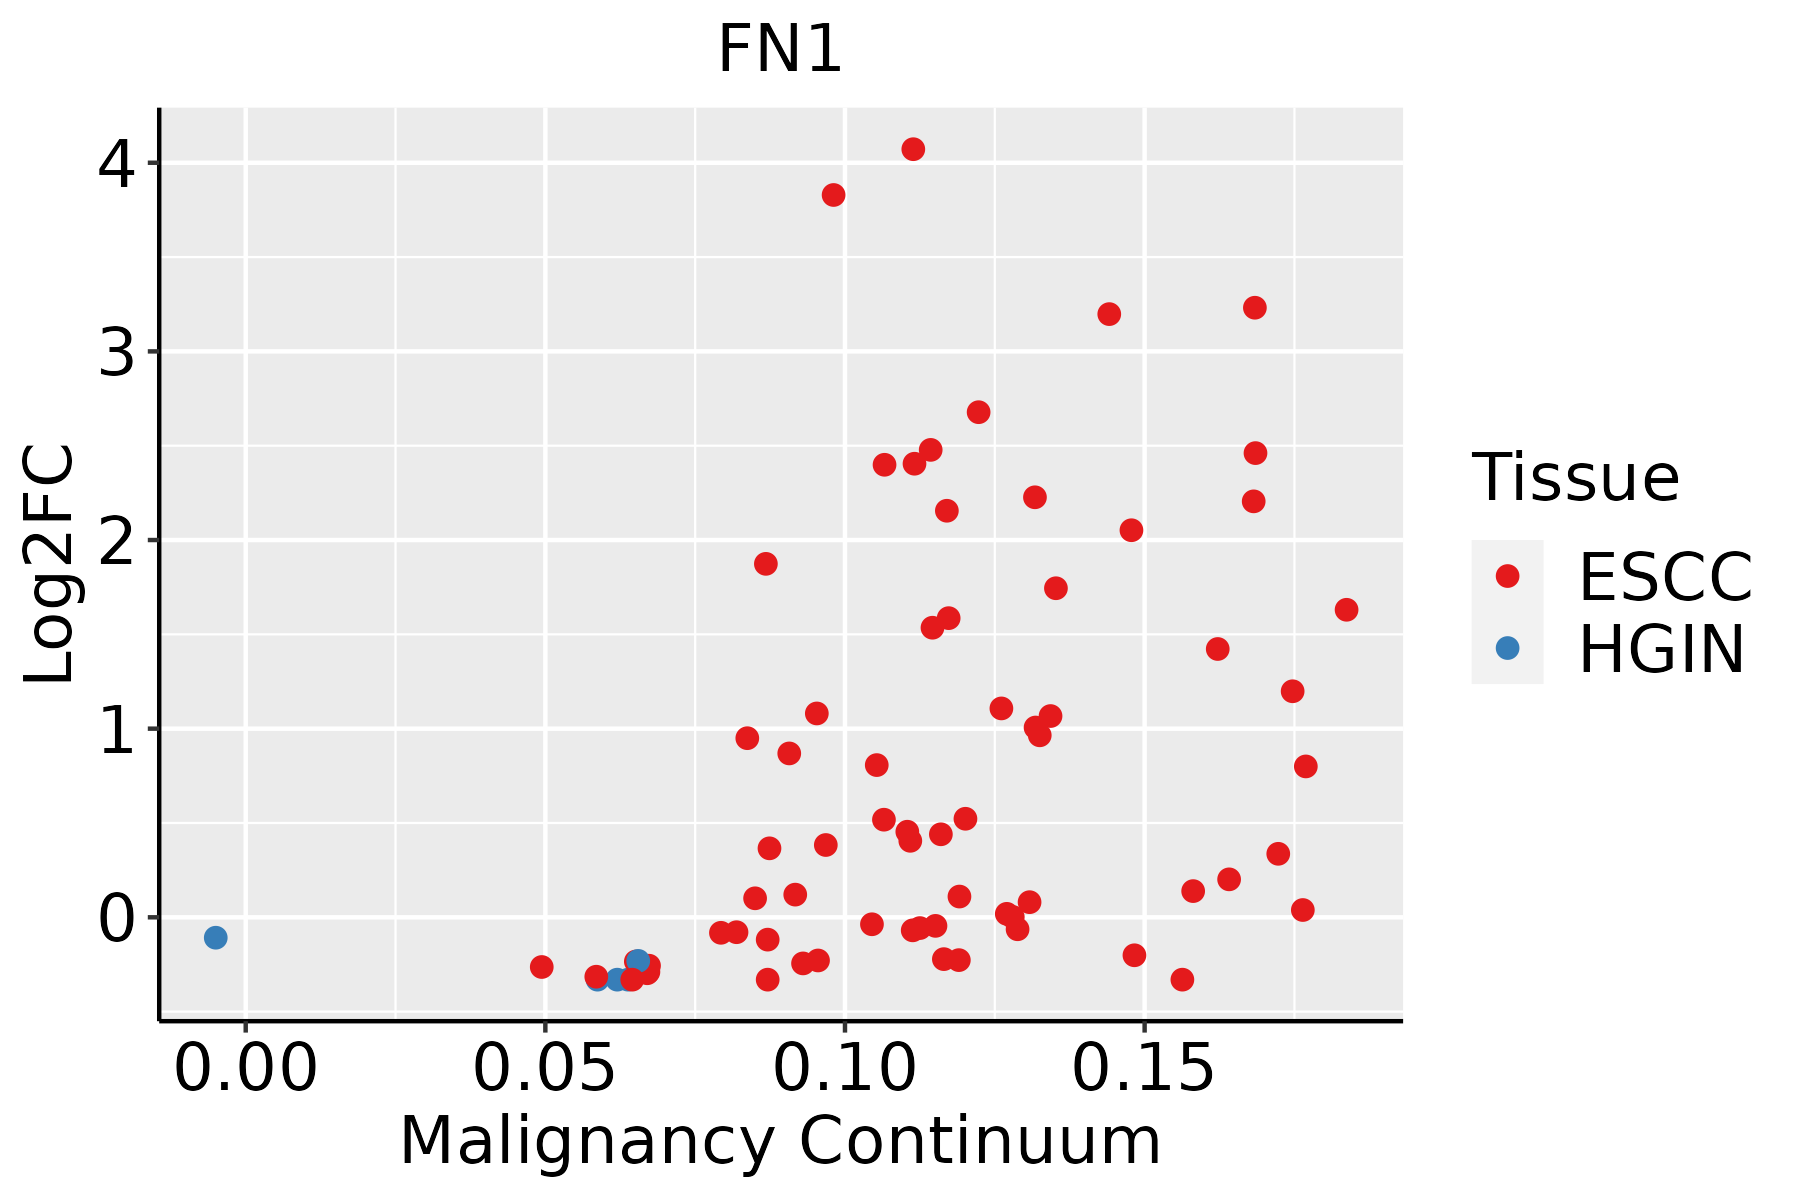 | ESCC: Esophageal squamous cell carcinoma |
| HGIN: High-grade intraepithelial neoplasias |
| LGIN: Low-grade intraepithelial neoplasias |
| Liver | 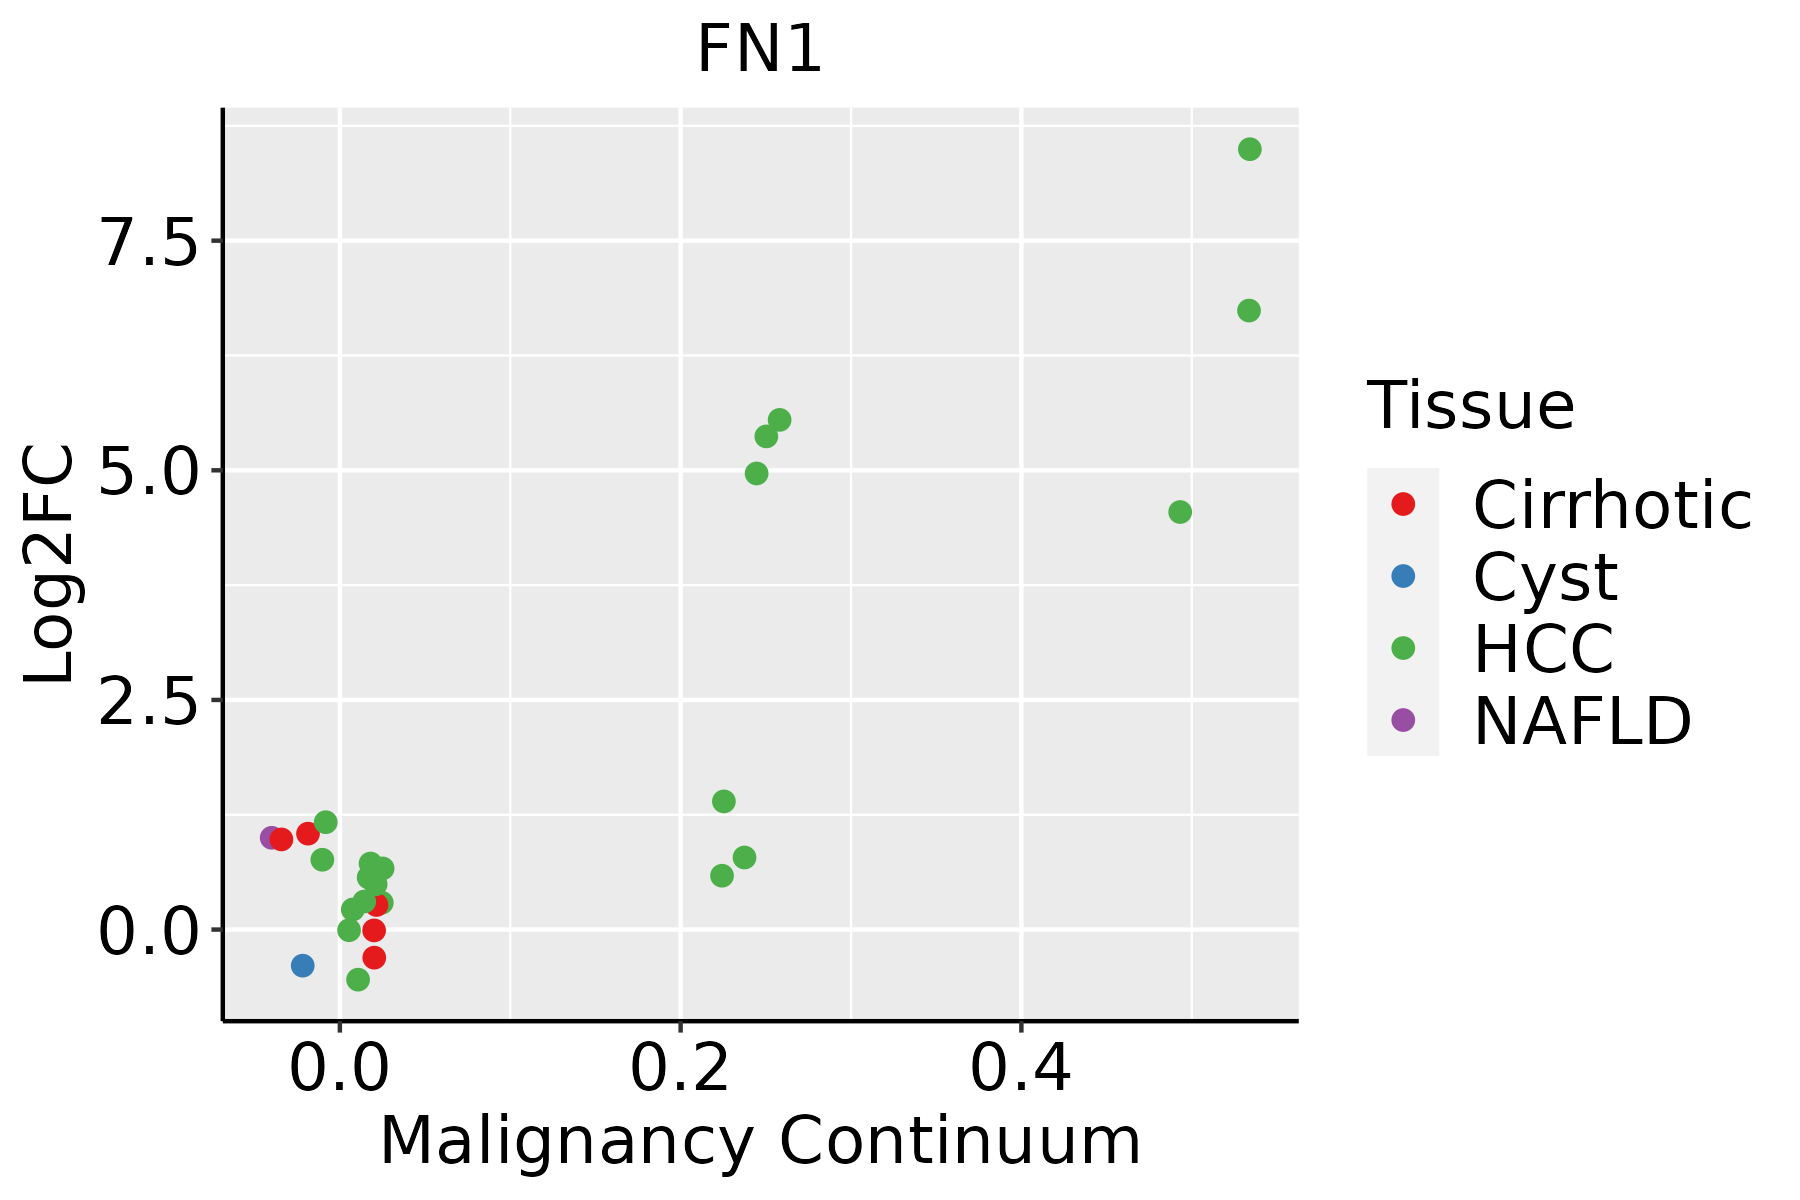 | HCC: Hepatocellular carcinoma |
| NAFLD: Non-alcoholic fatty liver disease |
| Lung | 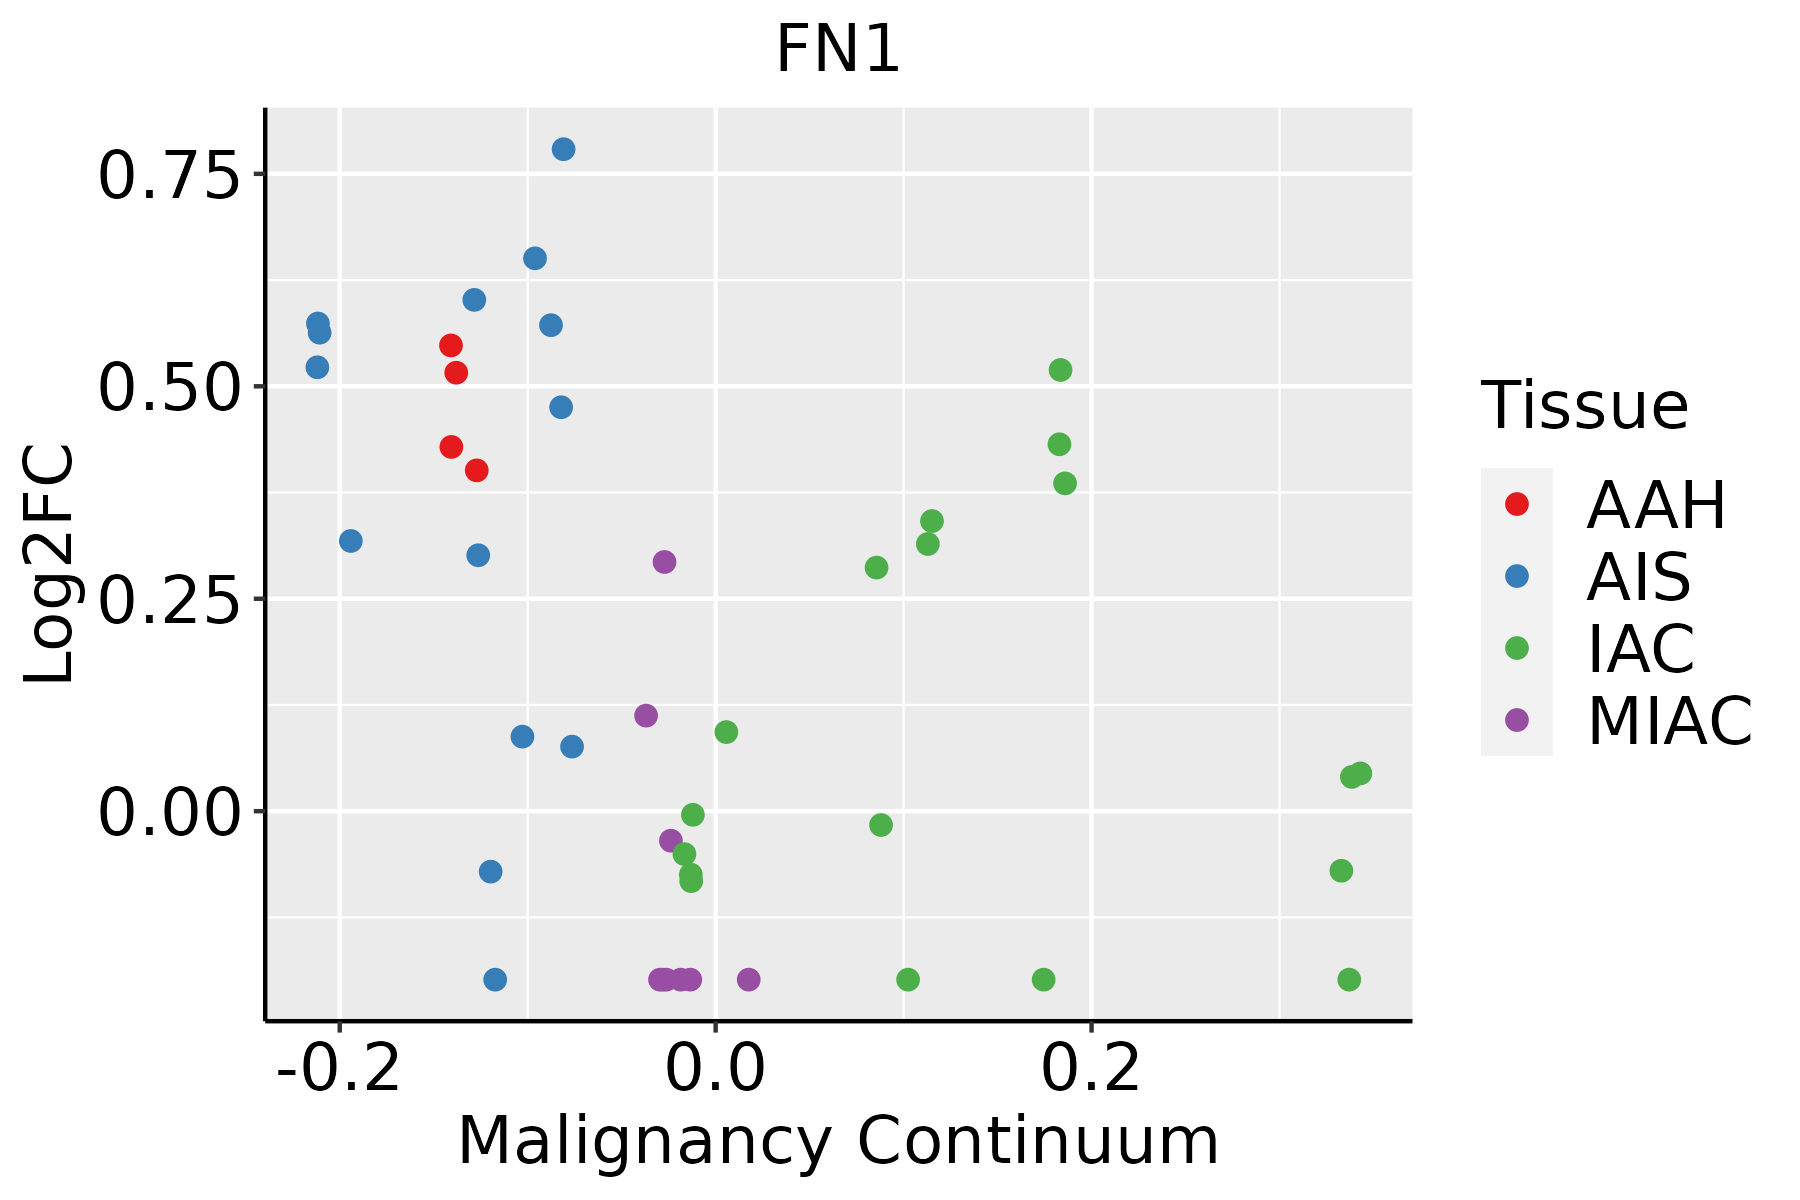 | AAH: Atypical adenomatous hyperplasia |
| AIS: Adenocarcinoma in situ |
| IAC: Invasive lung adenocarcinoma |
| MIA: Minimally invasive adenocarcinoma |
| Oral Cavity | 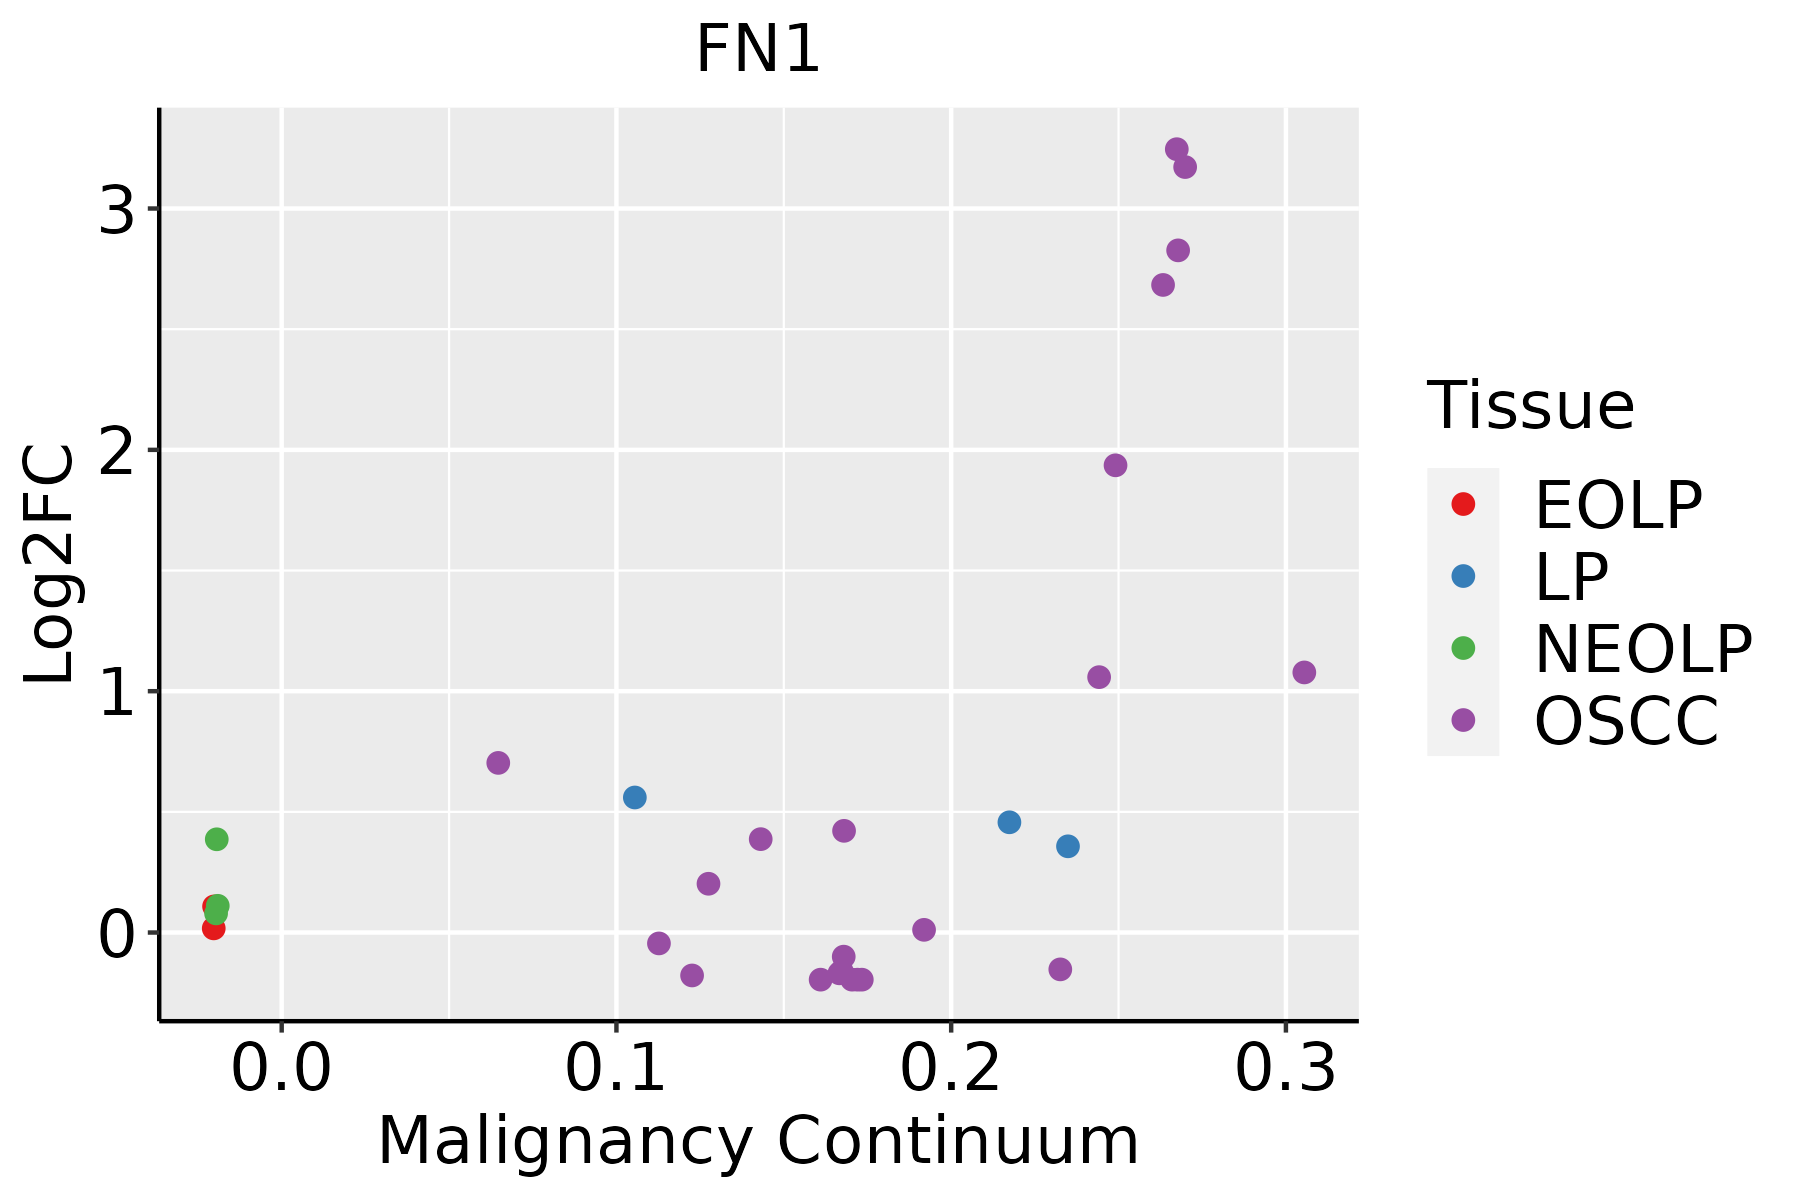 | EOLP: Erosive Oral lichen planus |
| LP: leukoplakia |
| NEOLP: Non-erosive oral lichen planus |
| OSCC: Oral squamous cell carcinoma |
| Thyroid | 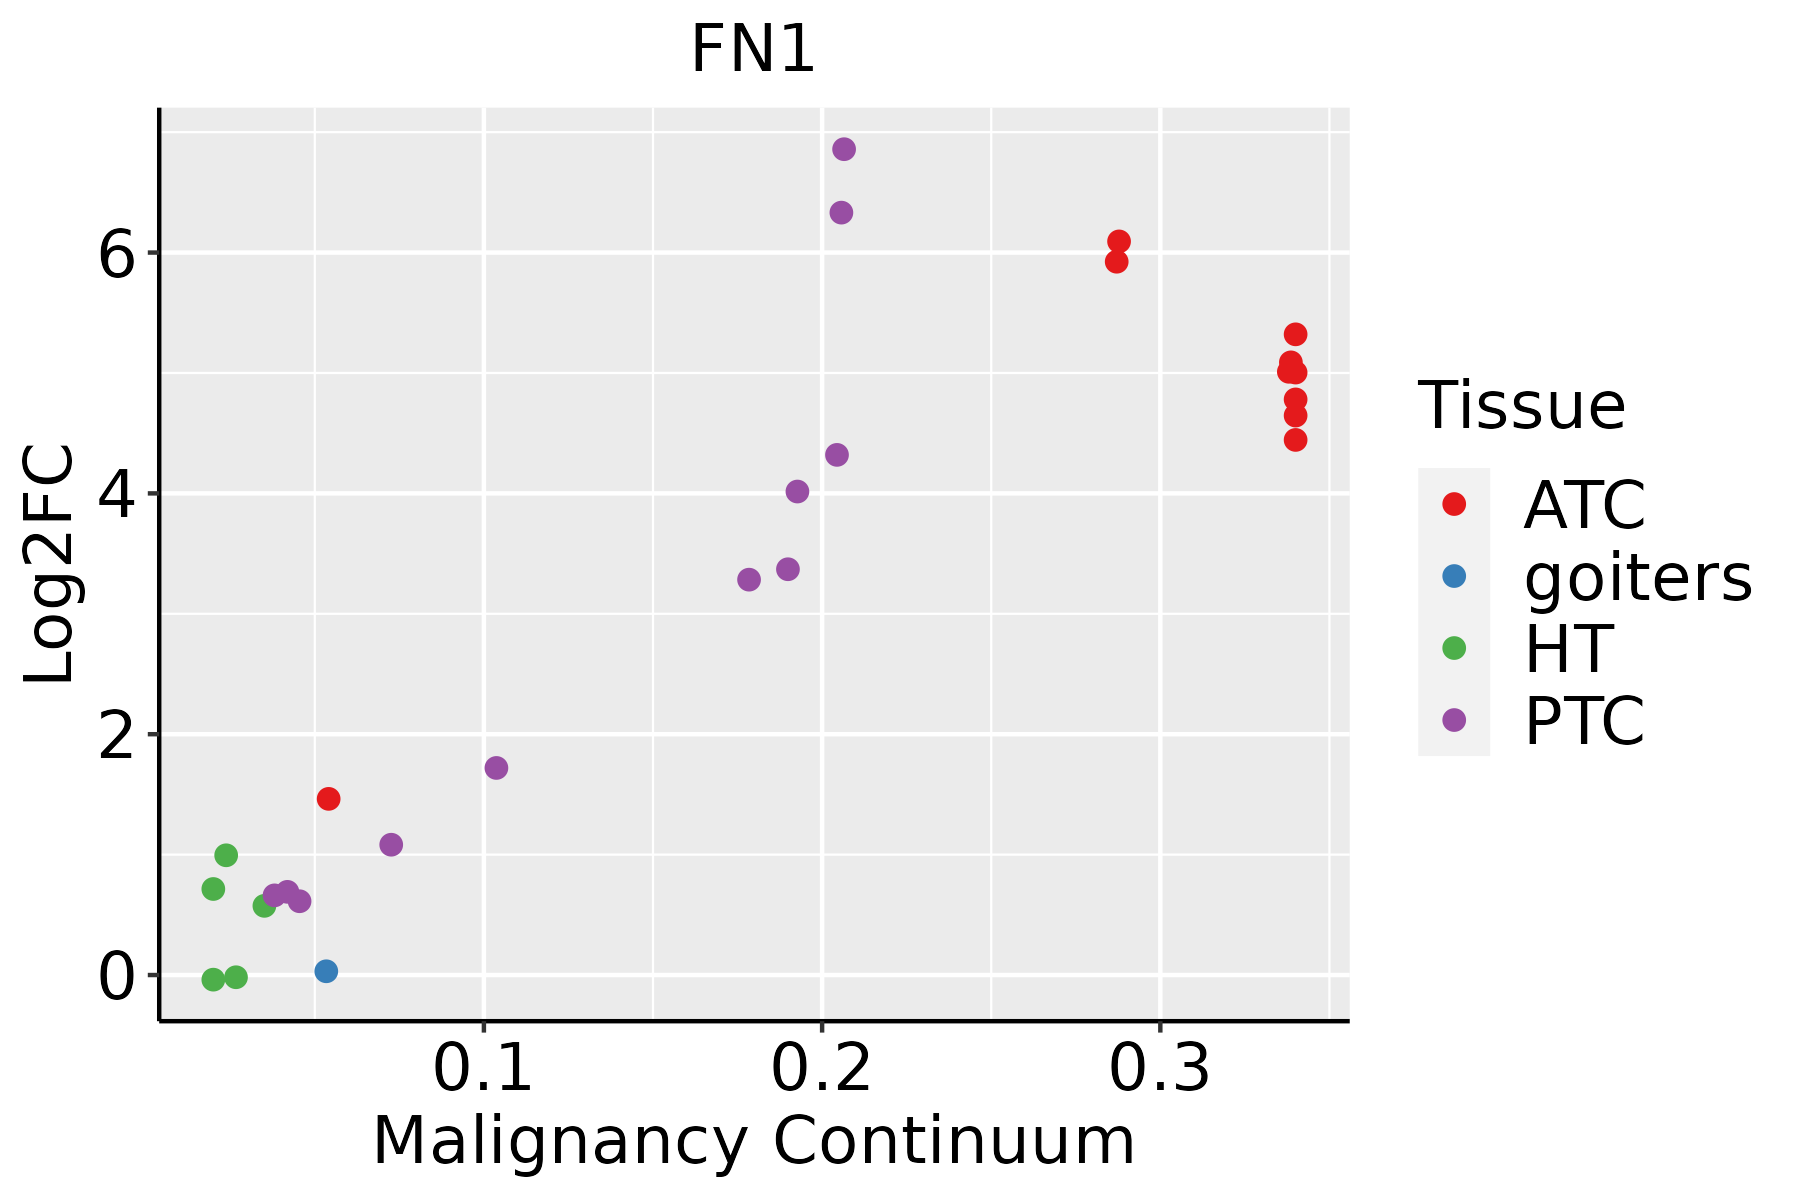 | ATC: Anaplastic thyroid cancer |
| HT: Hashimoto's thyroiditis |
| PTC: Papillary thyroid cancer |
| GO ID | Tissue | Disease Stage | Description | Gene Ratio | Bg Ratio | pvalue | p.adjust | Count |
| GO:0031334113 | Thyroid | PTC | positive regulation of protein-containing complex assembly | 121/5968 | 237/18723 | 5.70e-10 | 1.81e-08 | 121 |
| GO:0008360111 | Thyroid | PTC | regulation of cell shape | 86/5968 | 154/18723 | 6.22e-10 | 1.95e-08 | 86 |
| GO:0010810112 | Thyroid | PTC | regulation of cell-substrate adhesion | 113/5968 | 221/18723 | 1.87e-09 | 5.28e-08 | 113 |
| GO:0031589111 | Thyroid | PTC | cell-substrate adhesion | 169/5968 | 363/18723 | 2.73e-09 | 7.57e-08 | 169 |
| GO:0010639112 | Thyroid | PTC | negative regulation of organelle organization | 163/5968 | 348/18723 | 3.04e-09 | 8.39e-08 | 163 |
| GO:0001558111 | Thyroid | PTC | regulation of cell growth | 188/5968 | 414/18723 | 4.13e-09 | 1.09e-07 | 188 |
| GO:000806423 | Thyroid | PTC | regulation of actin polymerization or depolymerization | 98/5968 | 188/18723 | 6.00e-09 | 1.53e-07 | 98 |
| GO:003004125 | Thyroid | PTC | actin filament polymerization | 99/5968 | 191/18723 | 7.40e-09 | 1.85e-07 | 99 |
| GO:0042060112 | Thyroid | PTC | wound healing | 190/5968 | 422/18723 | 7.72e-09 | 1.92e-07 | 190 |
| GO:003083220 | Thyroid | PTC | regulation of actin filament length | 98/5968 | 189/18723 | 8.58e-09 | 2.10e-07 | 98 |
| GO:003227327 | Thyroid | PTC | positive regulation of protein polymerization | 75/5968 | 138/18723 | 3.65e-08 | 8.02e-07 | 75 |
| GO:0051017112 | Thyroid | PTC | actin filament bundle assembly | 83/5968 | 157/18723 | 3.73e-08 | 8.18e-07 | 83 |
| GO:0061572112 | Thyroid | PTC | actin filament bundle organization | 84/5968 | 161/18723 | 6.75e-08 | 1.40e-06 | 84 |
| GO:0010975110 | Thyroid | PTC | regulation of neuron projection development | 194/5968 | 445/18723 | 1.05e-07 | 2.08e-06 | 194 |
| GO:003083326 | Thyroid | PTC | regulation of actin filament polymerization | 88/5968 | 172/18723 | 1.07e-07 | 2.11e-06 | 88 |
| GO:001072018 | Thyroid | PTC | positive regulation of cell development | 138/5968 | 298/18723 | 1.13e-07 | 2.22e-06 | 138 |
| GO:000184118 | Thyroid | PTC | neural tube formation | 58/5968 | 102/18723 | 1.59e-07 | 3.03e-06 | 58 |
| GO:0120032111 | Thyroid | PTC | regulation of plasma membrane bounded cell projection assembly | 92/5968 | 186/18723 | 4.12e-07 | 6.83e-06 | 92 |
| GO:006156419 | Thyroid | PTC | axon development | 199/5968 | 467/18723 | 5.27e-07 | 8.53e-06 | 199 |
| GO:006049120 | Thyroid | PTC | regulation of cell projection assembly | 92/5968 | 188/18723 | 7.55e-07 | 1.18e-05 | 92 |
| Pathway ID | Tissue | Disease Stage | Description | Gene Ratio | Bg Ratio | pvalue | p.adjust | qvalue | Count |
| hsa0520523 | Breast | IDC | Proteoglycans in cancer | 42/867 | 205/8465 | 7.69e-06 | 9.99e-05 | 7.48e-05 | 42 |
| hsa0510024 | Breast | IDC | Bacterial invasion of epithelial cells | 17/867 | 77/8465 | 1.69e-03 | 1.19e-02 | 8.93e-03 | 17 |
| hsa0481014 | Breast | IDC | Regulation of actin cytoskeleton | 36/867 | 229/8465 | 5.79e-03 | 3.13e-02 | 2.34e-02 | 36 |
| hsa045109 | Breast | IDC | Focal adhesion | 32/867 | 203/8465 | 8.60e-03 | 4.23e-02 | 3.17e-02 | 32 |
| hsa0520533 | Breast | IDC | Proteoglycans in cancer | 42/867 | 205/8465 | 7.69e-06 | 9.99e-05 | 7.48e-05 | 42 |
| hsa0510034 | Breast | IDC | Bacterial invasion of epithelial cells | 17/867 | 77/8465 | 1.69e-03 | 1.19e-02 | 8.93e-03 | 17 |
| hsa0481015 | Breast | IDC | Regulation of actin cytoskeleton | 36/867 | 229/8465 | 5.79e-03 | 3.13e-02 | 2.34e-02 | 36 |
| hsa0451013 | Breast | IDC | Focal adhesion | 32/867 | 203/8465 | 8.60e-03 | 4.23e-02 | 3.17e-02 | 32 |
| hsa05205 | Colorectum | AD | Proteoglycans in cancer | 70/2092 | 205/8465 | 1.37e-03 | 8.46e-03 | 5.39e-03 | 70 |
| hsa04810 | Colorectum | AD | Regulation of actin cytoskeleton | 75/2092 | 229/8465 | 3.36e-03 | 1.76e-02 | 1.12e-02 | 75 |
| hsa04510 | Colorectum | AD | Focal adhesion | 67/2092 | 203/8465 | 4.40e-03 | 2.17e-02 | 1.38e-02 | 67 |
| hsa052051 | Colorectum | AD | Proteoglycans in cancer | 70/2092 | 205/8465 | 1.37e-03 | 8.46e-03 | 5.39e-03 | 70 |
| hsa048101 | Colorectum | AD | Regulation of actin cytoskeleton | 75/2092 | 229/8465 | 3.36e-03 | 1.76e-02 | 1.12e-02 | 75 |
| hsa045101 | Colorectum | AD | Focal adhesion | 67/2092 | 203/8465 | 4.40e-03 | 2.17e-02 | 1.38e-02 | 67 |
| hsa051004 | Colorectum | MSS | Bacterial invasion of epithelial cells | 36/1875 | 77/8465 | 1.41e-06 | 1.82e-05 | 1.11e-05 | 36 |
| hsa051354 | Colorectum | MSS | Yersinia infection | 53/1875 | 137/8465 | 7.73e-06 | 8.93e-05 | 5.47e-05 | 53 |
| hsa052054 | Colorectum | MSS | Proteoglycans in cancer | 65/1875 | 205/8465 | 8.66e-04 | 5.38e-03 | 3.29e-03 | 65 |
| hsa048104 | Colorectum | MSS | Regulation of actin cytoskeleton | 68/1875 | 229/8465 | 4.27e-03 | 1.86e-02 | 1.14e-02 | 68 |
| hsa05222 | Colorectum | MSS | Small cell lung cancer | 30/1875 | 92/8465 | 1.31e-02 | 4.30e-02 | 2.64e-02 | 30 |
| hsa051005 | Colorectum | MSS | Bacterial invasion of epithelial cells | 36/1875 | 77/8465 | 1.41e-06 | 1.82e-05 | 1.11e-05 | 36 |
| Hugo Symbol | Variant Class | Variant Classification | dbSNP RS | HGVSc | HGVSp | HGVSp Short | SWISSPROT | BIOTYPE | SIFT | PolyPhen | Tumor Sample Barcode | Tissue | Histology | Sex | Age | Stage | Therapy Types | Drugs | Outcome |
| FN1 | SNV | Missense_Mutation | | c.7241N>A | p.Gly2414Glu | p.G2414E | P02751 | protein_coding | deleterious(0) | probably_damaging(1) | TCGA-A2-A0SY-01 | Breast | breast invasive carcinoma | Female | <65 | III/IV | Hormone Therapy | arimidex | SD |
| FN1 | SNV | Missense_Mutation | | c.3291G>C | p.Glu1097Asp | p.E1097D | P02751 | protein_coding | tolerated(0.31) | probably_damaging(0.992) | TCGA-A8-A085-01 | Breast | breast invasive carcinoma | Male | <65 | I/II | Hormone Therapy | tamoxiphen | SD |
| FN1 | SNV | Missense_Mutation | | c.1094C>G | p.Thr365Ser | p.T365S | P02751 | protein_coding | deleterious(0.02) | benign(0.066) | TCGA-A8-A09W-01 | Breast | breast invasive carcinoma | Female | >=65 | III/IV | Unknown | Unknown | SD |
| FN1 | SNV | Missense_Mutation | | c.968N>C | p.Leu323Pro | p.L323P | P02751 | protein_coding | deleterious(0) | probably_damaging(0.999) | TCGA-A8-A09Z-01 | Breast | breast invasive carcinoma | Female | >=65 | I/II | Unknown | Unknown | SD |
| FN1 | SNV | Missense_Mutation | rs750176227 | c.274N>A | p.Glu92Lys | p.E92K | P02751 | protein_coding | deleterious(0.01) | probably_damaging(0.992) | TCGA-AC-A5XS-01 | Breast | breast invasive carcinoma | Female | >=65 | I/II | Hormone Therapy | femara | SD |
| FN1 | SNV | Missense_Mutation | | c.2488N>T | p.Arg830Cys | p.R830C | P02751 | protein_coding | deleterious(0.01) | possibly_damaging(0.683) | TCGA-AN-A046-01 | Breast | breast invasive carcinoma | Female | >=65 | I/II | Unknown | Unknown | SD |
| FN1 | SNV | Missense_Mutation | | c.331A>G | p.Thr111Ala | p.T111A | P02751 | protein_coding | deleterious(0.01) | probably_damaging(0.992) | TCGA-AN-A0XN-01 | Breast | breast invasive carcinoma | Female | >=65 | III/IV | Unknown | Unknown | SD |
| FN1 | SNV | Missense_Mutation | | c.4034N>A | p.Gly1345Asp | p.G1345D | P02751 | protein_coding | tolerated(0.11) | probably_damaging(1) | TCGA-AO-A128-01 | Breast | breast invasive carcinoma | Female | <65 | I/II | Chemotherapy | doxorubicin | SD |
| FN1 | SNV | Missense_Mutation | rs149294265 | c.7402N>A | p.Val2468Ile | p.V2468I | P02751 | protein_coding | tolerated(0.1) | benign(0.023) | TCGA-BH-A0HF-01 | Breast | breast invasive carcinoma | Female | >=65 | I/II | Hormone Therapy | arimidex | SD |
| FN1 | SNV | Missense_Mutation | | c.1717N>A | p.Gly573Arg | p.G573R | P02751 | protein_coding | deleterious(0) | probably_damaging(1) | TCGA-D8-A1JN-01 | Breast | breast invasive carcinoma | Female | >=65 | III/IV | Hormone Therapy | anastrozolum | SD |


