
|
|||||
|
 | |
| |
| |
| |
| |
| |
|
Gene: FER |
Gene summary for FER |
| Gene information | Species | Human | Gene symbol | FER | Gene ID | 2241 |
| Gene name | FER tyrosine kinase | |
| Gene Alias | PPP1R74 | |
| Cytomap | 5q21.3 | |
| Gene Type | protein-coding | GO ID | GO:0000226 | UniProtAcc | P16591 |
Top |
Malignant transformation analysis |
| Identification of the aberrant gene expression in precancerous and cancerous lesions by comparing the gene expression of stem-like cells in diseased tissues with normal stem cells |
| Entrez ID | Symbol | Replicates | Species | Organ | Tissue | Adj P-value | Log2FC | Malignancy |
| 2241 | FER | CA_HPV_1 | Human | Cervix | CC | 2.15e-03 | -1.29e-01 | 0.0264 |
| 2241 | FER | CCI_2 | Human | Cervix | CC | 5.72e-03 | 5.68e-01 | 0.5249 |
| 2241 | FER | CCI_3 | Human | Cervix | CC | 6.13e-11 | 9.61e-01 | 0.516 |
| 2241 | FER | HTA11_3410_2000001011 | Human | Colorectum | AD | 1.33e-10 | -5.43e-01 | 0.0155 |
| 2241 | FER | HTA11_2487_2000001011 | Human | Colorectum | SER | 6.49e-03 | -4.81e-01 | -0.1808 |
| 2241 | FER | HTA11_3361_2000001011 | Human | Colorectum | AD | 1.73e-05 | -5.76e-01 | -0.1207 |
| 2241 | FER | HTA11_696_2000001011 | Human | Colorectum | AD | 4.13e-13 | -3.96e-01 | -0.1464 |
| 2241 | FER | HTA11_866_2000001011 | Human | Colorectum | AD | 1.85e-02 | -2.90e-01 | -0.1001 |
| 2241 | FER | HTA11_1391_2000001011 | Human | Colorectum | AD | 6.50e-06 | -4.30e-01 | -0.059 |
| 2241 | FER | HTA11_866_3004761011 | Human | Colorectum | AD | 2.27e-10 | -5.74e-01 | 0.096 |
| 2241 | FER | HTA11_10711_2000001011 | Human | Colorectum | AD | 2.93e-03 | -4.73e-01 | 0.0338 |
| 2241 | FER | HTA11_7696_3000711011 | Human | Colorectum | AD | 8.30e-10 | -4.43e-01 | 0.0674 |
| 2241 | FER | HTA11_99999970781_79442 | Human | Colorectum | MSS | 2.12e-08 | -4.37e-01 | 0.294 |
| 2241 | FER | HTA11_99999971662_82457 | Human | Colorectum | MSS | 3.46e-07 | -4.47e-01 | 0.3859 |
| 2241 | FER | HTA11_99999974143_84620 | Human | Colorectum | MSS | 4.15e-24 | -6.43e-01 | 0.3005 |
| 2241 | FER | A001-C-207 | Human | Colorectum | FAP | 9.59e-04 | -3.63e-01 | 0.1278 |
| 2241 | FER | A015-C-203 | Human | Colorectum | FAP | 1.76e-21 | -5.36e-01 | -0.1294 |
| 2241 | FER | A015-C-204 | Human | Colorectum | FAP | 4.08e-06 | -3.63e-01 | -0.0228 |
| 2241 | FER | A014-C-040 | Human | Colorectum | FAP | 3.21e-03 | -3.78e-01 | -0.1184 |
| 2241 | FER | A002-C-201 | Human | Colorectum | FAP | 4.97e-12 | -4.61e-01 | 0.0324 |
| Page: 1 2 3 4 5 6 7 8 9 |
| Tissue | Expression Dynamics | Abbreviation |
| Cervix |  | CC: Cervix cancer |
| HSIL_HPV: HPV-infected high-grade squamous intraepithelial lesions | ||
| N_HPV: HPV-infected normal cervix | ||
| Colorectum (GSE201348) |  | FAP: Familial adenomatous polyposis |
| CRC: Colorectal cancer | ||
| Colorectum (HTA11) |  | AD: Adenomas |
| SER: Sessile serrated lesions | ||
| MSI-H: Microsatellite-high colorectal cancer | ||
| MSS: Microsatellite stable colorectal cancer | ||
| Endometrium | 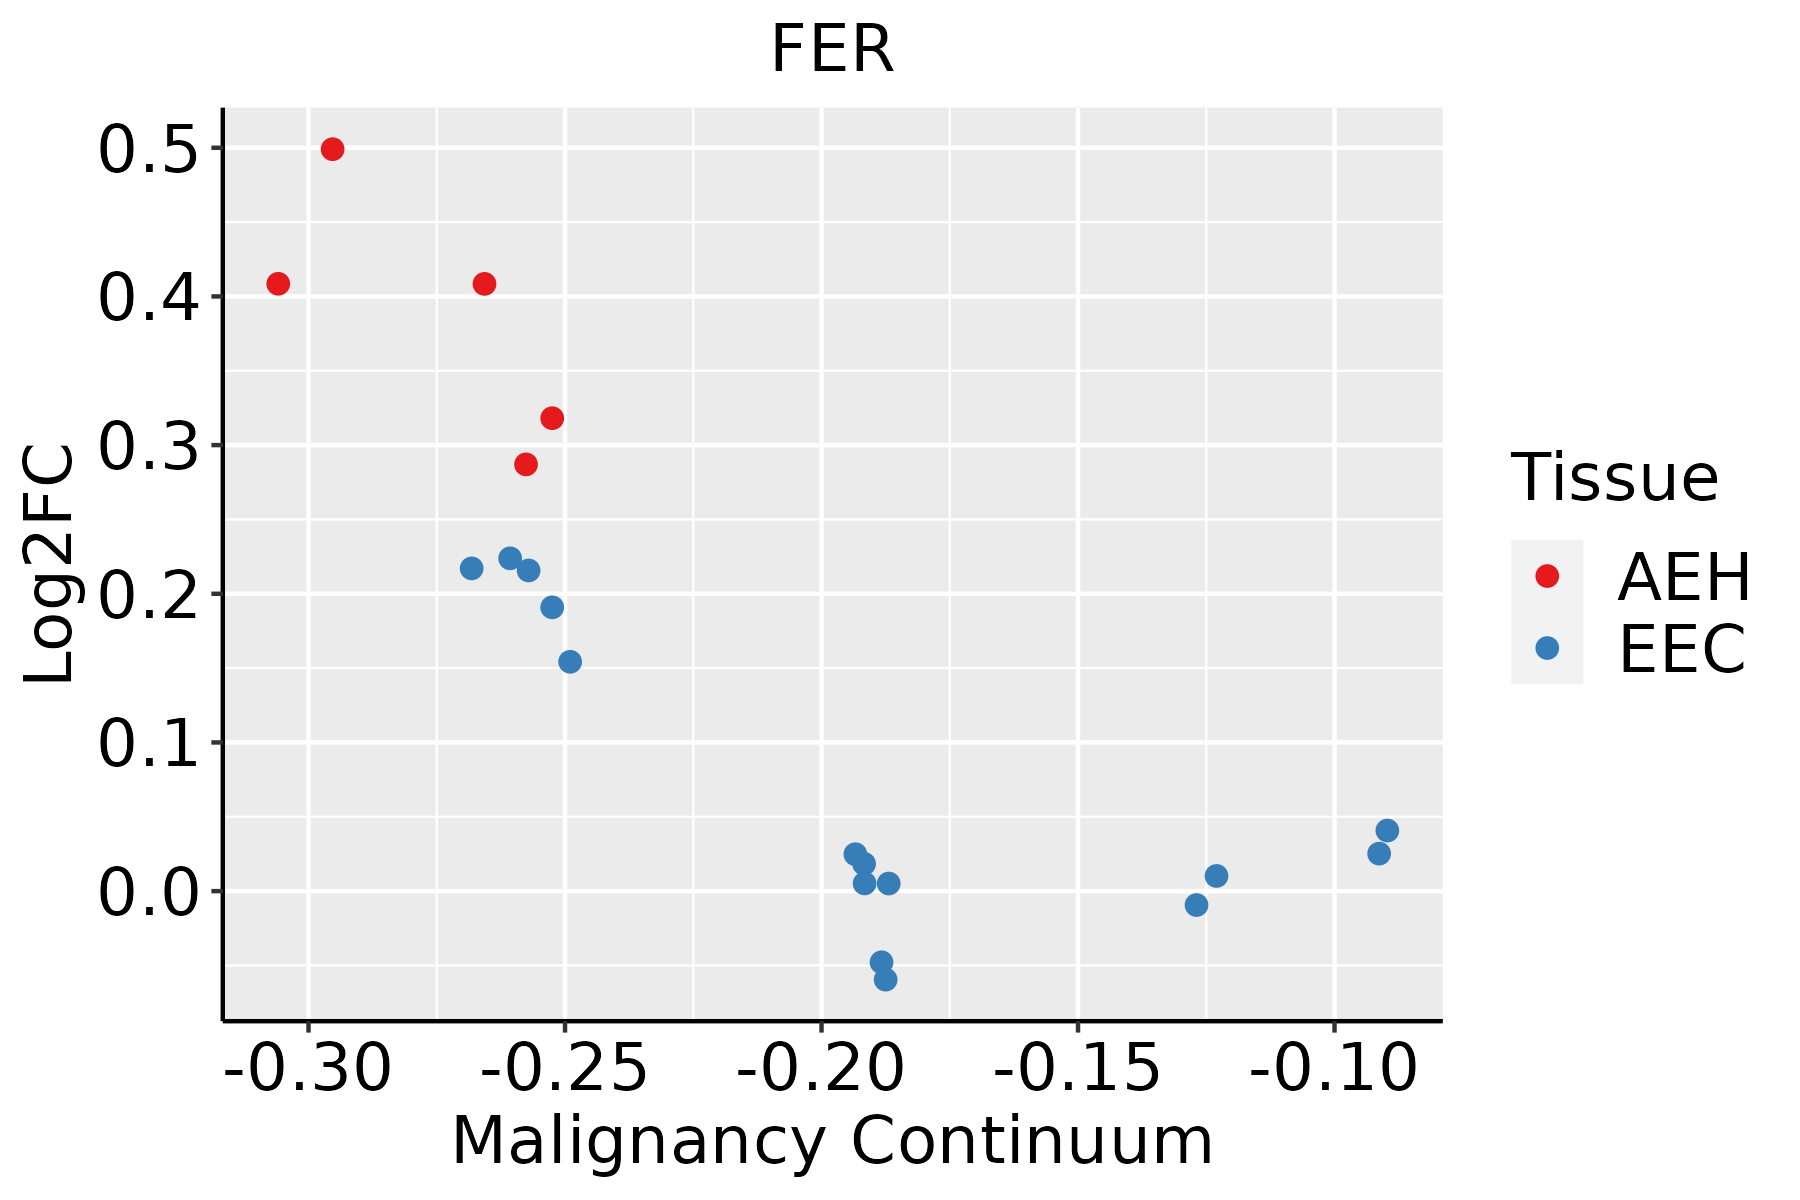 | AEH: Atypical endometrial hyperplasia |
| EEC: Endometrioid Cancer | ||
| Esophagus |  | ESCC: Esophageal squamous cell carcinoma |
| HGIN: High-grade intraepithelial neoplasias | ||
| LGIN: Low-grade intraepithelial neoplasias | ||
| Liver | 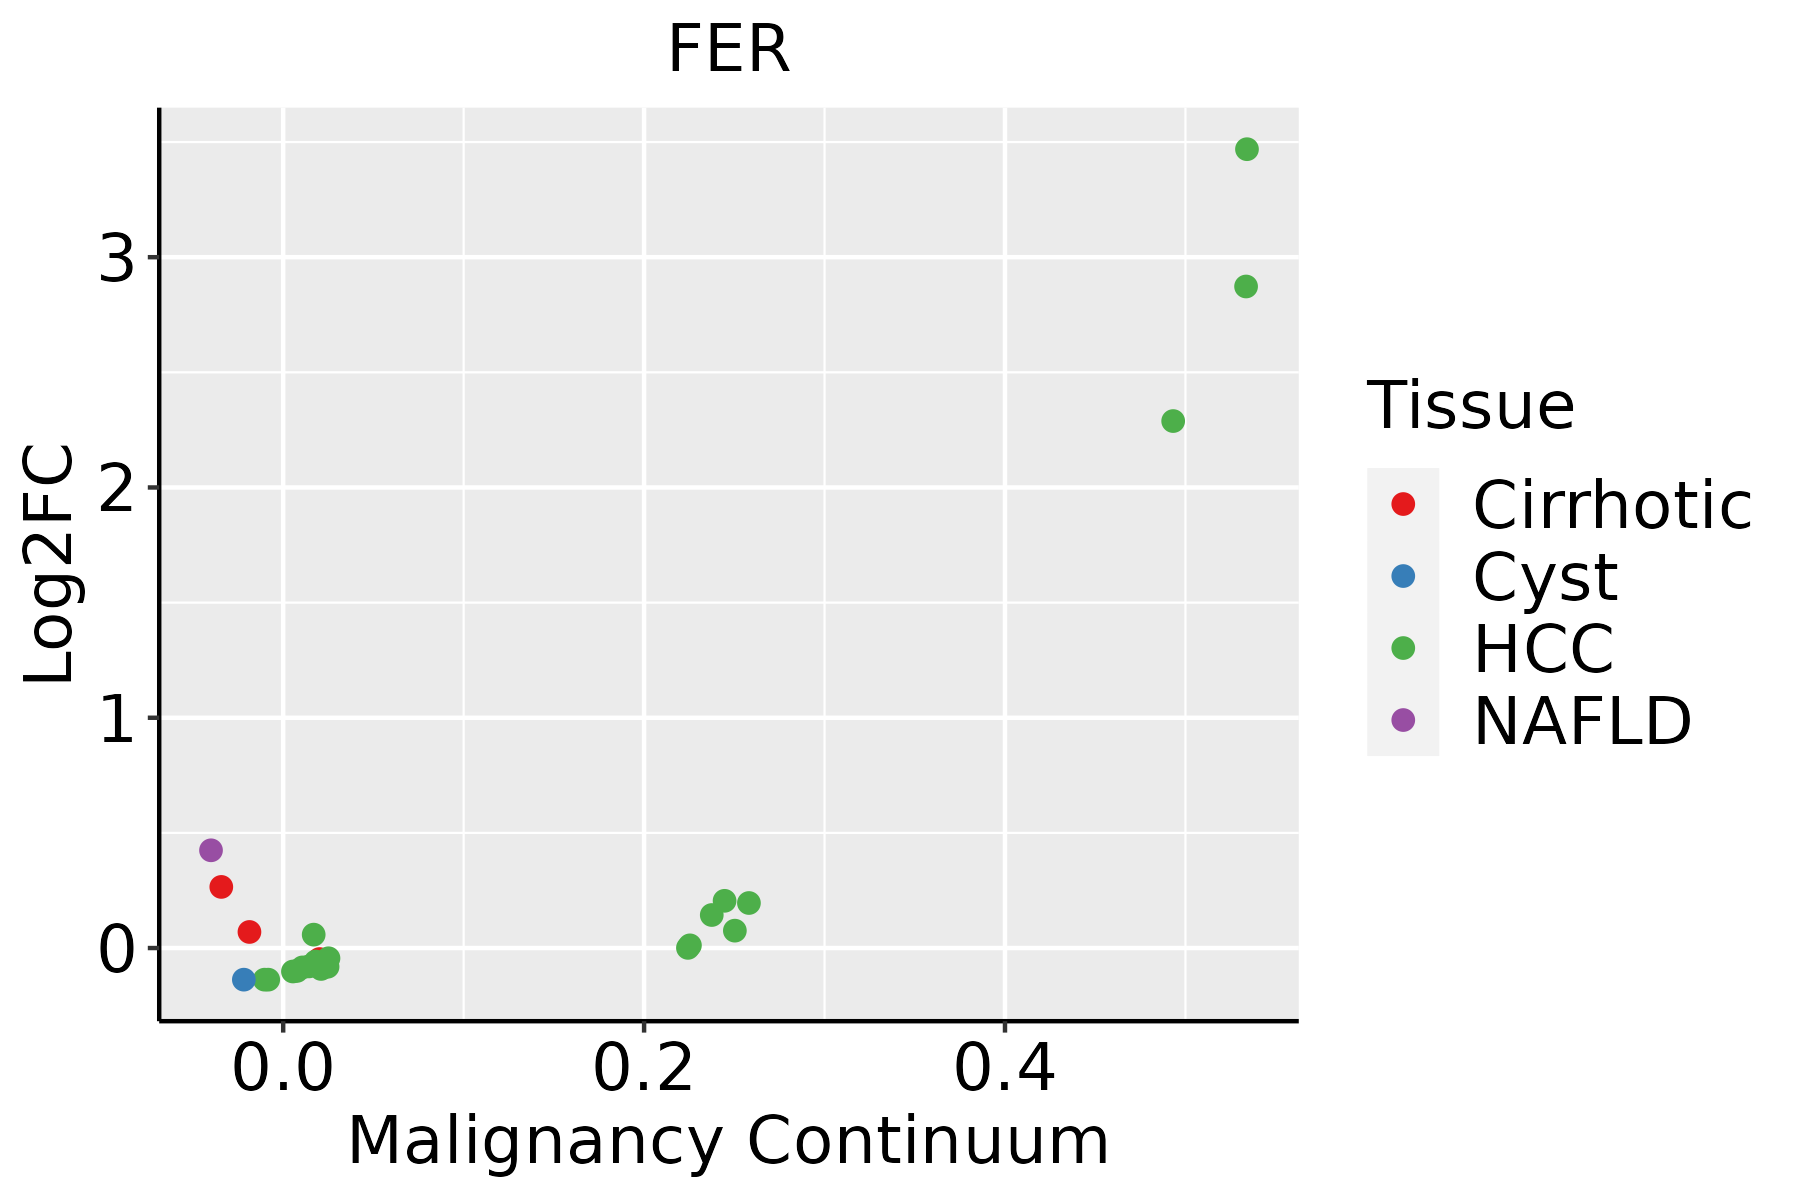 | HCC: Hepatocellular carcinoma |
| NAFLD: Non-alcoholic fatty liver disease | ||
| Lung |  | AAH: Atypical adenomatous hyperplasia |
| AIS: Adenocarcinoma in situ | ||
| IAC: Invasive lung adenocarcinoma | ||
| MIA: Minimally invasive adenocarcinoma | ||
| Oral Cavity | 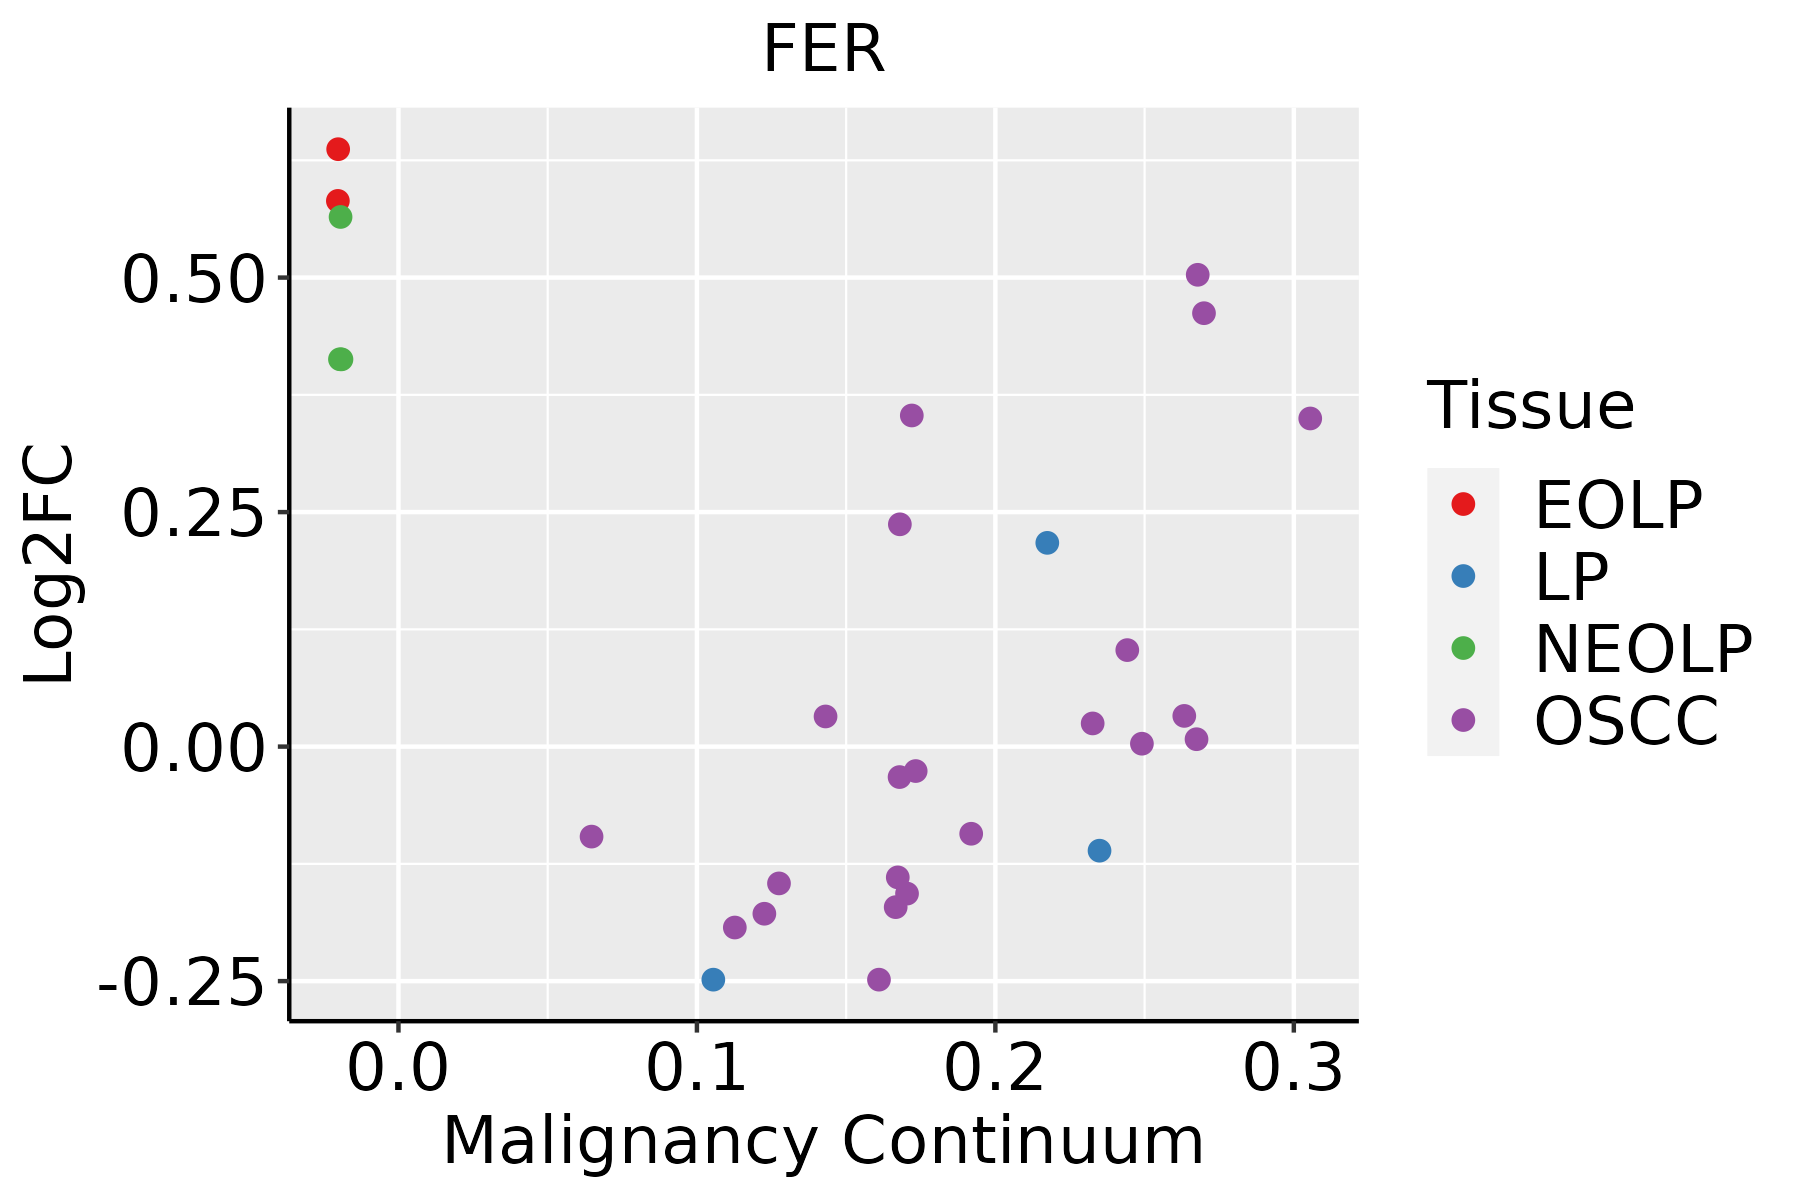 | EOLP: Erosive Oral lichen planus |
| LP: leukoplakia | ||
| NEOLP: Non-erosive oral lichen planus | ||
| OSCC: Oral squamous cell carcinoma | ||
| Prostate | 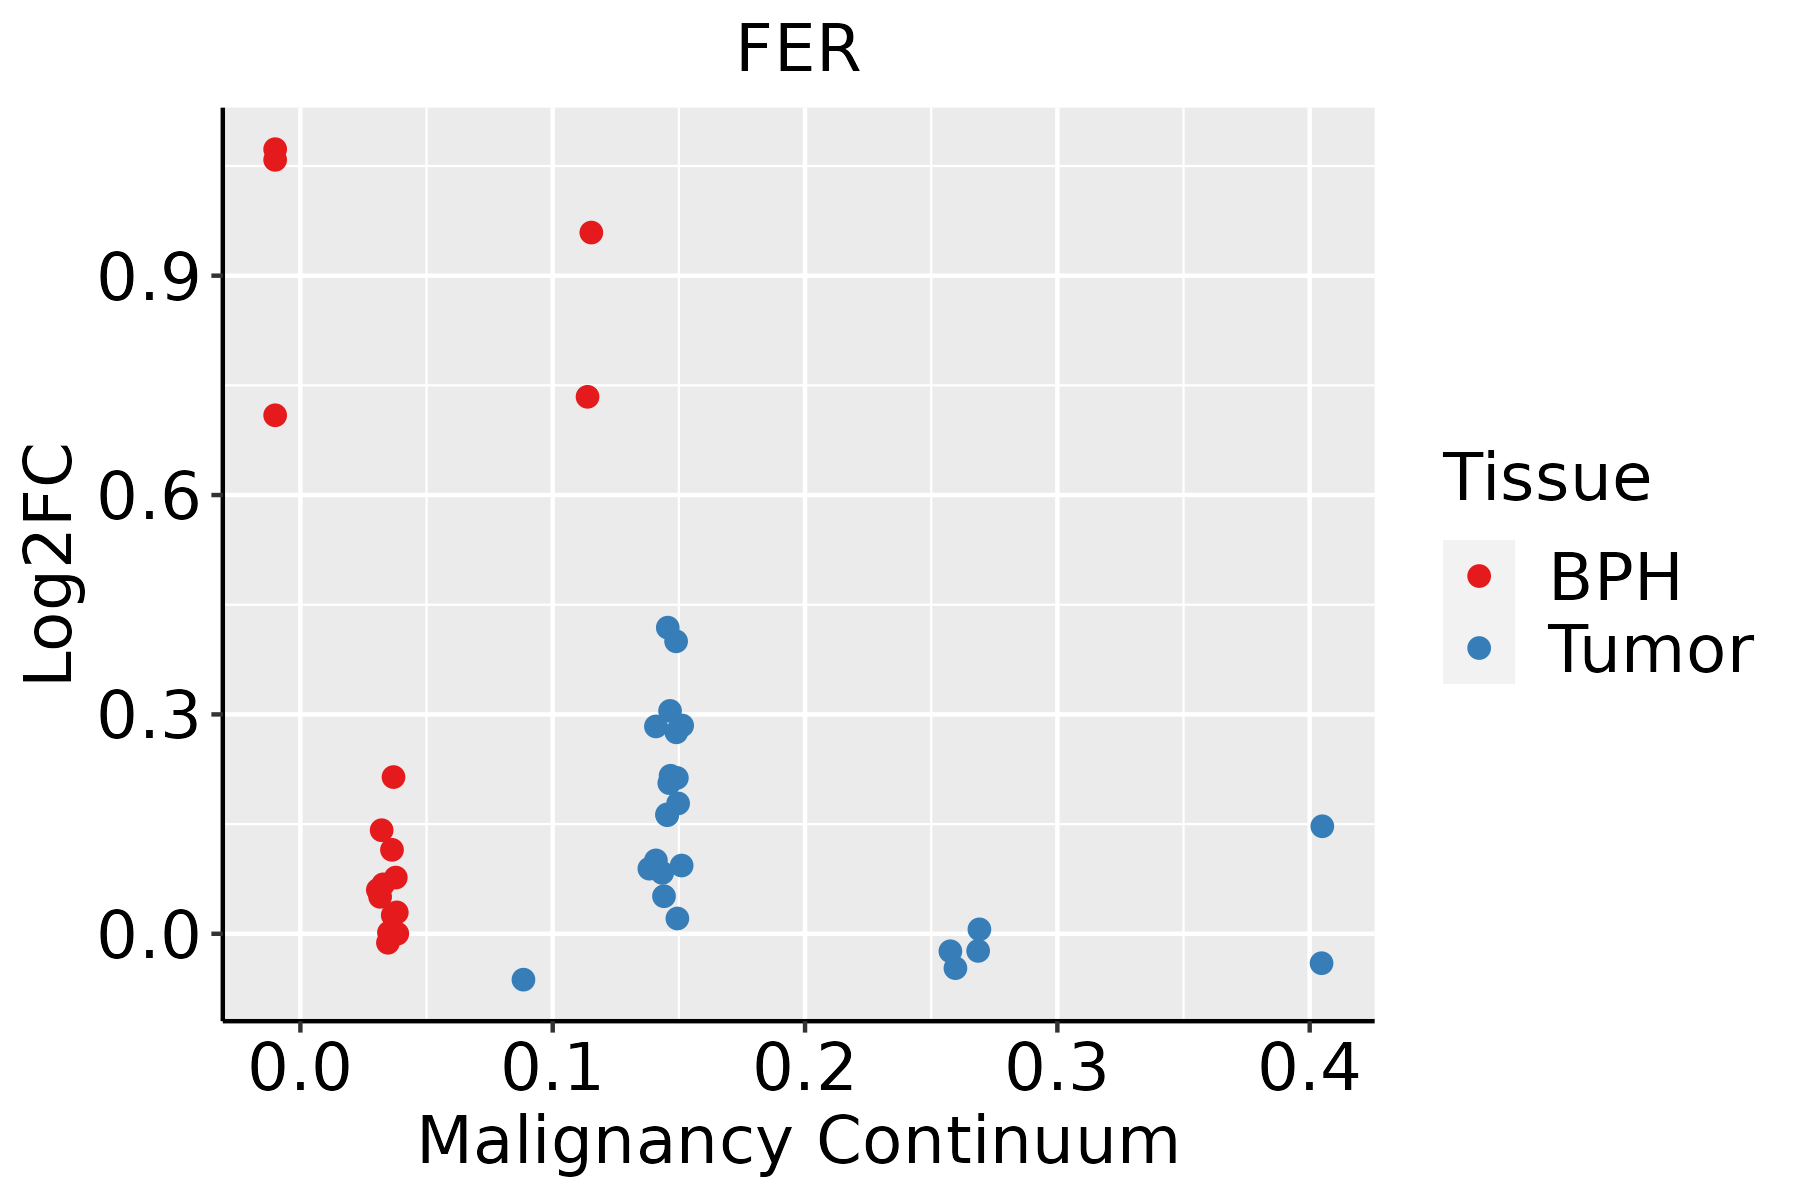 | BPH: Benign Prostatic Hyperplasia |
| Skin | 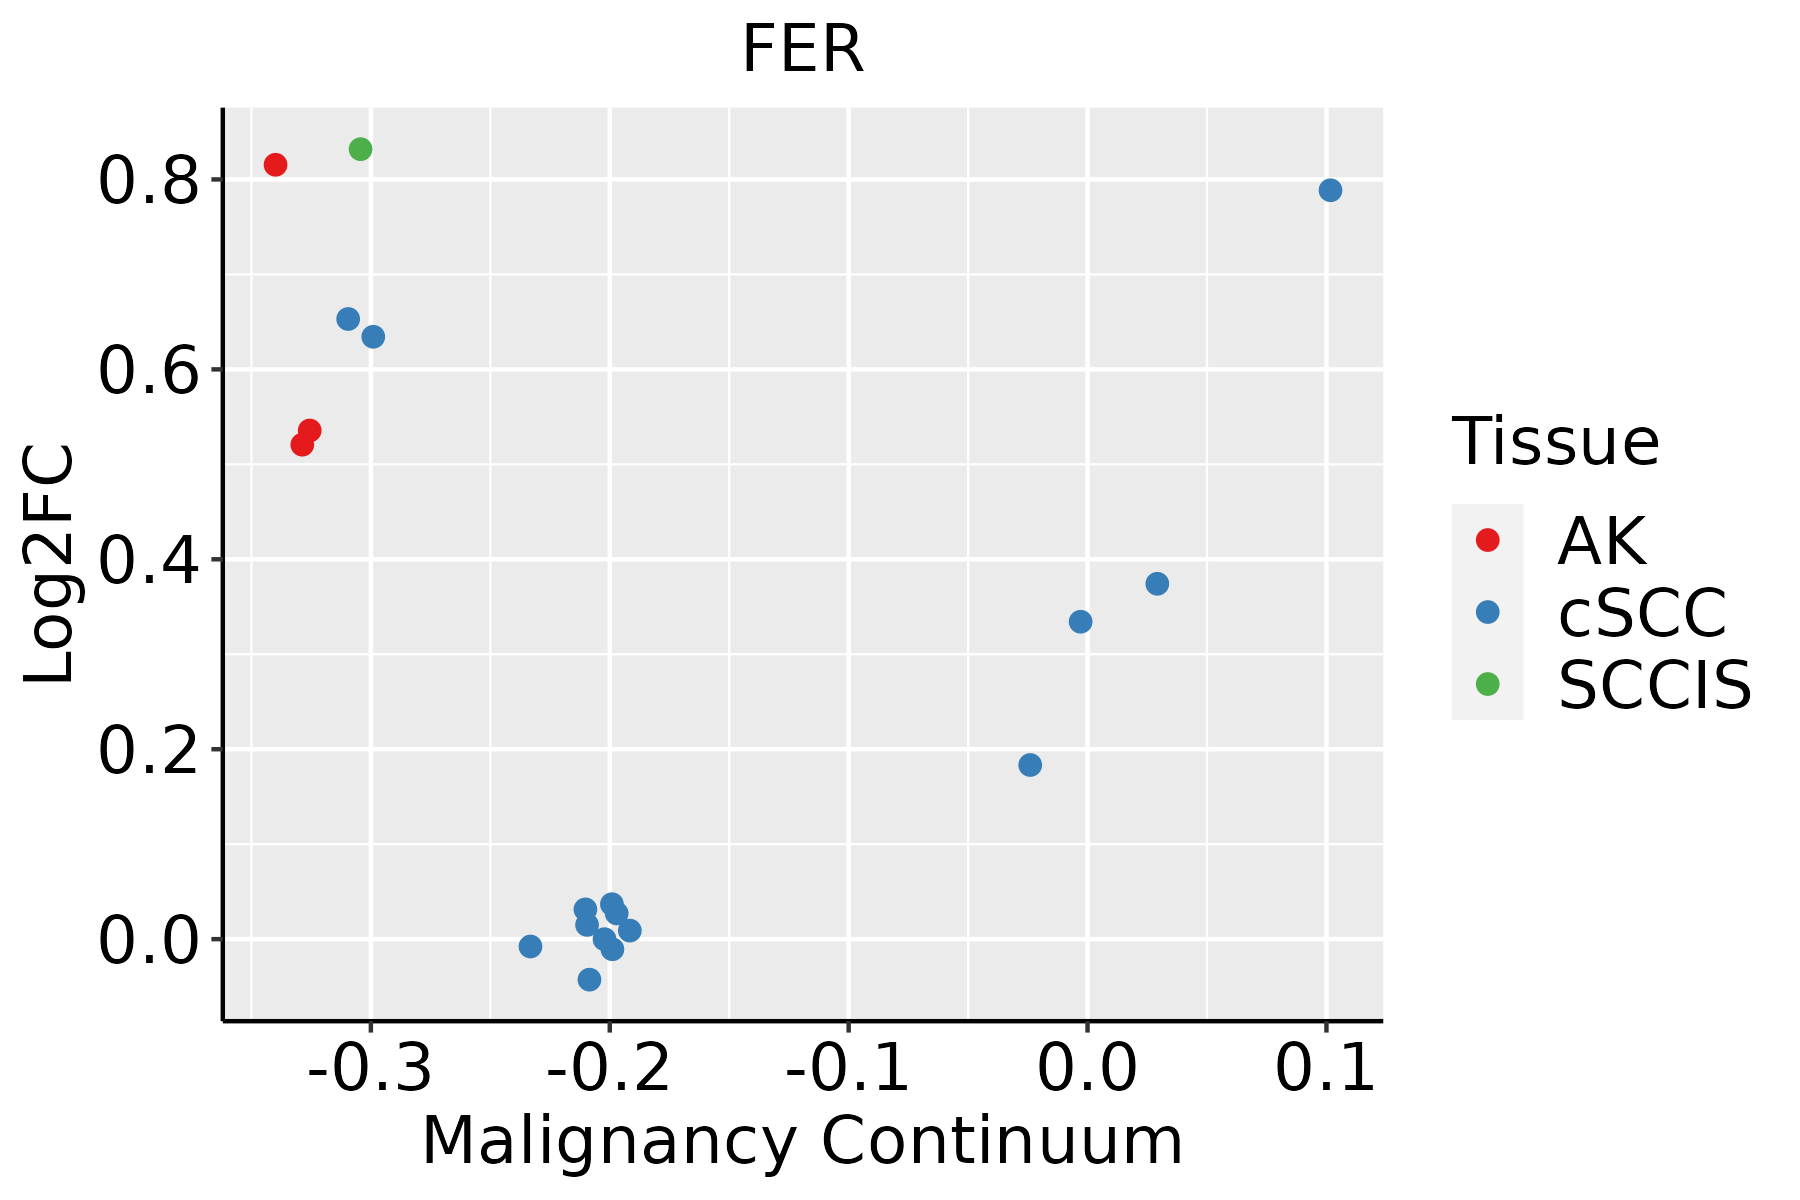 | AK: Actinic keratosis |
| cSCC: Cutaneous squamous cell carcinoma | ||
| SCCIS:squamous cell carcinoma in situ |
| ∗log2FC in expression of this searched gene in stem-like cells from each diseased tissue sample relative to stem-like cells in normal samples in each tissue plotted against the malignancy continuum. Samples are colored based on if they are from different disease stage. |
Top |
Malignant transformation related pathway analysis |
| Find out the enriched GO biological processes and KEGG pathways involved in transition from healthy to precancer to cancer |
| Tissue | Disease Stage | Enriched GO biological Processes |
| Colorectum | AD |  |
| Colorectum | SER |  |
| Colorectum | MSS |  |
| Colorectum | MSI-H |  |
| Colorectum | FAP |  |
| ∗Top 15 enriched GO BP terms are showed in the bar plot of each disease state in each tissue. Each row represents a significant GO biological process which is colored according to the -log10(p.adjust). |
| Page: 1 2 3 4 5 6 7 8 9 |
| GO ID | Tissue | Disease Stage | Description | Gene Ratio | Bg Ratio | pvalue | p.adjust | Count |
| GO:004206029 | Skin | cSCC | wound healing | 152/4864 | 422/18723 | 2.66e-06 | 4.26e-05 | 152 |
| GO:003812724 | Skin | cSCC | ERBB signaling pathway | 55/4864 | 121/18723 | 2.77e-06 | 4.38e-05 | 55 |
| GO:001605524 | Skin | cSCC | Wnt signaling pathway | 158/4864 | 444/18723 | 3.80e-06 | 5.70e-05 | 158 |
| GO:000195224 | Skin | cSCC | regulation of cell-matrix adhesion | 57/4864 | 128/18723 | 4.07e-06 | 6.07e-05 | 57 |
| GO:001081027 | Skin | cSCC | regulation of cell-substrate adhesion | 88/4864 | 221/18723 | 4.26e-06 | 6.32e-05 | 88 |
| GO:019873824 | Skin | cSCC | cell-cell signaling by wnt | 158/4864 | 446/18723 | 5.08e-06 | 7.38e-05 | 158 |
| GO:190458916 | Skin | cSCC | regulation of protein import | 33/4864 | 63/18723 | 6.88e-06 | 9.59e-05 | 33 |
| GO:000701529 | Skin | cSCC | actin filament organization | 156/4864 | 442/18723 | 7.37e-06 | 1.02e-04 | 156 |
| GO:003297029 | Skin | cSCC | regulation of actin filament-based process | 142/4864 | 397/18723 | 8.50e-06 | 1.13e-04 | 142 |
| GO:1902905112 | Skin | cSCC | positive regulation of supramolecular fiber organization | 83/4864 | 209/18723 | 8.87e-06 | 1.17e-04 | 83 |
| GO:009758118 | Skin | cSCC | lamellipodium organization | 42/4864 | 90/18723 | 1.83e-05 | 2.19e-04 | 42 |
| GO:004230615 | Skin | cSCC | regulation of protein import into nucleus | 31/4864 | 60/18723 | 1.86e-05 | 2.22e-04 | 31 |
| GO:003158926 | Skin | cSCC | cell-substrate adhesion | 130/4864 | 363/18723 | 1.87e-05 | 2.23e-04 | 130 |
| GO:000717323 | Skin | cSCC | epidermal growth factor receptor signaling pathway | 48/4864 | 108/18723 | 2.42e-05 | 2.76e-04 | 48 |
| GO:0032271112 | Skin | cSCC | regulation of protein polymerization | 89/4864 | 233/18723 | 2.57e-05 | 2.91e-04 | 89 |
| GO:0110053111 | Skin | cSCC | regulation of actin filament organization | 103/4864 | 278/18723 | 2.78e-05 | 3.12e-04 | 103 |
| GO:003295629 | Skin | cSCC | regulation of actin cytoskeleton organization | 127/4864 | 358/18723 | 3.83e-05 | 4.13e-04 | 127 |
| GO:0051495110 | Skin | cSCC | positive regulation of cytoskeleton organization | 86/4864 | 226/18723 | 4.08e-05 | 4.34e-04 | 86 |
| GO:000722924 | Skin | cSCC | integrin-mediated signaling pathway | 47/4864 | 107/18723 | 4.21e-05 | 4.43e-04 | 47 |
| GO:0034614111 | Skin | cSCC | cellular response to reactive oxygen species | 63/4864 | 155/18723 | 4.50e-05 | 4.72e-04 | 63 |
| Page: 1 2 3 4 5 6 7 8 9 10 11 12 13 14 15 16 17 18 19 20 21 22 23 24 25 26 27 28 29 30 31 32 33 34 35 36 37 38 39 40 41 42 43 44 45 46 47 48 49 50 51 52 53 54 55 56 57 58 59 60 61 62 63 64 65 66 67 68 69 70 71 72 73 74 75 76 77 78 79 80 81 82 83 84 85 86 87 88 89 90 91 92 93 94 95 96 97 98 99 100 101 102 103 104 105 106 107 108 109 110 111 112 113 114 115 116 117 118 119 120 121 122 123 124 125 |
| Pathway ID | Tissue | Disease Stage | Description | Gene Ratio | Bg Ratio | pvalue | p.adjust | qvalue | Count |
| hsa0452020 | Cervix | CC | Adherens junction | 33/1267 | 93/8465 | 6.99e-07 | 7.31e-06 | 4.32e-06 | 33 |
| hsa04520110 | Cervix | CC | Adherens junction | 33/1267 | 93/8465 | 6.99e-07 | 7.31e-06 | 4.32e-06 | 33 |
| hsa04520 | Colorectum | AD | Adherens junction | 50/2092 | 93/8465 | 1.52e-09 | 2.83e-08 | 1.81e-08 | 50 |
| hsa045201 | Colorectum | AD | Adherens junction | 50/2092 | 93/8465 | 1.52e-09 | 2.83e-08 | 1.81e-08 | 50 |
| hsa045202 | Colorectum | SER | Adherens junction | 37/1580 | 93/8465 | 1.54e-06 | 2.35e-05 | 1.71e-05 | 37 |
| hsa045203 | Colorectum | SER | Adherens junction | 37/1580 | 93/8465 | 1.54e-06 | 2.35e-05 | 1.71e-05 | 37 |
| hsa045204 | Colorectum | MSS | Adherens junction | 42/1875 | 93/8465 | 6.18e-07 | 9.01e-06 | 5.52e-06 | 42 |
| hsa045205 | Colorectum | MSS | Adherens junction | 42/1875 | 93/8465 | 6.18e-07 | 9.01e-06 | 5.52e-06 | 42 |
| hsa045208 | Colorectum | FAP | Adherens junction | 45/1404 | 93/8465 | 8.66e-13 | 2.89e-10 | 1.76e-10 | 45 |
| hsa045209 | Colorectum | FAP | Adherens junction | 45/1404 | 93/8465 | 8.66e-13 | 2.89e-10 | 1.76e-10 | 45 |
| hsa0452010 | Colorectum | CRC | Adherens junction | 37/1091 | 93/8465 | 5.72e-11 | 6.37e-09 | 4.32e-09 | 37 |
| hsa0452011 | Colorectum | CRC | Adherens junction | 37/1091 | 93/8465 | 5.72e-11 | 6.37e-09 | 4.32e-09 | 37 |
| hsa0452025 | Endometrium | AEH | Adherens junction | 36/1197 | 93/8465 | 3.49e-09 | 5.98e-08 | 4.37e-08 | 36 |
| hsa04520111 | Endometrium | AEH | Adherens junction | 36/1197 | 93/8465 | 3.49e-09 | 5.98e-08 | 4.37e-08 | 36 |
| hsa0452026 | Endometrium | EEC | Adherens junction | 36/1237 | 93/8465 | 8.57e-09 | 1.48e-07 | 1.11e-07 | 36 |
| hsa0452035 | Endometrium | EEC | Adherens junction | 36/1237 | 93/8465 | 8.57e-09 | 1.48e-07 | 1.11e-07 | 36 |
| hsa0452030 | Esophagus | ESCC | Adherens junction | 69/4205 | 93/8465 | 1.08e-06 | 6.83e-06 | 3.50e-06 | 69 |
| hsa04520114 | Esophagus | ESCC | Adherens junction | 69/4205 | 93/8465 | 1.08e-06 | 6.83e-06 | 3.50e-06 | 69 |
| hsa0452014 | Liver | NAFLD | Adherens junction | 37/1043 | 93/8465 | 1.50e-11 | 1.64e-09 | 1.32e-09 | 37 |
| hsa0452015 | Liver | NAFLD | Adherens junction | 37/1043 | 93/8465 | 1.50e-11 | 1.64e-09 | 1.32e-09 | 37 |
| Page: 1 2 |
Top |
Cell-cell communication analysis |
| Identification of potential cell-cell interactions between two cell types and their ligand-receptor pairs for different disease states |
| Ligand | Receptor | LRpair | Pathway | Tissue | Disease Stage |
| Page: 1 |
Top |
Single-cell gene regulatory network inference analysis |
| Find out the significant the regulons (TFs) and the target genes of each regulon across cell types for different disease states |
| TF | Cell Type | Tissue | Disease Stage | Target Gene | RSS | Regulon Activity |
| ∗The dot plots of a searched regulon are shown for all cell subpopulations in each disease state of each tissue based on the regulon specific score inferred using pySCENIC and by calculating the average expression. |
| Page: 1 |
Top |
Somatic mutation of malignant transformation related genes |
| Annotation of somatic variants for genes involved in malignant transformation |
| Hugo Symbol | Variant Class | Variant Classification | dbSNP RS | HGVSc | HGVSp | HGVSp Short | SWISSPROT | BIOTYPE | SIFT | PolyPhen | Tumor Sample Barcode | Tissue | Histology | Sex | Age | Stage | Therapy Types | Drugs | Outcome |
| FER | SNV | Missense_Mutation | rs763459582 | c.556G>A | p.Val186Ile | p.V186I | P16591 | protein_coding | deleterious(0.05) | probably_damaging(0.97) | TCGA-AN-A0AK-01 | Breast | breast invasive carcinoma | Female | >=65 | I/II | Unknown | Unknown | SD |
| FER | SNV | Missense_Mutation | c.2126N>G | p.Glu709Gly | p.E709G | P16591 | protein_coding | deleterious(0.02) | probably_damaging(0.996) | TCGA-AR-A256-01 | Breast | breast invasive carcinoma | Female | <65 | I/II | Chemotherapy | doxorubicin | PD | |
| FER | SNV | Missense_Mutation | rs533871351 | c.362N>C | p.Ile121Thr | p.I121T | P16591 | protein_coding | deleterious(0.02) | benign(0.046) | TCGA-BH-A18V-01 | Breast | breast invasive carcinoma | Female | <65 | I/II | Unknown | Unknown | SD |
| FER | SNV | Missense_Mutation | novel | c.1598N>A | p.Thr533Lys | p.T533K | P16591 | protein_coding | tolerated(0.97) | benign(0.045) | TCGA-BH-A42T-01 | Breast | breast invasive carcinoma | Female | >=65 | I/II | Unknown | Unknown | SD |
| FER | SNV | Missense_Mutation | c.281N>G | p.Ser94Cys | p.S94C | P16591 | protein_coding | deleterious(0.01) | possibly_damaging(0.554) | TCGA-D8-A27G-01 | Breast | breast invasive carcinoma | Female | >=65 | I/II | Unknown | Unknown | SD | |
| FER | SNV | Missense_Mutation | novel | c.1484N>A | p.Ser495Tyr | p.S495Y | P16591 | protein_coding | deleterious(0) | possibly_damaging(0.722) | TCGA-EW-A6SA-01 | Breast | breast invasive carcinoma | Male | <65 | I/II | Unknown | Unknown | SD |
| FER | SNV | Missense_Mutation | c.2207G>A | p.Arg736Lys | p.R736K | P16591 | protein_coding | tolerated(0.19) | probably_damaging(0.97) | TCGA-GM-A2DH-01 | Breast | breast invasive carcinoma | Female | <65 | I/II | Chemotherapy | taxol | CR | |
| FER | deletion | Frame_Shift_Del | novel | c.1357delN | p.Lys453SerfsTer16 | p.K453Sfs*16 | P16591 | protein_coding | TCGA-EW-A2FV-01 | Breast | breast invasive carcinoma | Female | <65 | III/IV | Chemotherapy | docetaxel | SD | ||
| FER | SNV | Missense_Mutation | novel | c.2332C>T | p.Arg778Trp | p.R778W | P16591 | protein_coding | deleterious(0) | benign(0.267) | TCGA-C5-A902-01 | Cervix | cervical & endocervical cancer | Female | <65 | I/II | Chemotherapy | cisplatin | SD |
| FER | SNV | Missense_Mutation | c.2207N>C | p.Arg736Thr | p.R736T | P16591 | protein_coding | tolerated(0.07) | probably_damaging(0.993) | TCGA-Q1-A73O-01 | Cervix | cervical & endocervical cancer | Female | <65 | I/II | Chemotherapy | cisplatin | CR |
| Page: 1 2 3 4 5 6 7 8 9 10 11 |
Top |
Related drugs of malignant transformation related genes |
| Identification of chemicals and drugs interact with genes involved in malignant transfromation |
| (DGIdb 4.0) |
| Entrez ID | Symbol | Category | Interaction Types | Drug Claim Name | Drug Name | PMIDs |
| 2241 | FER | KINASE, DRUGGABLE GENOME, ENZYME, TYROSINE KINASE | inhibitor | 328083505 | ||
| 2241 | FER | KINASE, DRUGGABLE GENOME, ENZYME, TYROSINE KINASE | ALISERTIB | ALISERTIB | ||
| 2241 | FER | KINASE, DRUGGABLE GENOME, ENZYME, TYROSINE KINASE | inhibitor | 249565817 | ||
| 2241 | FER | KINASE, DRUGGABLE GENOME, ENZYME, TYROSINE KINASE | TAMATINIB | R-406 | ||
| 2241 | FER | KINASE, DRUGGABLE GENOME, ENZYME, TYROSINE KINASE | CENISERTIB | CENISERTIB | ||
| 2241 | FER | KINASE, DRUGGABLE GENOME, ENZYME, TYROSINE KINASE | CYC-116 | CYC-116 | ||
| 2241 | FER | KINASE, DRUGGABLE GENOME, ENZYME, TYROSINE KINASE | LINIFANIB | LINIFANIB | ||
| 2241 | FER | KINASE, DRUGGABLE GENOME, ENZYME, TYROSINE KINASE | ENTRECTINIB | ENTRECTINIB | ||
| 2241 | FER | KINASE, DRUGGABLE GENOME, ENZYME, TYROSINE KINASE | inhibitor | HESPERADIN | HESPERADIN | 19035792 |
| 2241 | FER | KINASE, DRUGGABLE GENOME, ENZYME, TYROSINE KINASE | CEDIRANIB | CEDIRANIB |
| Page: 1 2 |

Copyright 2023-Present -The University of Texas Health Science Center at Houston |