
|
|||||
|
 | |
| |
| |
| |
| |
| |
|
Gene: WNT5A |
Gene summary for WNT5A |
| Gene information | Species | Human | Gene symbol | WNT5A | Gene ID | 7474 |
| Gene name | Wnt family member 5A | |
| Gene Alias | hWNT5A | |
| Cytomap | 3p14.3 | |
| Gene Type | protein-coding | GO ID | GO:0000003 | UniProtAcc | A0A024R316 |
Top |
Malignant transformation analysis |
| Identification of the aberrant gene expression in precancerous and cancerous lesions by comparing the gene expression of stem-like cells in diseased tissues with normal stem cells |
| Entrez ID | Symbol | Replicates | Species | Organ | Tissue | Adj P-value | Log2FC | Malignancy |
| 7474 | WNT5A | LZE4T | Human | Esophagus | ESCC | 1.47e-05 | 2.62e-01 | 0.0811 |
| 7474 | WNT5A | P4T-E | Human | Esophagus | ESCC | 1.29e-08 | 3.40e-01 | 0.1323 |
| 7474 | WNT5A | P8T-E | Human | Esophagus | ESCC | 9.35e-12 | 2.41e-01 | 0.0889 |
| 7474 | WNT5A | P9T-E | Human | Esophagus | ESCC | 7.73e-07 | 2.00e-01 | 0.1131 |
| 7474 | WNT5A | P10T-E | Human | Esophagus | ESCC | 7.80e-11 | 2.40e-01 | 0.116 |
| 7474 | WNT5A | P12T-E | Human | Esophagus | ESCC | 2.33e-33 | 6.94e-01 | 0.1122 |
| 7474 | WNT5A | P15T-E | Human | Esophagus | ESCC | 6.29e-13 | 3.25e-01 | 0.1149 |
| 7474 | WNT5A | P22T-E | Human | Esophagus | ESCC | 6.11e-04 | 1.56e-01 | 0.1236 |
| 7474 | WNT5A | P23T-E | Human | Esophagus | ESCC | 5.15e-05 | 3.79e-01 | 0.108 |
| 7474 | WNT5A | P24T-E | Human | Esophagus | ESCC | 7.66e-05 | 2.02e-01 | 0.1287 |
| 7474 | WNT5A | P26T-E | Human | Esophagus | ESCC | 1.93e-16 | 3.97e-01 | 0.1276 |
| 7474 | WNT5A | P27T-E | Human | Esophagus | ESCC | 6.39e-18 | 3.45e-01 | 0.1055 |
| 7474 | WNT5A | P28T-E | Human | Esophagus | ESCC | 4.38e-05 | 7.38e-02 | 0.1149 |
| 7474 | WNT5A | P30T-E | Human | Esophagus | ESCC | 3.26e-21 | 9.54e-01 | 0.137 |
| 7474 | WNT5A | P32T-E | Human | Esophagus | ESCC | 9.60e-09 | 2.51e-01 | 0.1666 |
| 7474 | WNT5A | P36T-E | Human | Esophagus | ESCC | 4.78e-07 | 3.85e-01 | 0.1187 |
| 7474 | WNT5A | P39T-E | Human | Esophagus | ESCC | 2.79e-12 | 2.82e-01 | 0.0894 |
| 7474 | WNT5A | P42T-E | Human | Esophagus | ESCC | 4.51e-07 | 4.71e-01 | 0.1175 |
| 7474 | WNT5A | P47T-E | Human | Esophagus | ESCC | 1.69e-02 | 2.39e-01 | 0.1067 |
| 7474 | WNT5A | P48T-E | Human | Esophagus | ESCC | 6.01e-11 | 2.86e-01 | 0.0959 |
| Page: 1 2 3 |
| Tissue | Expression Dynamics | Abbreviation |
| Esophagus | 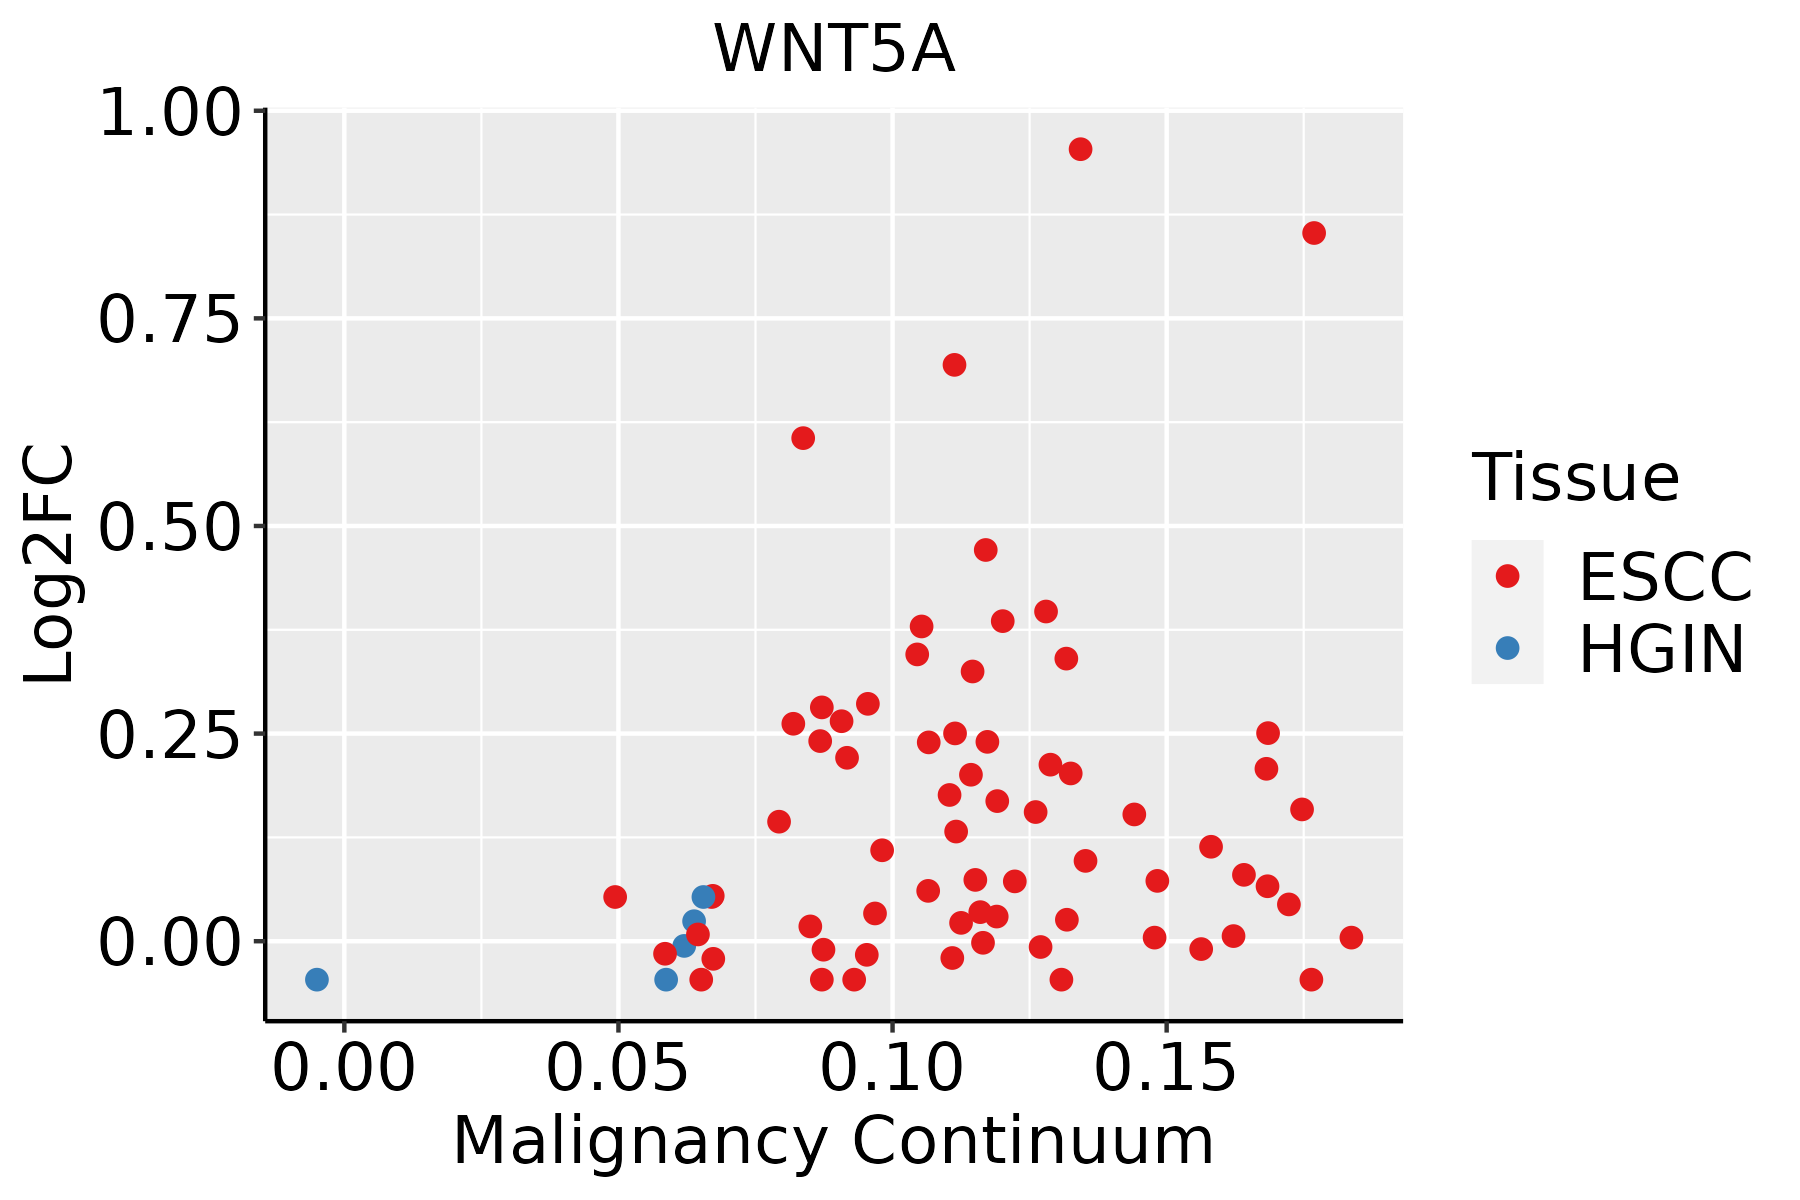 | ESCC: Esophageal squamous cell carcinoma |
| HGIN: High-grade intraepithelial neoplasias | ||
| LGIN: Low-grade intraepithelial neoplasias | ||
| Thyroid | 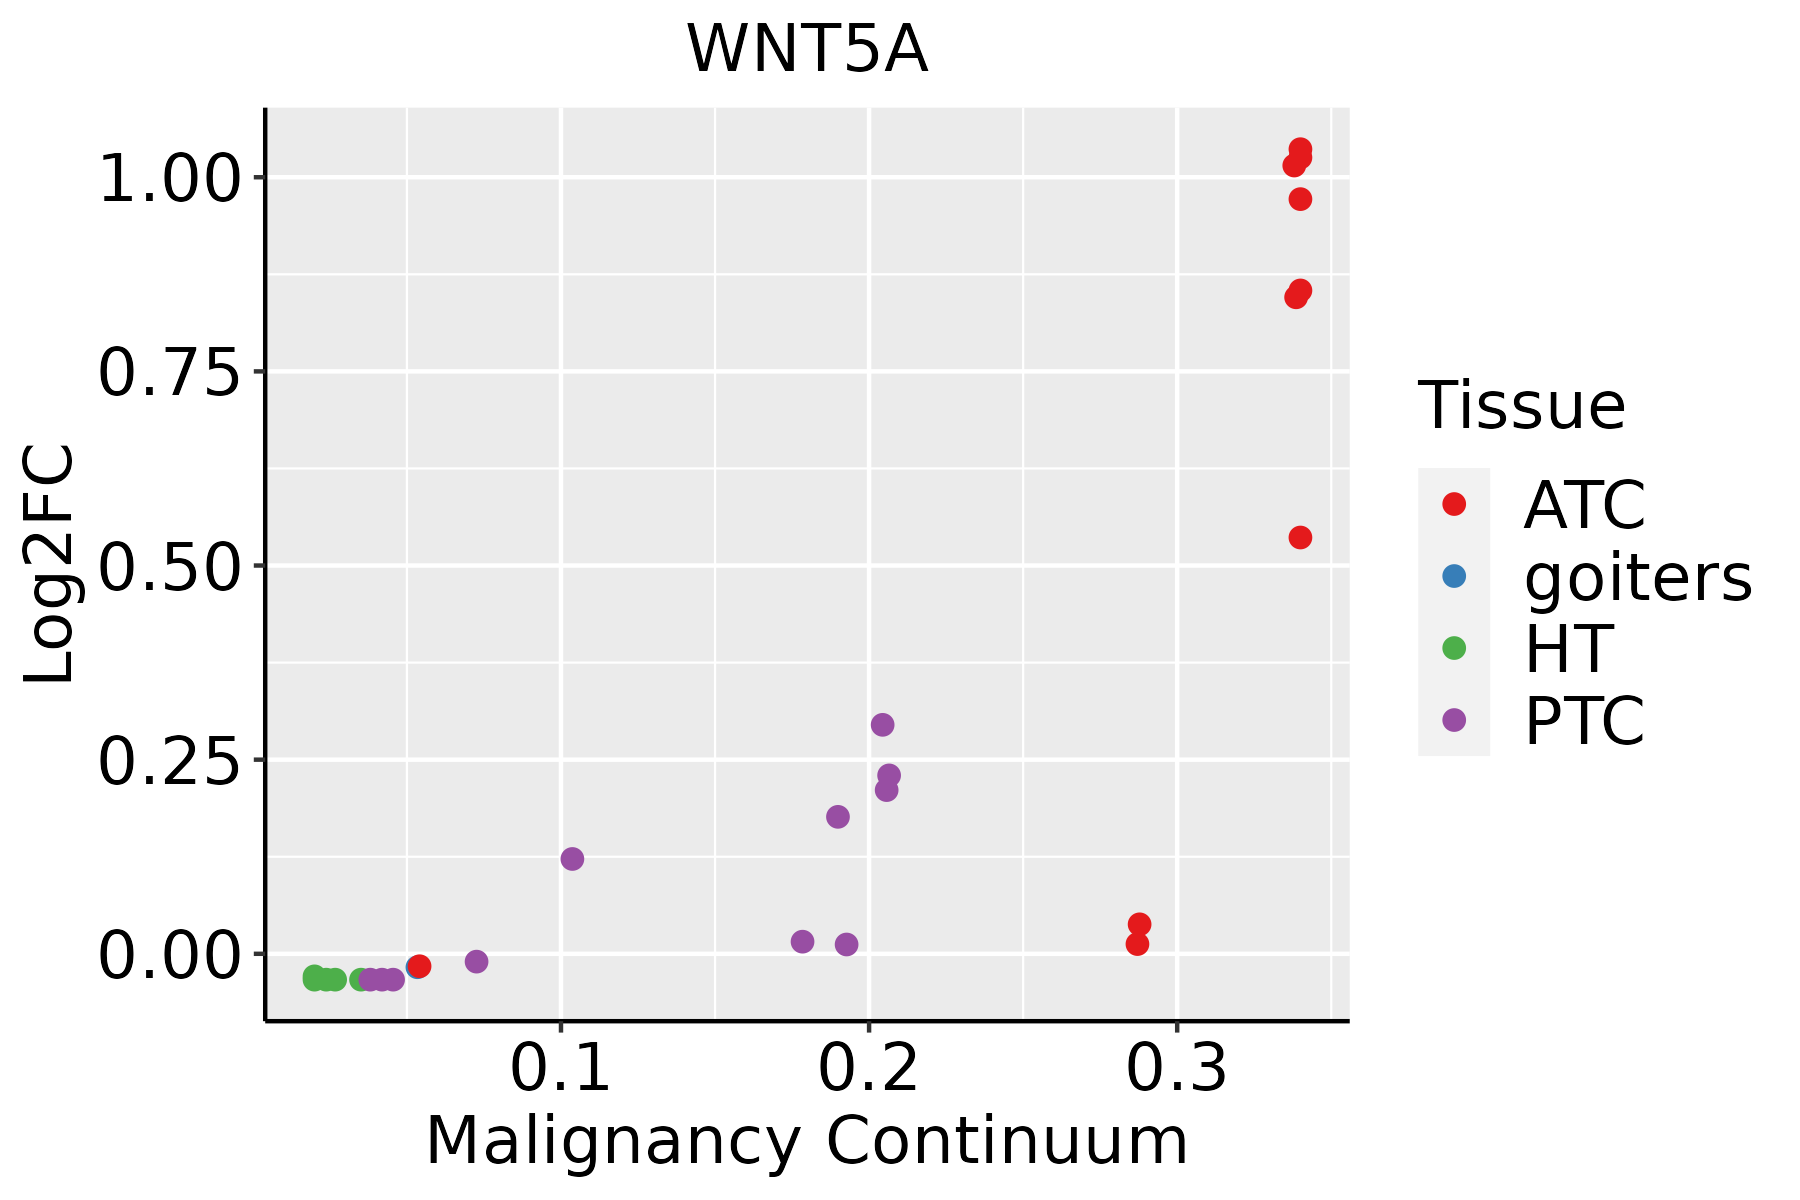 | ATC: Anaplastic thyroid cancer |
| HT: Hashimoto's thyroiditis | ||
| PTC: Papillary thyroid cancer |
| ∗log2FC in expression of this searched gene in stem-like cells from each diseased tissue sample relative to stem-like cells in normal samples in each tissue plotted against the malignancy continuum. Samples are colored based on if they are from different disease stage. |
Top |
Malignant transformation related pathway analysis |
| Find out the enriched GO biological processes and KEGG pathways involved in transition from healthy to precancer to cancer |
| Tissue | Disease Stage | Enriched GO biological Processes |
| Colorectum | AD |  |
| Colorectum | SER |  |
| Colorectum | MSS |  |
| Colorectum | MSI-H |  |
| Colorectum | FAP |  |
| ∗Top 15 enriched GO BP terms are showed in the bar plot of each disease state in each tissue. Each row represents a significant GO biological process which is colored according to the -log10(p.adjust). |
| Page: 1 2 3 4 5 6 7 8 9 |
| GO ID | Tissue | Disease Stage | Description | Gene Ratio | Bg Ratio | pvalue | p.adjust | Count |
| GO:0031346110 | Thyroid | PTC | positive regulation of cell projection organization | 173/5968 | 353/18723 | 1.09e-11 | 4.40e-10 | 173 |
| GO:007155919 | Thyroid | PTC | response to transforming growth factor beta | 131/5968 | 256/18723 | 9.20e-11 | 3.17e-09 | 131 |
| GO:0007163111 | Thyroid | PTC | establishment or maintenance of cell polarity | 115/5968 | 218/18723 | 1.15e-10 | 3.90e-09 | 115 |
| GO:0032535112 | Thyroid | PTC | regulation of cellular component size | 181/5968 | 383/18723 | 1.70e-10 | 5.64e-09 | 181 |
| GO:0070997113 | Thyroid | PTC | neuron death | 171/5968 | 361/18723 | 4.32e-10 | 1.38e-08 | 171 |
| GO:007156019 | Thyroid | PTC | cellular response to transforming growth factor beta stimulus | 126/5968 | 250/18723 | 7.34e-10 | 2.19e-08 | 126 |
| GO:0043393111 | Thyroid | PTC | regulation of protein binding | 103/5968 | 196/18723 | 1.39e-09 | 3.96e-08 | 103 |
| GO:003010020 | Thyroid | PTC | regulation of endocytosis | 108/5968 | 211/18723 | 3.92e-09 | 1.04e-07 | 108 |
| GO:0001558111 | Thyroid | PTC | regulation of cell growth | 188/5968 | 414/18723 | 4.13e-09 | 1.09e-07 | 188 |
| GO:1901214113 | Thyroid | PTC | regulation of neuron death | 151/5968 | 319/18723 | 4.74e-09 | 1.24e-07 | 151 |
| GO:0042060112 | Thyroid | PTC | wound healing | 190/5968 | 422/18723 | 7.72e-09 | 1.92e-07 | 190 |
| GO:0045860111 | Thyroid | PTC | positive regulation of protein kinase activity | 176/5968 | 386/18723 | 8.89e-09 | 2.17e-07 | 176 |
| GO:1901216113 | Thyroid | PTC | positive regulation of neuron death | 58/5968 | 97/18723 | 1.32e-08 | 3.11e-07 | 58 |
| GO:0060828110 | Thyroid | PTC | regulation of canonical Wnt signaling pathway | 123/5968 | 253/18723 | 1.83e-08 | 4.26e-07 | 123 |
| GO:0071900110 | Thyroid | PTC | regulation of protein serine/threonine kinase activity | 164/5968 | 359/18723 | 2.41e-08 | 5.43e-07 | 164 |
| GO:0048732113 | Thyroid | PTC | gland development | 193/5968 | 436/18723 | 2.88e-08 | 6.42e-07 | 193 |
| GO:0060070110 | Thyroid | PTC | canonical Wnt signaling pathway | 141/5968 | 303/18723 | 5.71e-08 | 1.21e-06 | 141 |
| GO:004580720 | Thyroid | PTC | positive regulation of endocytosis | 58/5968 | 100/18723 | 6.11e-08 | 1.28e-06 | 58 |
| GO:0032092110 | Thyroid | PTC | positive regulation of protein binding | 51/5968 | 85/18723 | 8.36e-08 | 1.70e-06 | 51 |
| GO:004578718 | Thyroid | PTC | positive regulation of cell cycle | 144/5968 | 313/18723 | 9.93e-08 | 1.99e-06 | 144 |
| Page: 1 2 3 4 5 6 7 8 9 10 11 12 13 14 15 16 17 18 19 20 21 22 23 24 25 26 27 28 29 30 31 |
| Pathway ID | Tissue | Disease Stage | Description | Gene Ratio | Bg Ratio | pvalue | p.adjust | qvalue | Count |
| hsa05022210 | Esophagus | ESCC | Pathways of neurodegeneration - multiple diseases | 318/4205 | 476/8465 | 6.10e-15 | 2.04e-13 | 1.05e-13 | 318 |
| hsa05010210 | Esophagus | ESCC | Alzheimer disease | 263/4205 | 384/8465 | 1.80e-14 | 5.47e-13 | 2.80e-13 | 263 |
| hsa0516510 | Esophagus | ESCC | Human papillomavirus infection | 215/4205 | 331/8465 | 7.86e-09 | 7.12e-08 | 3.65e-08 | 215 |
| hsa0520529 | Esophagus | ESCC | Proteoglycans in cancer | 138/4205 | 205/8465 | 1.79e-07 | 1.40e-06 | 7.15e-07 | 138 |
| hsa0522518 | Esophagus | ESCC | Hepatocellular carcinoma | 109/4205 | 168/8465 | 4.27e-05 | 1.88e-04 | 9.64e-05 | 109 |
| hsa041505 | Esophagus | ESCC | mTOR signaling pathway | 98/4205 | 156/8465 | 5.81e-04 | 1.95e-03 | 9.97e-04 | 98 |
| hsa0436016 | Esophagus | ESCC | Axon guidance | 108/4205 | 182/8465 | 5.13e-03 | 1.30e-02 | 6.67e-03 | 108 |
| hsa0439018 | Esophagus | ESCC | Hippo signaling pathway | 92/4205 | 157/8465 | 1.46e-02 | 3.31e-02 | 1.69e-02 | 92 |
| hsa0502238 | Esophagus | ESCC | Pathways of neurodegeneration - multiple diseases | 318/4205 | 476/8465 | 6.10e-15 | 2.04e-13 | 1.05e-13 | 318 |
| hsa0501038 | Esophagus | ESCC | Alzheimer disease | 263/4205 | 384/8465 | 1.80e-14 | 5.47e-13 | 2.80e-13 | 263 |
| hsa0516515 | Esophagus | ESCC | Human papillomavirus infection | 215/4205 | 331/8465 | 7.86e-09 | 7.12e-08 | 3.65e-08 | 215 |
| hsa0520537 | Esophagus | ESCC | Proteoglycans in cancer | 138/4205 | 205/8465 | 1.79e-07 | 1.40e-06 | 7.15e-07 | 138 |
| hsa0522519 | Esophagus | ESCC | Hepatocellular carcinoma | 109/4205 | 168/8465 | 4.27e-05 | 1.88e-04 | 9.64e-05 | 109 |
| hsa0415013 | Esophagus | ESCC | mTOR signaling pathway | 98/4205 | 156/8465 | 5.81e-04 | 1.95e-03 | 9.97e-04 | 98 |
| hsa0436017 | Esophagus | ESCC | Axon guidance | 108/4205 | 182/8465 | 5.13e-03 | 1.30e-02 | 6.67e-03 | 108 |
| hsa0439019 | Esophagus | ESCC | Hippo signaling pathway | 92/4205 | 157/8465 | 1.46e-02 | 3.31e-02 | 1.69e-02 | 92 |
| Page: 1 |
Top |
Cell-cell communication analysis |
| Identification of potential cell-cell interactions between two cell types and their ligand-receptor pairs for different disease states |
| Ligand | Receptor | LRpair | Pathway | Tissue | Disease Stage |
| WNT5A | FZD1 | WNT5A_FZD1 | ncWNT | Cervix | ADJ |
| WNT5A | FZD4 | WNT5A_FZD4 | ncWNT | Cervix | ADJ |
| WNT5A | FZD6 | WNT5A_FZD6 | ncWNT | Cervix | ADJ |
| WNT5A | FZD7 | WNT5A_FZD7 | ncWNT | Cervix | ADJ |
| WNT5A | MCAM | WNT5A_MCAM | ncWNT | Cervix | ADJ |
| WNT5A | FZD4 | WNT5A_FZD4 | ncWNT | Cervix | CC |
| WNT5A | FZD6 | WNT5A_FZD6 | ncWNT | Cervix | CC |
| WNT5A | MCAM | WNT5A_MCAM | ncWNT | Cervix | CC |
| WNT5A | MCAM | WNT5A_MCAM | ncWNT | Cervix | Precancer |
| WNT5A | FZD4 | WNT5A_FZD4 | ncWNT | Endometrium | ADJ |
| WNT5A | FZD6 | WNT5A_FZD6 | ncWNT | Endometrium | ADJ |
| WNT5A | MCAM | WNT5A_MCAM | ncWNT | Endometrium | ADJ |
| WNT5A | FZD4 | WNT5A_FZD4 | ncWNT | Endometrium | AEH |
| WNT5A | FZD7 | WNT5A_FZD7 | ncWNT | Endometrium | AEH |
| WNT5A | MCAM | WNT5A_MCAM | ncWNT | Endometrium | AEH |
| WNT5A | MCAM | WNT5A_MCAM | ncWNT | Endometrium | Healthy |
| WNT5A | FZD1 | WNT5A_FZD1 | ncWNT | Esophagus | ESCC |
| WNT5A | FZD10 | WNT5A_FZD10 | ncWNT | Esophagus | ESCC |
| WNT5A | FZD3 | WNT5A_FZD3 | ncWNT | Esophagus | ESCC |
| WNT5A | FZD4 | WNT5A_FZD4 | ncWNT | Esophagus | ESCC |
| Page: 1 2 3 |
Top |
Single-cell gene regulatory network inference analysis |
| Find out the significant the regulons (TFs) and the target genes of each regulon across cell types for different disease states |
| TF | Cell Type | Tissue | Disease Stage | Target Gene | RSS | Regulon Activity |
| ∗The dot plots of a searched regulon are shown for all cell subpopulations in each disease state of each tissue based on the regulon specific score inferred using pySCENIC and by calculating the average expression. |
| Page: 1 |
Top |
Somatic mutation of malignant transformation related genes |
| Annotation of somatic variants for genes involved in malignant transformation |
| Hugo Symbol | Variant Class | Variant Classification | dbSNP RS | HGVSc | HGVSp | HGVSp Short | SWISSPROT | BIOTYPE | SIFT | PolyPhen | Tumor Sample Barcode | Tissue | Histology | Sex | Age | Stage | Therapy Types | Drugs | Outcome |
| WNT5A | SNV | Missense_Mutation | rs369954366 | c.830G>A | p.Arg277Gln | p.R277Q | P41221 | protein_coding | tolerated(0.05) | possibly_damaging(0.65) | TCGA-2W-A8YY-01 | Cervix | cervical & endocervical cancer | Female | <65 | I/II | Chemotherapy | cisplatin | CR |
| WNT5A | SNV | Missense_Mutation | novel | c.947N>A | p.Gly316Asp | p.G316D | P41221 | protein_coding | deleterious(0) | probably_damaging(1) | TCGA-C5-A1M6-01 | Cervix | cervical & endocervical cancer | Female | <65 | I/II | Chemotherapy | cisplatin | PD |
| WNT5A | SNV | Missense_Mutation | rs755298573 | c.1055N>T | p.Thr352Met | p.T352M | P41221 | protein_coding | tolerated(0.09) | possibly_damaging(0.502) | TCGA-UC-A7PI-01 | Cervix | cervical & endocervical cancer | Female | <65 | I/II | Unknown | Unknown | PD |
| WNT5A | SNV | Missense_Mutation | c.758G>T | p.Trp253Leu | p.W253L | P41221 | protein_coding | deleterious(0) | probably_damaging(1) | TCGA-AA-3489-01 | Colorectum | colon adenocarcinoma | Male | >=65 | I/II | Unknown | Unknown | PD | |
| WNT5A | SNV | Missense_Mutation | c.442N>T | p.Asn148Tyr | p.N148Y | P41221 | protein_coding | tolerated(1) | possibly_damaging(0.629) | TCGA-AA-3492-01 | Colorectum | colon adenocarcinoma | Female | >=65 | I/II | Unknown | Unknown | SD | |
| WNT5A | SNV | Missense_Mutation | rs201975128 | c.983N>T | p.Thr328Met | p.T328M | P41221 | protein_coding | deleterious(0.01) | probably_damaging(1) | TCGA-AA-3947-01 | Colorectum | colon adenocarcinoma | Female | <65 | I/II | Unknown | Unknown | SD |
| WNT5A | SNV | Missense_Mutation | c.928N>A | p.Val310Met | p.V310M | P41221 | protein_coding | tolerated(0.13) | benign(0.051) | TCGA-AA-3984-01 | Colorectum | colon adenocarcinoma | Female | <65 | I/II | Unknown | Unknown | SD | |
| WNT5A | SNV | Missense_Mutation | c.306A>C | p.Lys102Asn | p.K102N | P41221 | protein_coding | tolerated(0.1) | possibly_damaging(0.529) | TCGA-AA-A010-01 | Colorectum | colon adenocarcinoma | Female | <65 | I/II | Chemotherapy | folinic | CR | |
| WNT5A | SNV | Missense_Mutation | c.1021N>T | p.Gly341Cys | p.G341C | P41221 | protein_coding | deleterious(0) | probably_damaging(1) | TCGA-AA-A02R-01 | Colorectum | colon adenocarcinoma | Female | >=65 | I/II | Unknown | Unknown | PD | |
| WNT5A | SNV | Missense_Mutation | c.928N>A | p.Val310Met | p.V310M | P41221 | protein_coding | tolerated(0.13) | benign(0.051) | TCGA-AM-5821-01 | Colorectum | colon adenocarcinoma | Female | >=65 | I/II | Unknown | Unknown | SD |
| Page: 1 2 3 4 5 6 |
Top |
Related drugs of malignant transformation related genes |
| Identification of chemicals and drugs interact with genes involved in malignant transfromation |
| (DGIdb 4.0) |
| Entrez ID | Symbol | Category | Interaction Types | Drug Claim Name | Drug Name | PMIDs |
| Page: 1 |

Copyright 2023-Present -The University of Texas Health Science Center at Houston |