| Tissue | Expression Dynamics | Abbreviation |
| Breast | 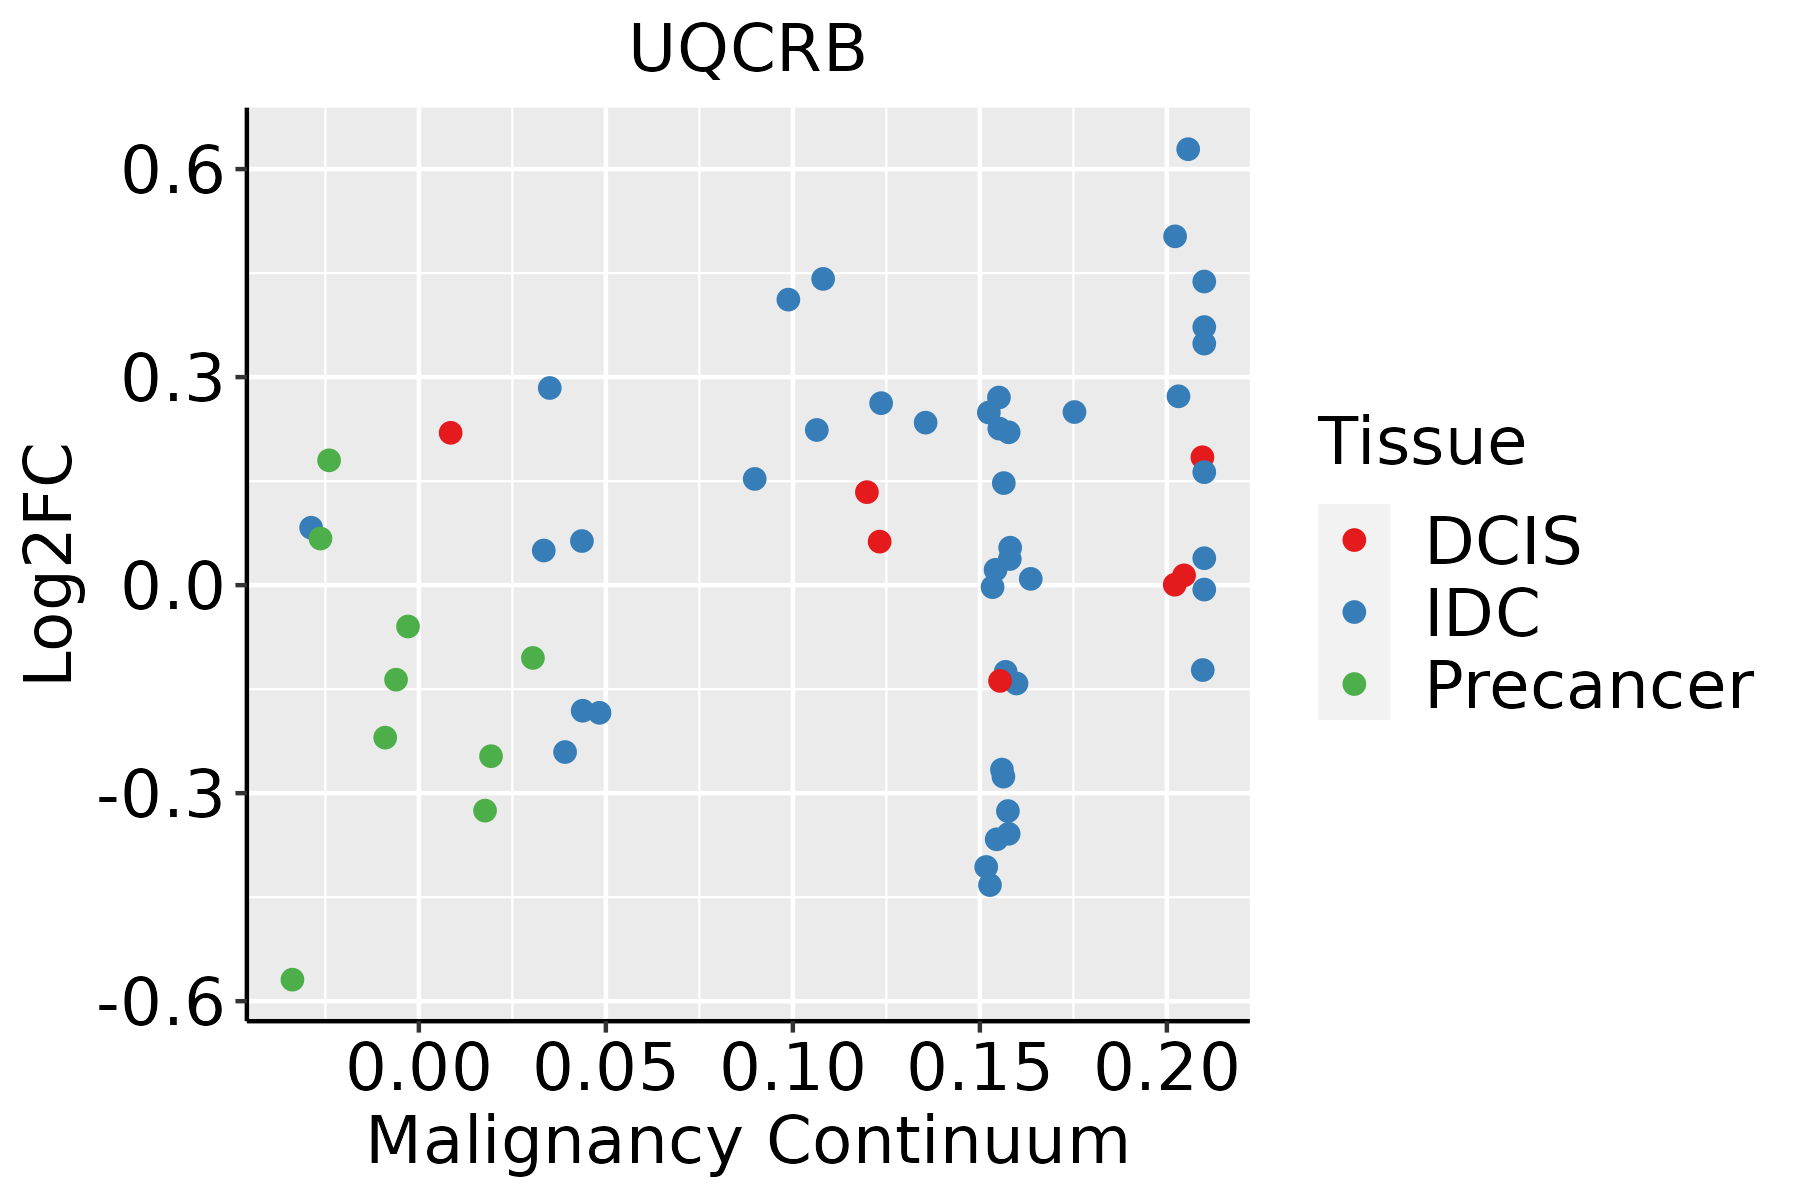 | IDC: Invasive ductal carcinoma |
| DCIS: Ductal carcinoma in situ |
| Precancer(BRCA1-mut): Precancerous lesion from BRCA1 mutation carriers |
| Cervix | 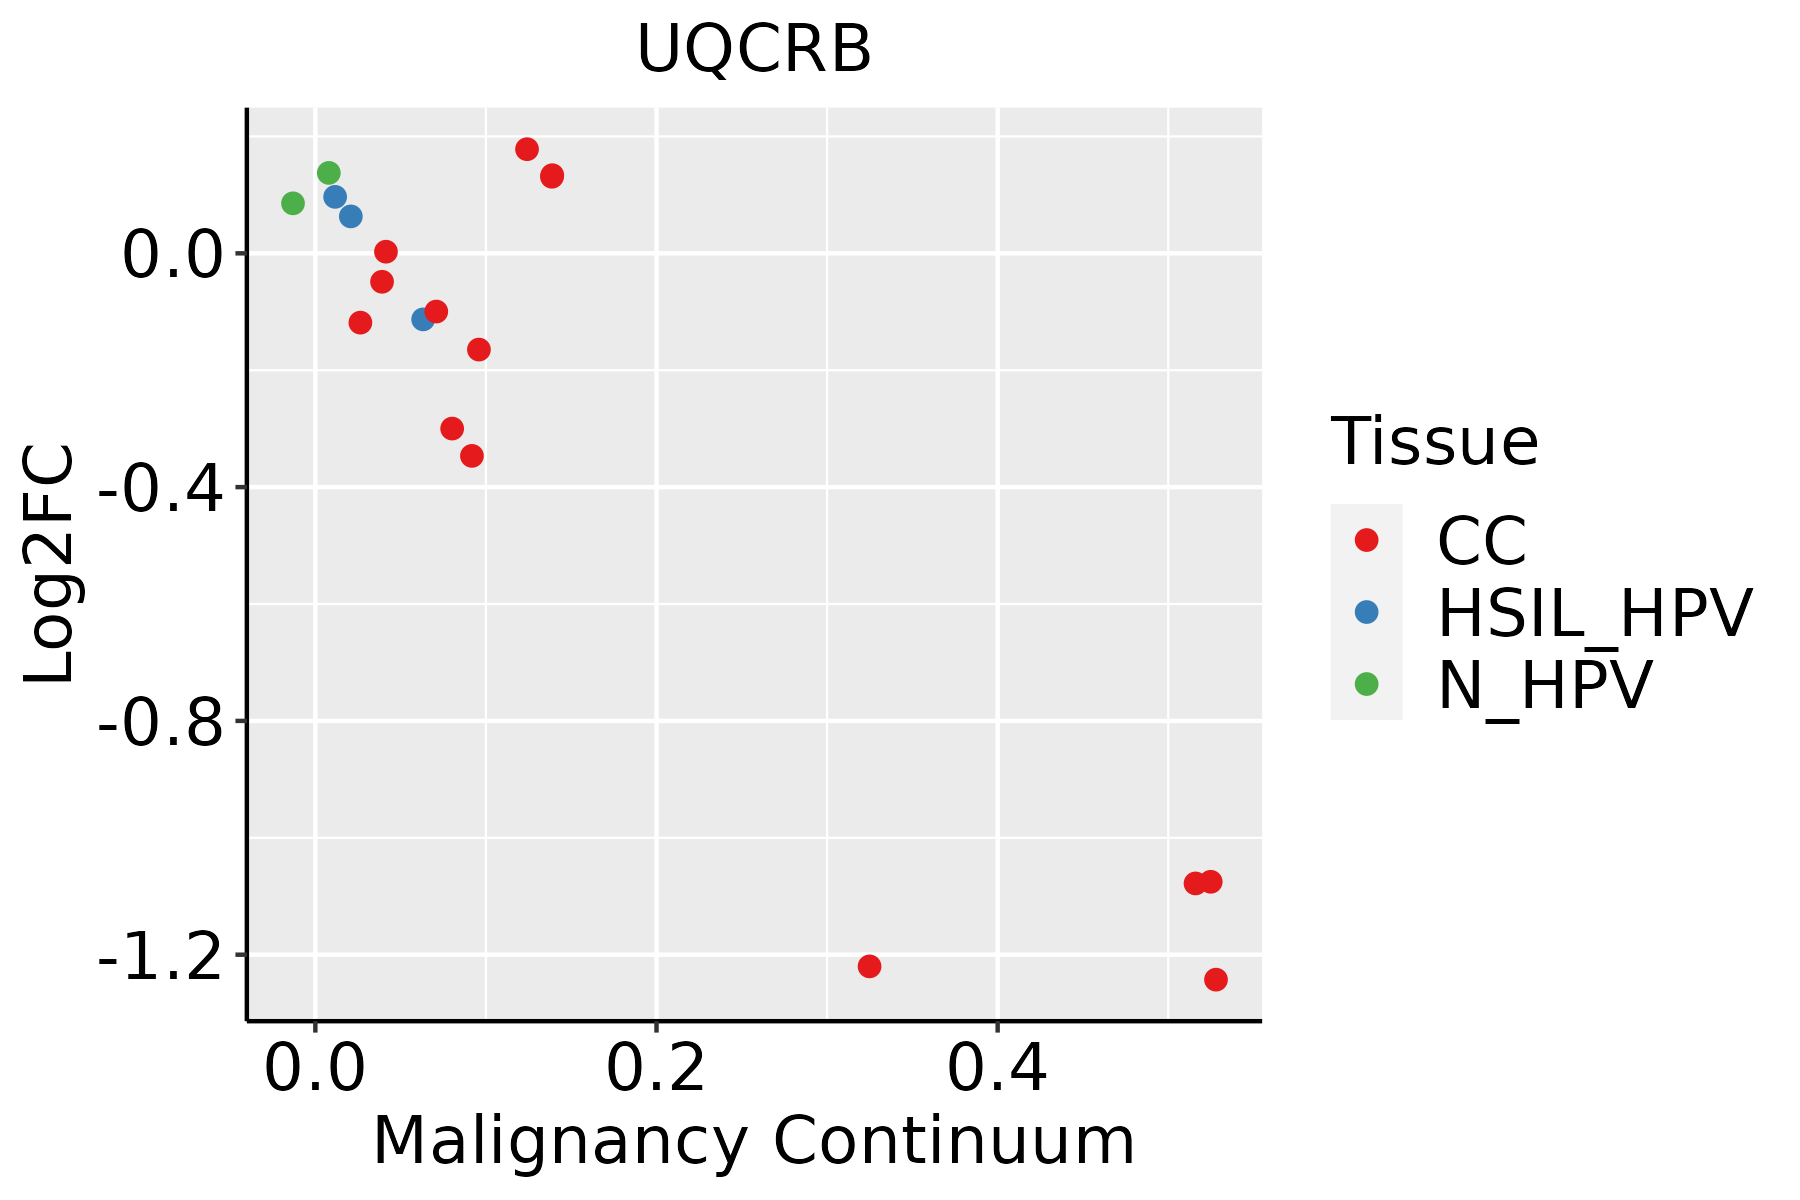 | CC: Cervix cancer |
| HSIL_HPV: HPV-infected high-grade squamous intraepithelial lesions |
| N_HPV: HPV-infected normal cervix |
| Colorectum (GSE201348) |  | FAP: Familial adenomatous polyposis |
| CRC: Colorectal cancer |
| Colorectum (HTA11) |  | AD: Adenomas |
| SER: Sessile serrated lesions |
| MSI-H: Microsatellite-high colorectal cancer |
| MSS: Microsatellite stable colorectal cancer |
| Endometrium | 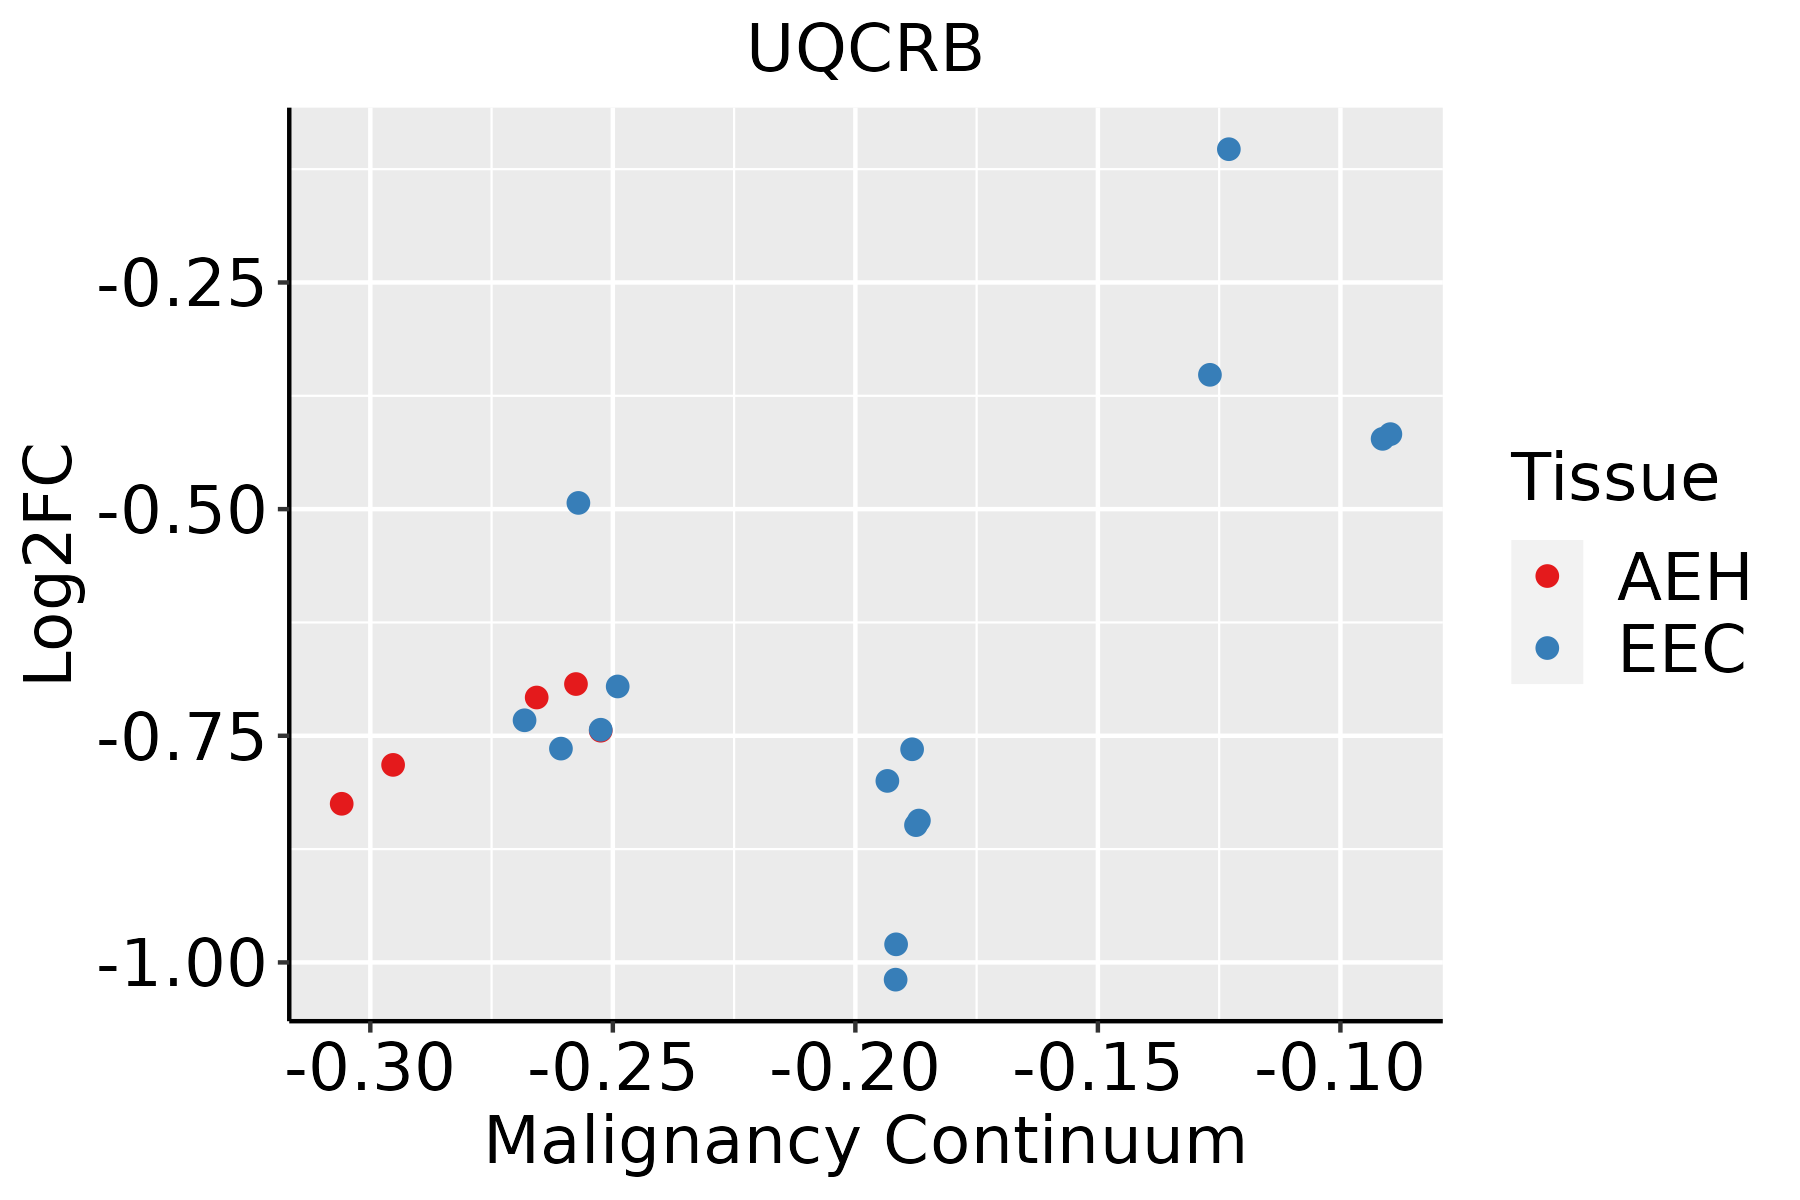 | AEH: Atypical endometrial hyperplasia |
| EEC: Endometrioid Cancer |
| Esophagus | 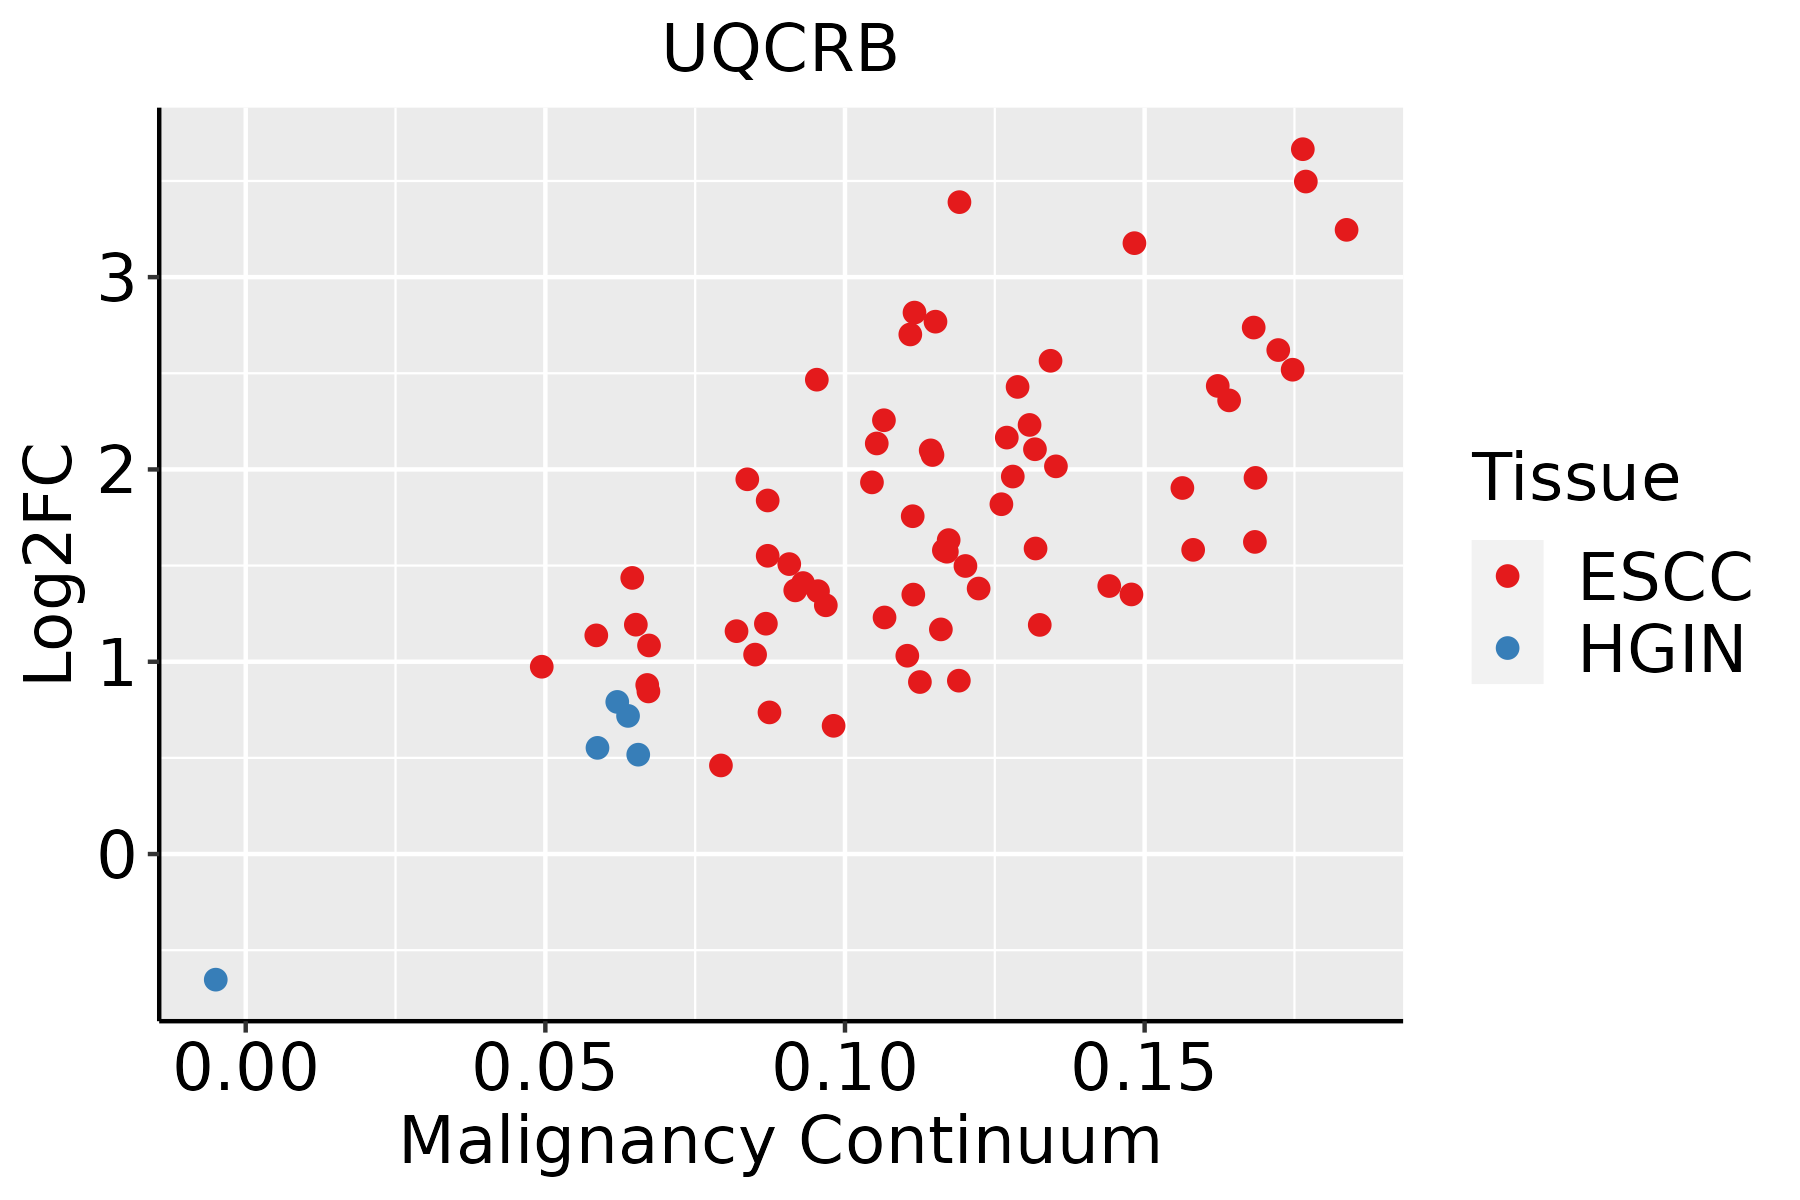 | ESCC: Esophageal squamous cell carcinoma |
| HGIN: High-grade intraepithelial neoplasias |
| LGIN: Low-grade intraepithelial neoplasias |
| GC |  | CAG: Chronic atrophic gastritis |
| CAG with IM: Chronic atrophic gastritis with intestinal metaplasia |
| CSG: Chronic superficial gastritis |
| GC: Gastric cancer |
| SIM: Severe intestinal metaplasia |
| WIM: Wild intestinal metaplasia |
| Liver |  | HCC: Hepatocellular carcinoma |
| NAFLD: Non-alcoholic fatty liver disease |
| Lung |  | AAH: Atypical adenomatous hyperplasia |
| AIS: Adenocarcinoma in situ |
| IAC: Invasive lung adenocarcinoma |
| MIA: Minimally invasive adenocarcinoma |
| Oral Cavity | 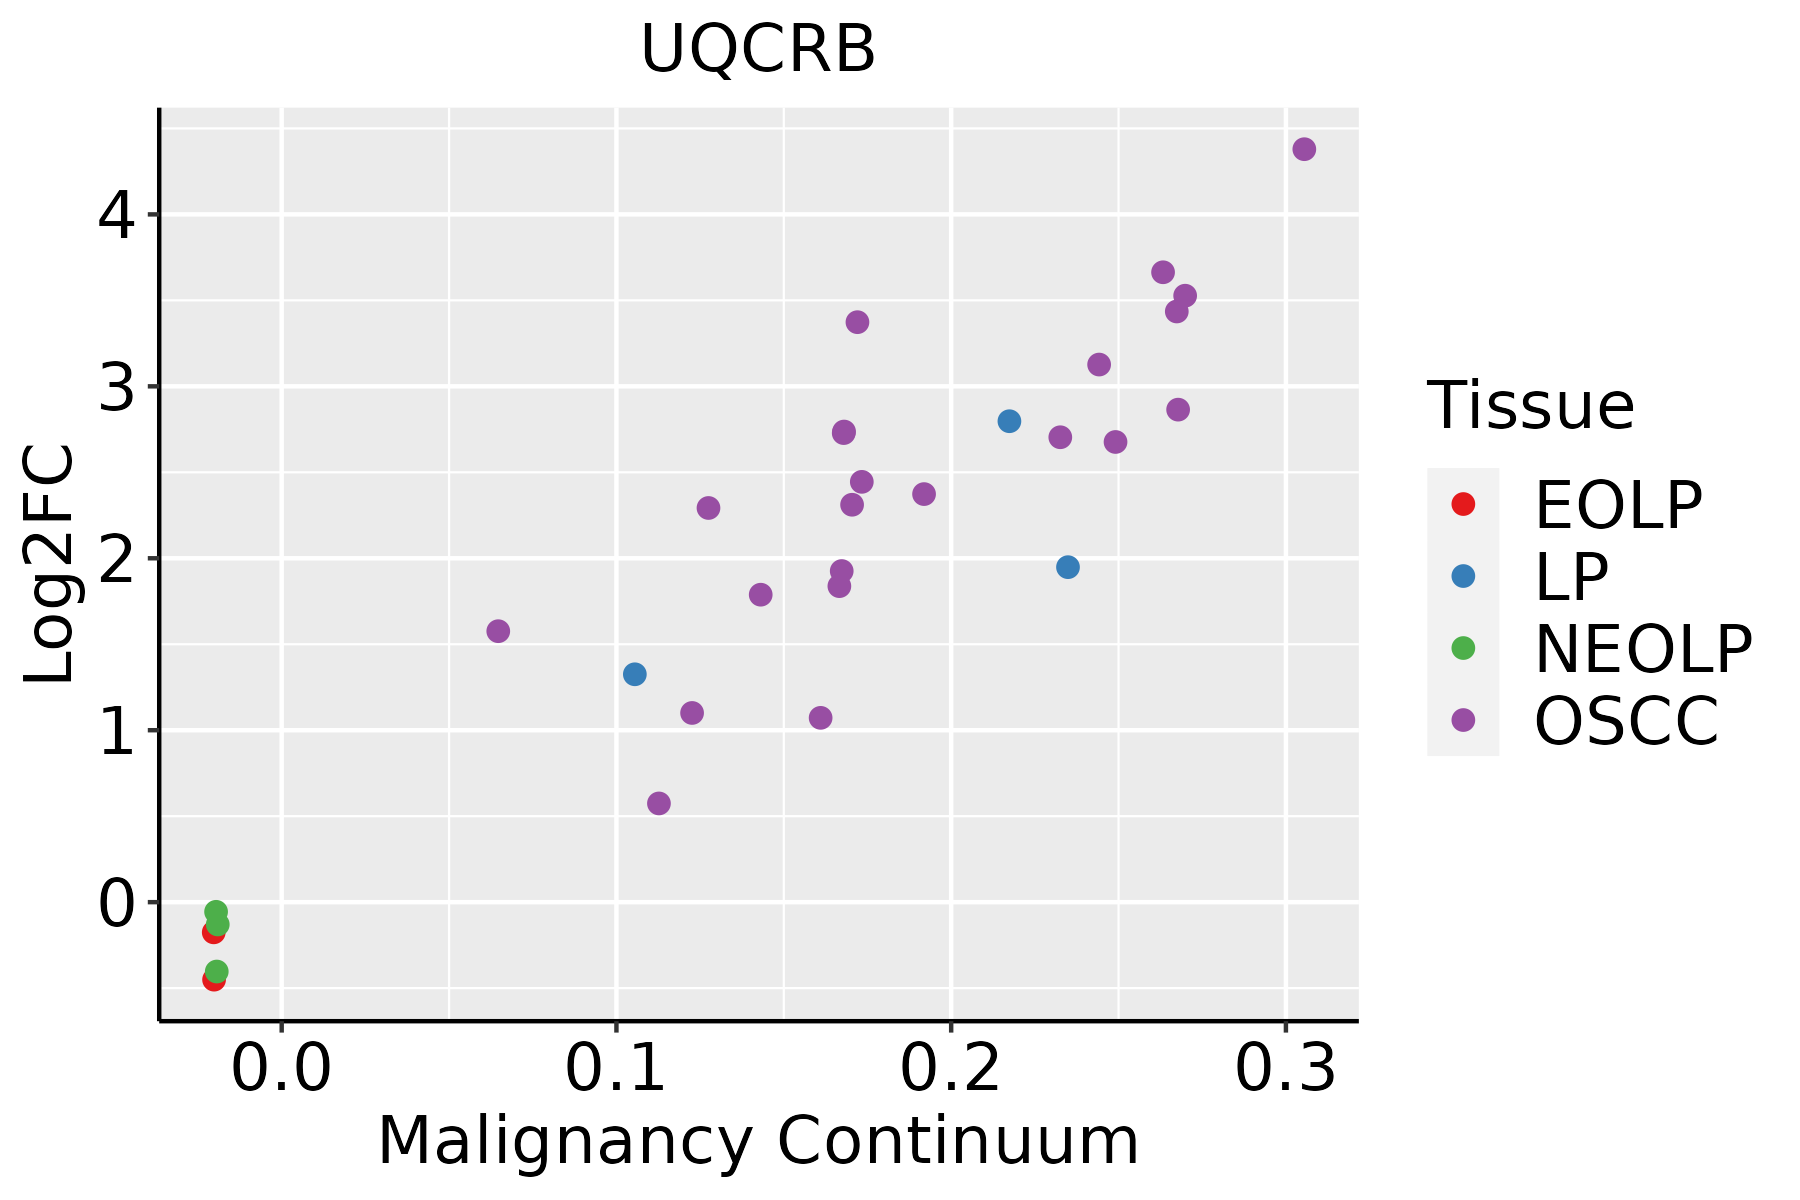 | EOLP: Erosive Oral lichen planus |
| LP: leukoplakia |
| NEOLP: Non-erosive oral lichen planus |
| OSCC: Oral squamous cell carcinoma |
| Prostate | 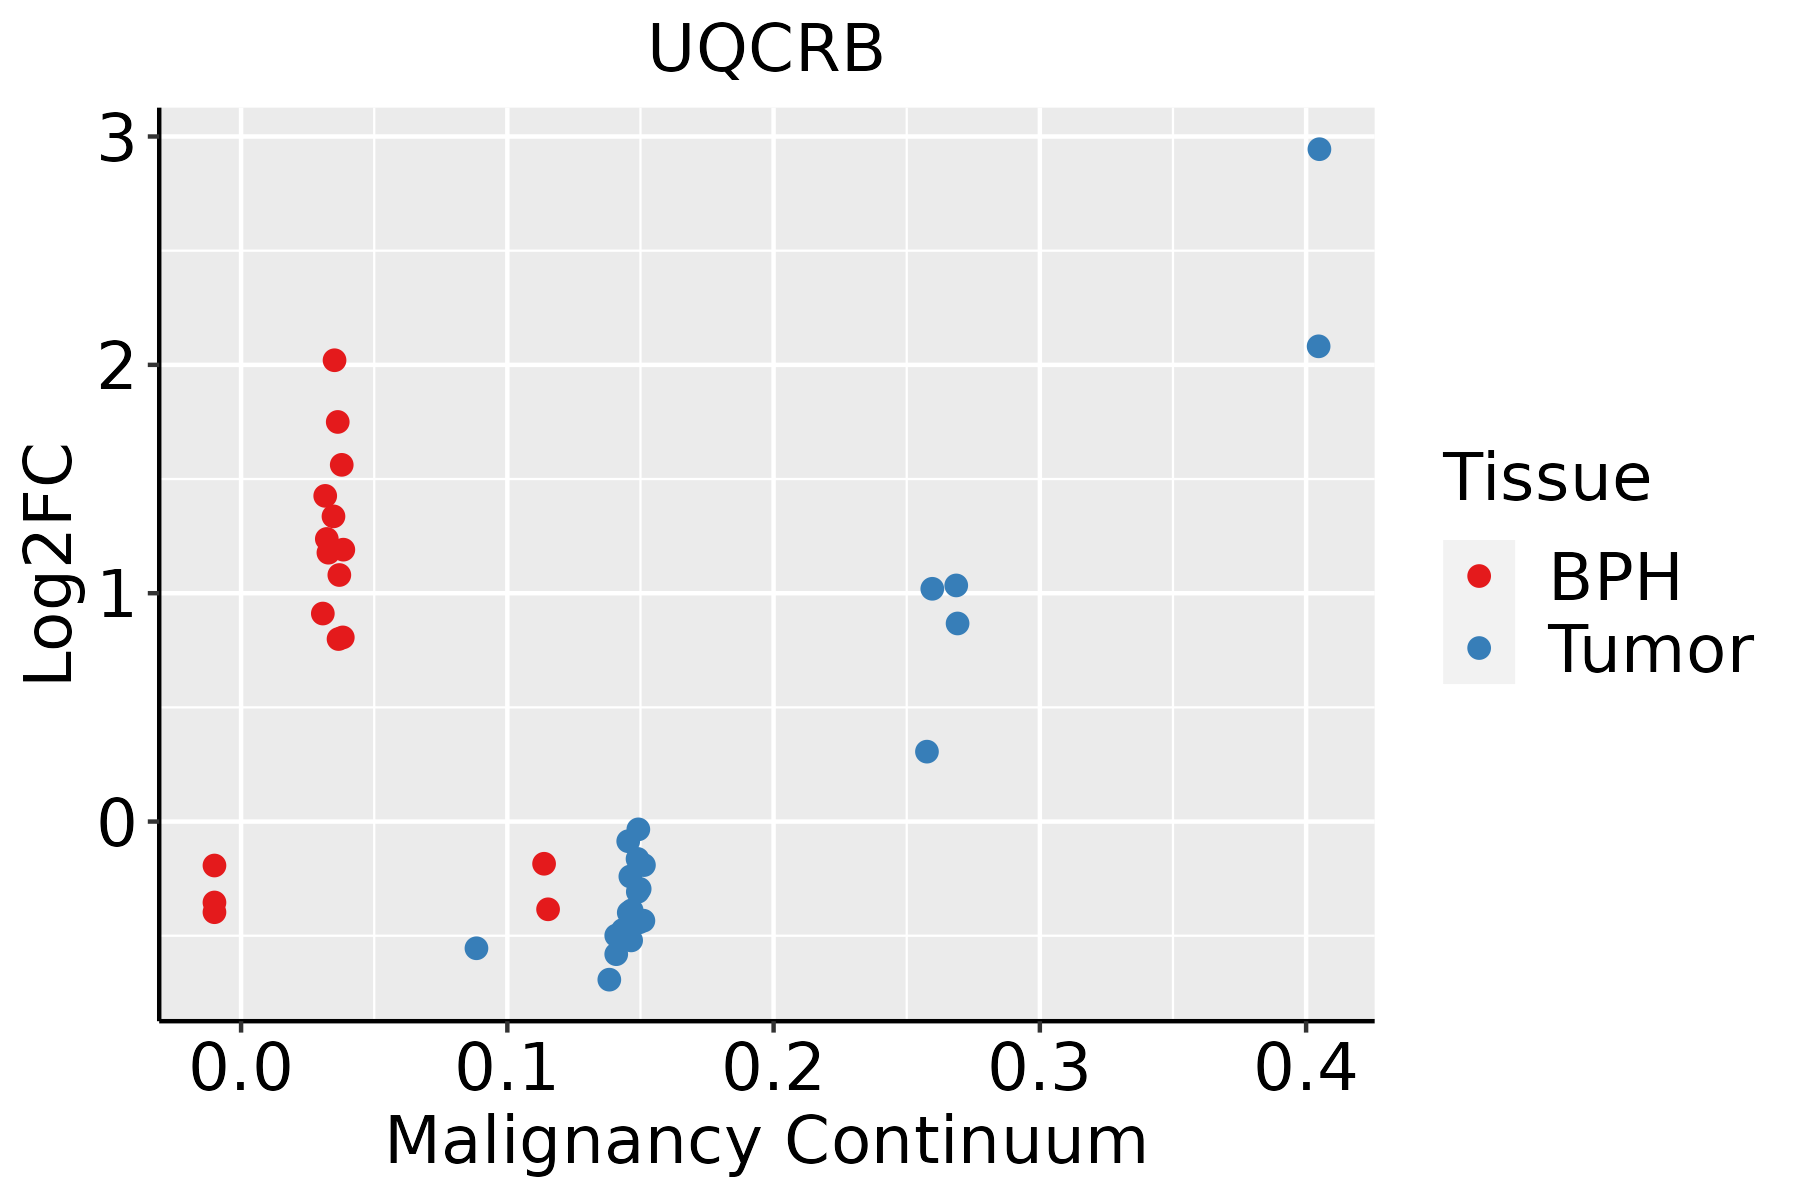 | BPH: Benign Prostatic Hyperplasia |
| Skin | 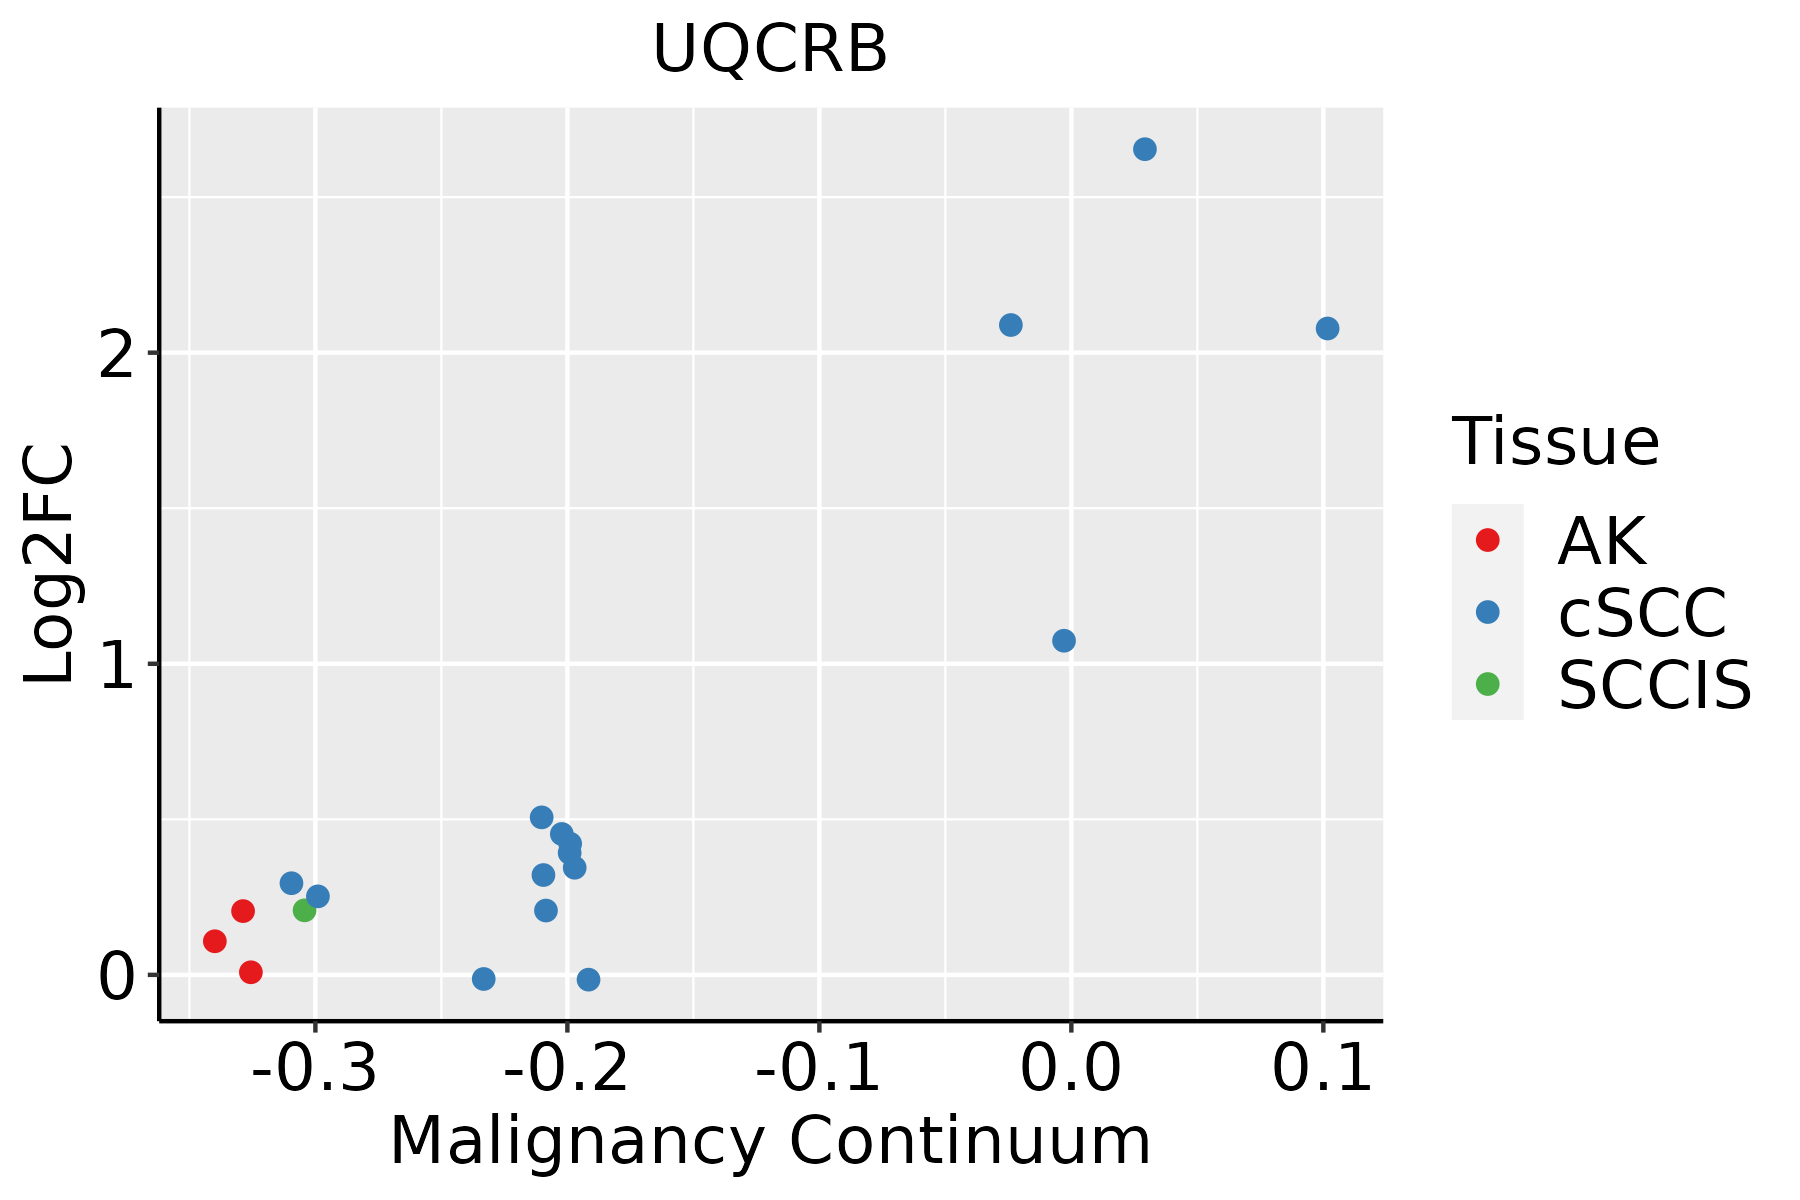 | AK: Actinic keratosis |
| cSCC: Cutaneous squamous cell carcinoma |
| SCCIS:squamous cell carcinoma in situ |
| Thyroid |  | ATC: Anaplastic thyroid cancer |
| HT: Hashimoto's thyroiditis |
| PTC: Papillary thyroid cancer |
| GO ID | Tissue | Disease Stage | Description | Gene Ratio | Bg Ratio | pvalue | p.adjust | Count |
| GO:000609119 | Oral cavity | LP | generation of precursor metabolites and energy | 214/4623 | 490/18723 | 1.12e-20 | 2.60e-18 | 214 |
| GO:002290419 | Oral cavity | LP | respiratory electron transport chain | 75/4623 | 114/18723 | 1.92e-20 | 4.14e-18 | 75 |
| GO:001964619 | Oral cavity | LP | aerobic electron transport chain | 62/4623 | 87/18723 | 7.13e-20 | 1.49e-17 | 62 |
| GO:0006119110 | Oral cavity | LP | oxidative phosphorylation | 81/4623 | 141/18723 | 9.70e-17 | 1.48e-14 | 81 |
| GO:001598019 | Oral cavity | LP | energy derivation by oxidation of organic compounds | 145/4623 | 318/18723 | 2.44e-16 | 3.64e-14 | 145 |
| GO:0046034110 | Oral cavity | LP | ATP metabolic process | 128/4623 | 277/18723 | 3.95e-15 | 5.38e-13 | 128 |
| GO:000612218 | Oral cavity | LP | mitochondrial electron transport, ubiquinol to cytochrome c | 10/4623 | 11/18723 | 7.14e-06 | 1.37e-04 | 10 |
| GO:004603426 | Oral cavity | EOLP | ATP metabolic process | 68/2218 | 277/18723 | 2.72e-09 | 1.71e-07 | 68 |
| GO:001964625 | Oral cavity | EOLP | aerobic electron transport chain | 26/2218 | 87/18723 | 5.15e-06 | 1.04e-04 | 26 |
| GO:004277325 | Oral cavity | EOLP | ATP synthesis coupled electron transport | 27/2218 | 95/18723 | 9.68e-06 | 1.75e-04 | 27 |
| GO:004277525 | Oral cavity | EOLP | mitochondrial ATP synthesis coupled electron transport | 27/2218 | 95/18723 | 9.68e-06 | 1.75e-04 | 27 |
| GO:000611925 | Oral cavity | EOLP | oxidative phosphorylation | 33/2218 | 141/18723 | 8.63e-05 | 1.02e-03 | 33 |
| GO:002290425 | Oral cavity | EOLP | respiratory electron transport chain | 28/2218 | 114/18723 | 1.20e-04 | 1.33e-03 | 28 |
| GO:000906025 | Oral cavity | EOLP | aerobic respiration | 40/2218 | 189/18723 | 1.76e-04 | 1.81e-03 | 40 |
| GO:000612224 | Oral cavity | EOLP | mitochondrial electron transport, ubiquinol to cytochrome c | 6/2218 | 11/18723 | 7.46e-04 | 6.03e-03 | 6 |
| GO:004533325 | Oral cavity | EOLP | cellular respiration | 44/2218 | 230/18723 | 8.67e-04 | 6.75e-03 | 44 |
| GO:002290025 | Oral cavity | EOLP | electron transport chain | 35/2218 | 175/18723 | 1.26e-03 | 9.04e-03 | 35 |
| GO:000609125 | Oral cavity | EOLP | generation of precursor metabolites and energy | 79/2218 | 490/18723 | 2.65e-03 | 1.59e-02 | 79 |
| GO:001598025 | Oral cavity | EOLP | energy derivation by oxidation of organic compounds | 54/2218 | 318/18723 | 4.02e-03 | 2.23e-02 | 54 |
| GO:004603433 | Oral cavity | NEOLP | ATP metabolic process | 71/2005 | 277/18723 | 1.44e-12 | 3.17e-10 | 71 |
| Pathway ID | Tissue | Disease Stage | Description | Gene Ratio | Bg Ratio | pvalue | p.adjust | qvalue | Count |
| hsa0501218 | Breast | Precancer | Parkinson disease | 99/684 | 266/8465 | 3.58e-42 | 5.65e-40 | 4.33e-40 | 99 |
| hsa0502016 | Breast | Precancer | Prion disease | 95/684 | 273/8465 | 1.39e-37 | 1.46e-35 | 1.12e-35 | 95 |
| hsa0501616 | Breast | Precancer | Huntington disease | 98/684 | 306/8465 | 2.85e-35 | 2.25e-33 | 1.72e-33 | 98 |
| hsa0019016 | Breast | Precancer | Oxidative phosphorylation | 59/684 | 134/8465 | 6.15e-30 | 3.24e-28 | 2.48e-28 | 59 |
| hsa0501016 | Breast | Precancer | Alzheimer disease | 103/684 | 384/8465 | 1.03e-29 | 4.66e-28 | 3.57e-28 | 103 |
| hsa0501416 | Breast | Precancer | Amyotrophic lateral sclerosis | 98/684 | 364/8465 | 2.13e-28 | 8.41e-27 | 6.44e-27 | 98 |
| hsa0502216 | Breast | Precancer | Pathways of neurodegeneration - multiple diseases | 112/684 | 476/8465 | 6.96e-27 | 2.44e-25 | 1.87e-25 | 112 |
| hsa0520818 | Breast | Precancer | Chemical carcinogenesis - reactive oxygen species | 68/684 | 223/8465 | 3.61e-23 | 1.14e-21 | 8.73e-22 | 68 |
| hsa0471418 | Breast | Precancer | Thermogenesis | 68/684 | 232/8465 | 4.40e-22 | 1.26e-20 | 9.69e-21 | 68 |
| hsa0541518 | Breast | Precancer | Diabetic cardiomyopathy | 63/684 | 203/8465 | 5.63e-22 | 1.48e-20 | 1.14e-20 | 63 |
| hsa0493216 | Breast | Precancer | Non-alcoholic fatty liver disease | 48/684 | 155/8465 | 6.16e-17 | 1.50e-15 | 1.15e-15 | 48 |
| hsa0426016 | Breast | Precancer | Cardiac muscle contraction | 22/684 | 87/8465 | 9.72e-07 | 1.62e-05 | 1.24e-05 | 22 |
| hsa0501219 | Breast | Precancer | Parkinson disease | 99/684 | 266/8465 | 3.58e-42 | 5.65e-40 | 4.33e-40 | 99 |
| hsa0502017 | Breast | Precancer | Prion disease | 95/684 | 273/8465 | 1.39e-37 | 1.46e-35 | 1.12e-35 | 95 |
| hsa0501617 | Breast | Precancer | Huntington disease | 98/684 | 306/8465 | 2.85e-35 | 2.25e-33 | 1.72e-33 | 98 |
| hsa0019017 | Breast | Precancer | Oxidative phosphorylation | 59/684 | 134/8465 | 6.15e-30 | 3.24e-28 | 2.48e-28 | 59 |
| hsa0501017 | Breast | Precancer | Alzheimer disease | 103/684 | 384/8465 | 1.03e-29 | 4.66e-28 | 3.57e-28 | 103 |
| hsa0501417 | Breast | Precancer | Amyotrophic lateral sclerosis | 98/684 | 364/8465 | 2.13e-28 | 8.41e-27 | 6.44e-27 | 98 |
| hsa0502217 | Breast | Precancer | Pathways of neurodegeneration - multiple diseases | 112/684 | 476/8465 | 6.96e-27 | 2.44e-25 | 1.87e-25 | 112 |
| hsa0520819 | Breast | Precancer | Chemical carcinogenesis - reactive oxygen species | 68/684 | 223/8465 | 3.61e-23 | 1.14e-21 | 8.73e-22 | 68 |
| Hugo Symbol | Variant Class | Variant Classification | dbSNP RS | HGVSc | HGVSp | HGVSp Short | SWISSPROT | BIOTYPE | SIFT | PolyPhen | Tumor Sample Barcode | Tissue | Histology | Sex | Age | Stage | Therapy Types | Drugs | Outcome |
| UQCRB | SNV | Missense_Mutation | | c.146N>A | p.Arg49Lys | p.R49K | P14927 | protein_coding | tolerated(0.22) | possibly_damaging(0.487) | TCGA-C8-A26Y-01 | Breast | breast invasive carcinoma | Female | >=65 | I/II | Unknown | Unknown | SD |
| UQCRB | SNV | Missense_Mutation | | c.39N>T | p.Trp13Cys | p.W13C | P14927 | protein_coding | deleterious(0.02) | possibly_damaging(0.905) | TCGA-FU-A3HZ-01 | Cervix | cervical & endocervical cancer | Female | <65 | I/II | Chemotherapy | cisplatin | CR |
| UQCRB | SNV | Missense_Mutation | | c.130G>T | p.Val44Leu | p.V44L | P14927 | protein_coding | deleterious(0.03) | benign(0.255) | TCGA-Q1-A6DT-01 | Cervix | cervical & endocervical cancer | Female | <65 | I/II | Unknown | Unknown | PD |
| UQCRB | SNV | Missense_Mutation | novel | c.184C>T | p.Arg62Cys | p.R62C | P14927 | protein_coding | deleterious(0.02) | probably_damaging(0.995) | TCGA-AA-A00N-01 | Colorectum | colon adenocarcinoma | Male | >=65 | I/II | Unknown | Unknown | PD |
| UQCRB | SNV | Missense_Mutation | rs749174411 | c.53N>A | p.Arg18Gln | p.R18Q | P14927 | protein_coding | tolerated(0.19) | benign(0.145) | TCGA-AJ-A3EK-01 | Endometrium | uterine corpus endometrioid carcinoma | Female | <65 | I/II | Chemotherapy | carboplatin | CR |
| UQCRB | SNV | Missense_Mutation | | c.223A>C | p.Ile75Leu | p.I75L | P14927 | protein_coding | tolerated(0.29) | possibly_damaging(0.718) | TCGA-AX-A0J0-01 | Endometrium | uterine corpus endometrioid carcinoma | Female | <65 | I/II | Unknown | Unknown | SD |
| UQCRB | SNV | Missense_Mutation | novel | c.185N>A | p.Arg62His | p.R62H | P14927 | protein_coding | deleterious(0.03) | possibly_damaging(0.693) | TCGA-AX-A1CE-01 | Endometrium | uterine corpus endometrioid carcinoma | Female | <65 | I/II | Unspecific | Paclitaxel | SD |
| UQCRB | SNV | Missense_Mutation | novel | c.60G>C | p.Trp20Cys | p.W20C | P14927 | protein_coding | deleterious(0) | probably_damaging(0.999) | TCGA-AX-A2HG-01 | Endometrium | uterine corpus endometrioid carcinoma | Female | <65 | I/II | Unknown | Unknown | SD |
| UQCRB | SNV | Missense_Mutation | novel | c.233A>C | p.Lys78Thr | p.K78T | P14927 | protein_coding | deleterious(0) | probably_damaging(0.976) | TCGA-BS-A0UV-01 | Endometrium | uterine corpus endometrioid carcinoma | Female | <65 | III/IV | Unknown | Unknown | SD |
| UQCRB | SNV | Missense_Mutation | rs376775585 | c.79N>G | p.Phe27Val | p.F27V | P14927 | protein_coding | deleterious(0.02) | possibly_damaging(0.795) | TCGA-G3-A5SL-01 | Liver | liver hepatocellular carcinoma | Male | >=65 | I/II | Unknown | Unknown | SD |


