
|
|||||
|
 | |
| |
| |
| |
| |
| |
|
Gene: TRAF2 |
Gene summary for TRAF2 |
| Gene information | Species | Human | Gene symbol | TRAF2 | Gene ID | 7186 |
| Gene name | TNF receptor associated factor 2 | |
| Gene Alias | MGC:45012 | |
| Cytomap | 9q34.3 | |
| Gene Type | protein-coding | GO ID | GO:0000165 | UniProtAcc | A0A024R8H5 |
Top |
Malignant transformation analysis |
| Identification of the aberrant gene expression in precancerous and cancerous lesions by comparing the gene expression of stem-like cells in diseased tissues with normal stem cells |
| Entrez ID | Symbol | Replicates | Species | Organ | Tissue | Adj P-value | Log2FC | Malignancy |
| 7186 | TRAF2 | LZE8T | Human | Esophagus | ESCC | 2.63e-03 | 1.34e-01 | 0.067 |
| 7186 | TRAF2 | LZE20T | Human | Esophagus | ESCC | 3.95e-03 | 2.08e-01 | 0.0662 |
| 7186 | TRAF2 | LZE24T | Human | Esophagus | ESCC | 5.81e-09 | 2.44e-01 | 0.0596 |
| 7186 | TRAF2 | LZE21T | Human | Esophagus | ESCC | 4.46e-03 | 2.78e-01 | 0.0655 |
| 7186 | TRAF2 | P1T-E | Human | Esophagus | ESCC | 1.74e-02 | 1.62e-01 | 0.0875 |
| 7186 | TRAF2 | P2T-E | Human | Esophagus | ESCC | 9.86e-34 | 6.09e-01 | 0.1177 |
| 7186 | TRAF2 | P4T-E | Human | Esophagus | ESCC | 8.64e-12 | 2.45e-01 | 0.1323 |
| 7186 | TRAF2 | P5T-E | Human | Esophagus | ESCC | 2.00e-04 | 1.34e-01 | 0.1327 |
| 7186 | TRAF2 | P8T-E | Human | Esophagus | ESCC | 3.15e-14 | 3.09e-01 | 0.0889 |
| 7186 | TRAF2 | P9T-E | Human | Esophagus | ESCC | 9.12e-03 | 9.98e-02 | 0.1131 |
| 7186 | TRAF2 | P10T-E | Human | Esophagus | ESCC | 1.71e-05 | 1.22e-01 | 0.116 |
| 7186 | TRAF2 | P11T-E | Human | Esophagus | ESCC | 2.20e-05 | 3.27e-01 | 0.1426 |
| 7186 | TRAF2 | P12T-E | Human | Esophagus | ESCC | 2.03e-09 | 1.49e-01 | 0.1122 |
| 7186 | TRAF2 | P15T-E | Human | Esophagus | ESCC | 4.94e-10 | 1.70e-01 | 0.1149 |
| 7186 | TRAF2 | P16T-E | Human | Esophagus | ESCC | 8.67e-11 | 1.99e-01 | 0.1153 |
| 7186 | TRAF2 | P17T-E | Human | Esophagus | ESCC | 9.61e-08 | 4.21e-01 | 0.1278 |
| 7186 | TRAF2 | P20T-E | Human | Esophagus | ESCC | 1.04e-06 | 1.62e-01 | 0.1124 |
| 7186 | TRAF2 | P21T-E | Human | Esophagus | ESCC | 1.29e-19 | 3.58e-01 | 0.1617 |
| 7186 | TRAF2 | P22T-E | Human | Esophagus | ESCC | 4.04e-11 | 1.31e-01 | 0.1236 |
| 7186 | TRAF2 | P23T-E | Human | Esophagus | ESCC | 5.52e-11 | 3.34e-01 | 0.108 |
| Page: 1 2 3 4 |
| Tissue | Expression Dynamics | Abbreviation |
| Esophagus | 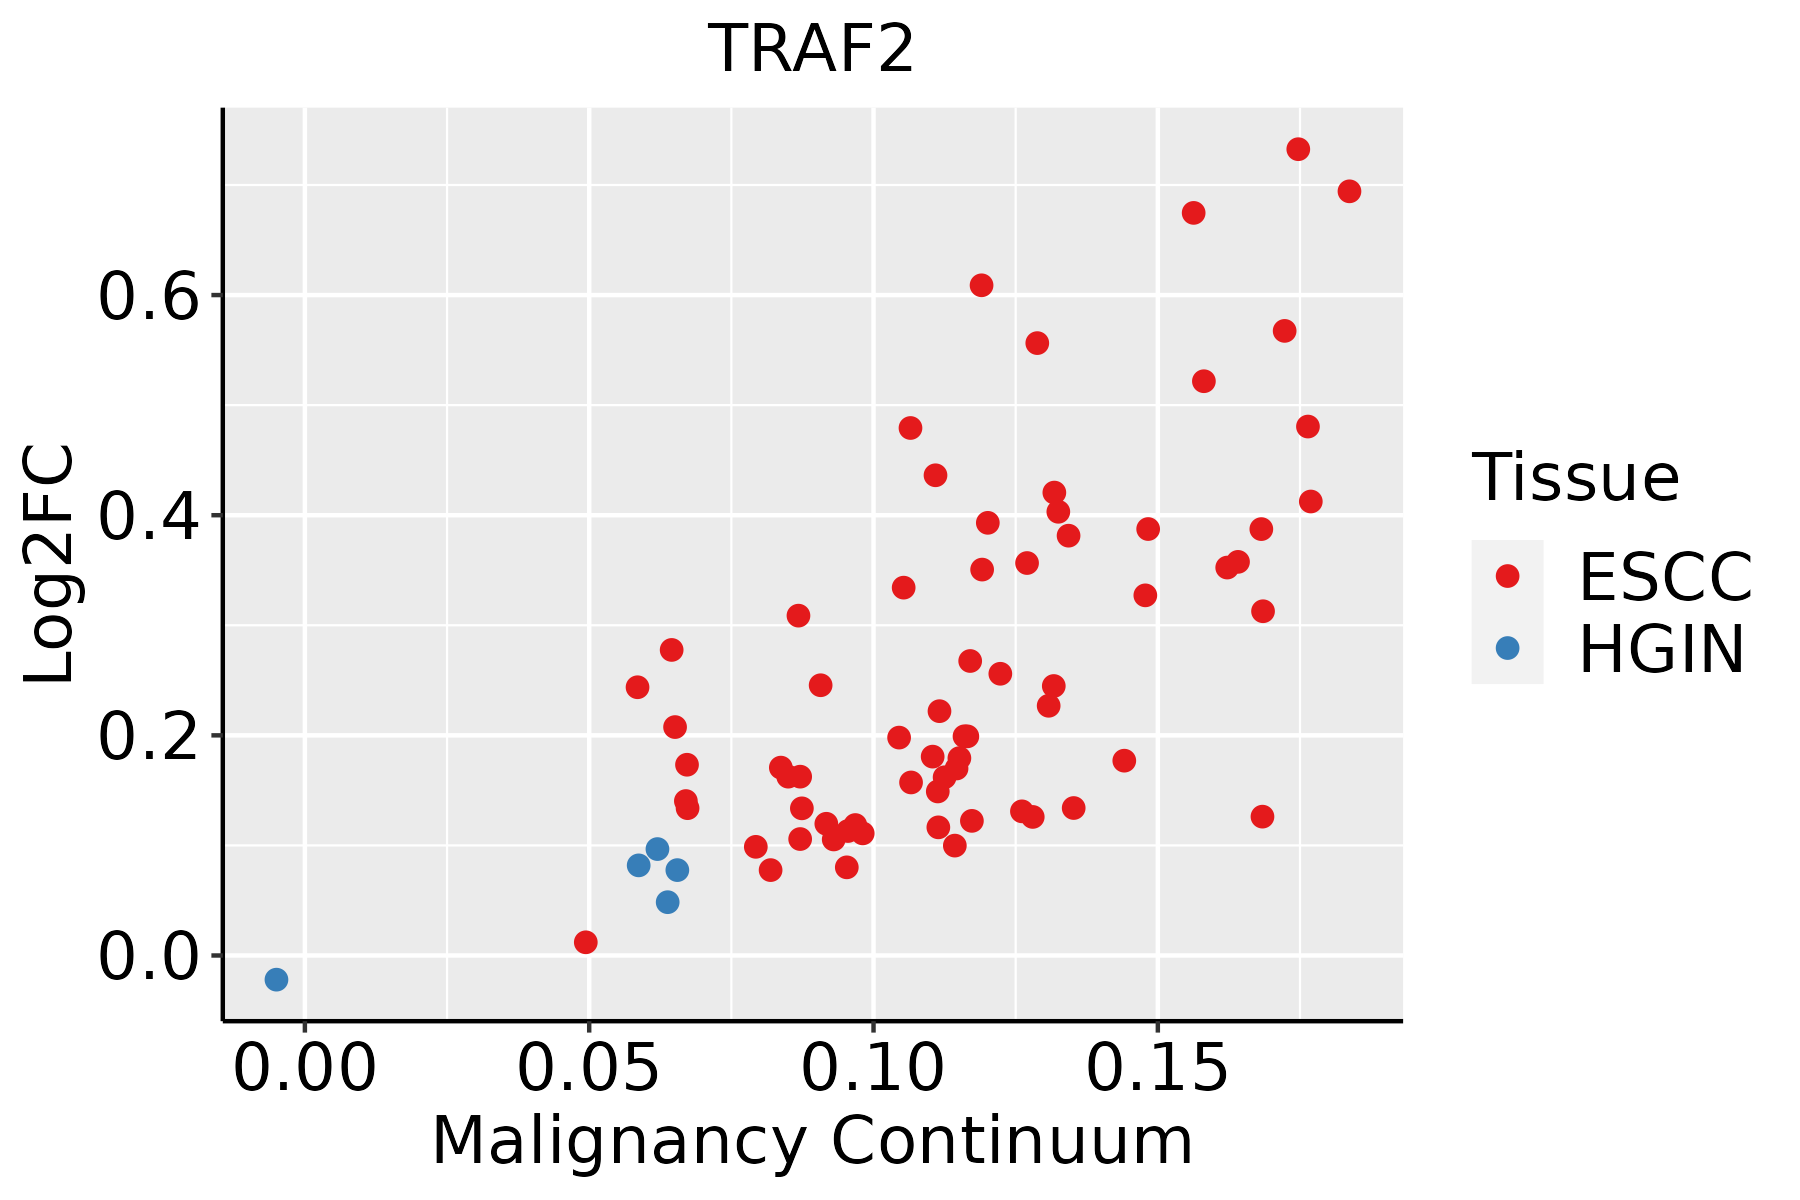 | ESCC: Esophageal squamous cell carcinoma |
| HGIN: High-grade intraepithelial neoplasias | ||
| LGIN: Low-grade intraepithelial neoplasias | ||
| Oral Cavity |  | EOLP: Erosive Oral lichen planus |
| LP: leukoplakia | ||
| NEOLP: Non-erosive oral lichen planus | ||
| OSCC: Oral squamous cell carcinoma |
| ∗log2FC in expression of this searched gene in stem-like cells from each diseased tissue sample relative to stem-like cells in normal samples in each tissue plotted against the malignancy continuum. Samples are colored based on if they are from different disease stage. |
Top |
Malignant transformation related pathway analysis |
| Find out the enriched GO biological processes and KEGG pathways involved in transition from healthy to precancer to cancer |
| Tissue | Disease Stage | Enriched GO biological Processes |
| Colorectum | AD |  |
| Colorectum | SER |  |
| Colorectum | MSS |  |
| Colorectum | MSI-H |  |
| Colorectum | FAP |  |
| ∗Top 15 enriched GO BP terms are showed in the bar plot of each disease state in each tissue. Each row represents a significant GO biological process which is colored according to the -log10(p.adjust). |
| Page: 1 2 3 4 5 6 7 8 9 |
| GO ID | Tissue | Disease Stage | Description | Gene Ratio | Bg Ratio | pvalue | p.adjust | Count |
| GO:00019592 | Oral cavity | EOLP | regulation of cytokine-mediated signaling pathway | 46/2218 | 150/18723 | 5.71e-10 | 4.44e-08 | 46 |
| GO:200123525 | Oral cavity | EOLP | positive regulation of apoptotic signaling pathway | 41/2218 | 126/18723 | 6.68e-10 | 5.06e-08 | 41 |
| GO:000020923 | Oral cavity | EOLP | protein polyubiquitination | 62/2218 | 236/18723 | 7.88e-10 | 5.90e-08 | 62 |
| GO:003465523 | Oral cavity | EOLP | nucleobase-containing compound catabolic process | 89/2218 | 407/18723 | 5.47e-09 | 2.92e-07 | 89 |
| GO:003133025 | Oral cavity | EOLP | negative regulation of cellular catabolic process | 64/2218 | 262/18723 | 9.72e-09 | 4.77e-07 | 64 |
| GO:000989525 | Oral cavity | EOLP | negative regulation of catabolic process | 73/2218 | 320/18723 | 2.07e-08 | 8.84e-07 | 73 |
| GO:004670023 | Oral cavity | EOLP | heterocycle catabolic process | 93/2218 | 445/18723 | 2.61e-08 | 1.08e-06 | 93 |
| GO:190331225 | Oral cavity | EOLP | negative regulation of mRNA metabolic process | 31/2218 | 92/18723 | 3.14e-08 | 1.24e-06 | 31 |
| GO:200123625 | Oral cavity | EOLP | regulation of extrinsic apoptotic signaling pathway | 42/2218 | 151/18723 | 7.31e-08 | 2.61e-06 | 42 |
| GO:009719125 | Oral cavity | EOLP | extrinsic apoptotic signaling pathway | 54/2218 | 219/18723 | 9.74e-08 | 3.36e-06 | 54 |
| GO:004427023 | Oral cavity | EOLP | cellular nitrogen compound catabolic process | 92/2218 | 451/18723 | 1.01e-07 | 3.45e-06 | 92 |
| GO:007135623 | Oral cavity | EOLP | cellular response to tumor necrosis factor | 55/2218 | 229/18723 | 1.90e-07 | 6.02e-06 | 55 |
| GO:001922112 | Oral cavity | EOLP | cytokine-mediated signaling pathway | 94/2218 | 472/18723 | 2.36e-07 | 7.37e-06 | 94 |
| GO:004312223 | Oral cavity | EOLP | regulation of I-kappaB kinase/NF-kappaB signaling | 58/2218 | 249/18723 | 2.72e-07 | 8.22e-06 | 58 |
| GO:003461224 | Oral cavity | EOLP | response to tumor necrosis factor | 58/2218 | 253/18723 | 4.79e-07 | 1.32e-05 | 58 |
| GO:001943923 | Oral cavity | EOLP | aromatic compound catabolic process | 92/2218 | 467/18723 | 5.23e-07 | 1.40e-05 | 92 |
| GO:007190023 | Oral cavity | EOLP | regulation of protein serine/threonine kinase activity | 75/2218 | 359/18723 | 5.81e-07 | 1.53e-05 | 75 |
| GO:003320922 | Oral cavity | EOLP | tumor necrosis factor-mediated signaling pathway | 30/2218 | 99/18723 | 7.19e-07 | 1.83e-05 | 30 |
| GO:000724924 | Oral cavity | EOLP | I-kappaB kinase/NF-kappaB signaling | 62/2218 | 281/18723 | 8.00e-07 | 2.02e-05 | 62 |
| GO:190136123 | Oral cavity | EOLP | organic cyclic compound catabolic process | 95/2218 | 495/18723 | 1.15e-06 | 2.80e-05 | 95 |
| Page: 1 2 3 4 5 6 7 8 9 10 11 12 13 14 |
| Pathway ID | Tissue | Disease Stage | Description | Gene Ratio | Bg Ratio | pvalue | p.adjust | qvalue | Count |
| hsa04141211 | Esophagus | ESCC | Protein processing in endoplasmic reticulum | 147/4205 | 174/8465 | 3.29e-22 | 1.10e-19 | 5.64e-20 | 147 |
| hsa05014210 | Esophagus | ESCC | Amyotrophic lateral sclerosis | 266/4205 | 364/8465 | 1.31e-20 | 2.20e-18 | 1.13e-18 | 266 |
| hsa05132211 | Esophagus | ESCC | Salmonella infection | 191/4205 | 249/8465 | 6.51e-19 | 5.45e-17 | 2.79e-17 | 191 |
| hsa05016210 | Esophagus | ESCC | Huntington disease | 226/4205 | 306/8465 | 1.38e-18 | 8.72e-17 | 4.46e-17 | 226 |
| hsa05022210 | Esophagus | ESCC | Pathways of neurodegeneration - multiple diseases | 318/4205 | 476/8465 | 6.10e-15 | 2.04e-13 | 1.05e-13 | 318 |
| hsa05010210 | Esophagus | ESCC | Alzheimer disease | 263/4205 | 384/8465 | 1.80e-14 | 5.47e-13 | 2.80e-13 | 263 |
| hsa04932210 | Esophagus | ESCC | Non-alcoholic fatty liver disease | 122/4205 | 155/8465 | 5.69e-14 | 1.59e-12 | 8.14e-13 | 122 |
| hsa05169210 | Esophagus | ESCC | Epstein-Barr virus infection | 151/4205 | 202/8465 | 1.55e-13 | 3.45e-12 | 1.77e-12 | 151 |
| hsa05131211 | Esophagus | ESCC | Shigellosis | 176/4205 | 247/8465 | 2.27e-12 | 4.01e-11 | 2.05e-11 | 176 |
| hsa05130211 | Esophagus | ESCC | Pathogenic Escherichia coli infection | 142/4205 | 197/8465 | 8.21e-11 | 1.06e-09 | 5.42e-10 | 142 |
| hsa0466810 | Esophagus | ESCC | TNF signaling pathway | 89/4205 | 114/8465 | 3.36e-10 | 4.01e-09 | 2.06e-09 | 89 |
| hsa0421027 | Esophagus | ESCC | Apoptosis | 102/4205 | 136/8465 | 1.05e-09 | 1.21e-08 | 6.21e-09 | 102 |
| hsa05170210 | Esophagus | ESCC | Human immunodeficiency virus 1 infection | 147/4205 | 212/8465 | 3.37e-09 | 3.53e-08 | 1.81e-08 | 147 |
| hsa05167211 | Esophagus | ESCC | Kaposi sarcoma-associated herpesvirus infection | 136/4205 | 194/8465 | 4.28e-09 | 4.22e-08 | 2.16e-08 | 136 |
| hsa0513526 | Esophagus | ESCC | Yersinia infection | 100/4205 | 137/8465 | 1.80e-08 | 1.59e-07 | 8.12e-08 | 100 |
| hsa0520325 | Esophagus | ESCC | Viral carcinogenesis | 137/4205 | 204/8465 | 2.47e-07 | 1.88e-06 | 9.62e-07 | 137 |
| hsa05417211 | Esophagus | ESCC | Lipid and atherosclerosis | 143/4205 | 215/8465 | 3.30e-07 | 2.45e-06 | 1.26e-06 | 143 |
| hsa052229 | Esophagus | ESCC | Small cell lung cancer | 69/4205 | 92/8465 | 5.40e-07 | 3.85e-06 | 1.97e-06 | 69 |
| hsa05163210 | Esophagus | ESCC | Human cytomegalovirus infection | 148/4205 | 225/8465 | 5.73e-07 | 4.00e-06 | 2.05e-06 | 148 |
| hsa051609 | Esophagus | ESCC | Hepatitis C | 107/4205 | 157/8465 | 1.75e-06 | 1.08e-05 | 5.55e-06 | 107 |
| Page: 1 2 3 4 5 6 7 8 9 10 11 |
Top |
Cell-cell communication analysis |
| Identification of potential cell-cell interactions between two cell types and their ligand-receptor pairs for different disease states |
| Ligand | Receptor | LRpair | Pathway | Tissue | Disease Stage |
| Page: 1 |
Top |
Single-cell gene regulatory network inference analysis |
| Find out the significant the regulons (TFs) and the target genes of each regulon across cell types for different disease states |
| TF | Cell Type | Tissue | Disease Stage | Target Gene | RSS | Regulon Activity |
| ∗The dot plots of a searched regulon are shown for all cell subpopulations in each disease state of each tissue based on the regulon specific score inferred using pySCENIC and by calculating the average expression. |
| Page: 1 |
Top |
Somatic mutation of malignant transformation related genes |
| Annotation of somatic variants for genes involved in malignant transformation |
| Hugo Symbol | Variant Class | Variant Classification | dbSNP RS | HGVSc | HGVSp | HGVSp Short | SWISSPROT | BIOTYPE | SIFT | PolyPhen | Tumor Sample Barcode | Tissue | Histology | Sex | Age | Stage | Therapy Types | Drugs | Outcome |
| TRAF2 | SNV | Missense_Mutation | rs762052203 | c.490C>T | p.Arg164Trp | p.R164W | Q12933 | protein_coding | deleterious(0.01) | possibly_damaging(0.462) | TCGA-AO-A128-01 | Breast | breast invasive carcinoma | Female | <65 | I/II | Chemotherapy | doxorubicin | SD |
| TRAF2 | SNV | Missense_Mutation | c.1114N>T | p.Arg372Cys | p.R372C | Q12933 | protein_coding | deleterious(0) | probably_damaging(1) | TCGA-2W-A8YY-01 | Cervix | cervical & endocervical cancer | Female | <65 | I/II | Chemotherapy | cisplatin | CR | |
| TRAF2 | SNV | Missense_Mutation | c.1178G>A | p.Arg393His | p.R393H | Q12933 | protein_coding | deleterious(0) | probably_damaging(0.936) | TCGA-EA-A43B-01 | Cervix | cervical & endocervical cancer | Female | <65 | I/II | Chemotherapy | cisplatin | CR | |
| TRAF2 | SNV | Missense_Mutation | rs200834553 | c.266N>T | p.Ser89Leu | p.S89L | Q12933 | protein_coding | deleterious(0.04) | benign(0.115) | TCGA-MA-AA42-01 | Cervix | cervical & endocervical cancer | Female | >=65 | I/II | Unknown | Unknown | SD |
| TRAF2 | SNV | Missense_Mutation | novel | c.1430N>C | p.Lys477Thr | p.K477T | Q12933 | protein_coding | deleterious(0.01) | benign(0.184) | TCGA-VS-A8EC-01 | Cervix | cervical & endocervical cancer | Female | <65 | III/IV | Chemotherapy | carboplatin | CR |
| TRAF2 | SNV | Missense_Mutation | novel | c.1443N>C | p.Lys481Asn | p.K481N | Q12933 | protein_coding | deleterious(0) | possibly_damaging(0.724) | TCGA-VS-A94X-01 | Cervix | cervical & endocervical cancer | Female | <65 | I/II | Chemotherapy | cisplatin | PD |
| TRAF2 | SNV | Missense_Mutation | rs767031937 | c.538N>A | p.Glu180Lys | p.E180K | Q12933 | protein_coding | tolerated(0.08) | benign(0.06) | TCGA-AA-3502-01 | Colorectum | colon adenocarcinoma | Male | >=65 | I/II | Unknown | Unknown | SD |
| TRAF2 | SNV | Missense_Mutation | rs780585355 | c.449N>A | p.Arg150His | p.R150H | Q12933 | protein_coding | tolerated(0.26) | benign(0.001) | TCGA-AA-3715-01 | Colorectum | colon adenocarcinoma | Male | >=65 | I/II | Unknown | Unknown | PD |
| TRAF2 | SNV | Missense_Mutation | c.839C>T | p.Ala280Val | p.A280V | Q12933 | protein_coding | tolerated(0.38) | benign(0.001) | TCGA-AD-6889-01 | Colorectum | colon adenocarcinoma | Male | >=65 | I/II | Chemotherapy | xeloda | PD | |
| TRAF2 | SNV | Missense_Mutation | c.1237N>A | p.Val413Met | p.V413M | Q12933 | protein_coding | deleterious(0) | possibly_damaging(0.506) | TCGA-AD-6964-01 | Colorectum | colon adenocarcinoma | Male | <65 | III/IV | Chemotherapy | folfox | PD |
| Page: 1 2 3 4 5 |
Top |
Related drugs of malignant transformation related genes |
| Identification of chemicals and drugs interact with genes involved in malignant transfromation |
| (DGIdb 4.0) |
| Entrez ID | Symbol | Category | Interaction Types | Drug Claim Name | Drug Name | PMIDs |
| Page: 1 |

Copyright 2023-Present -The University of Texas Health Science Center at Houston |