
|
|||||
|
 | |
| |
| |
| |
| |
| |
|
Gene: TPP1 |
Gene summary for TPP1 |
| Gene information | Species | Human | Gene symbol | TPP1 | Gene ID | 1200 |
| Gene name | tripeptidyl peptidase 1 | |
| Gene Alias | CLN2 | |
| Cytomap | 11p15.4 | |
| Gene Type | protein-coding | GO ID | GO:0001894 | UniProtAcc | O14773 |
Top |
Malignant transformation analysis |
| Identification of the aberrant gene expression in precancerous and cancerous lesions by comparing the gene expression of stem-like cells in diseased tissues with normal stem cells |
| Entrez ID | Symbol | Replicates | Species | Organ | Tissue | Adj P-value | Log2FC | Malignancy |
| 1200 | TPP1 | HTA11_2487_2000001011 | Human | Colorectum | SER | 1.41e-09 | 4.39e-01 | -0.1808 |
| 1200 | TPP1 | HTA11_347_2000001011 | Human | Colorectum | AD | 8.07e-12 | 3.49e-01 | -0.1954 |
| 1200 | TPP1 | HTA11_83_2000001011 | Human | Colorectum | SER | 2.87e-02 | 2.36e-01 | -0.1526 |
| 1200 | TPP1 | HTA11_1391_2000001011 | Human | Colorectum | AD | 1.32e-05 | 3.09e-01 | -0.059 |
| 1200 | TPP1 | HTA11_5216_2000001011 | Human | Colorectum | SER | 2.42e-02 | 3.16e-01 | -0.1462 |
| 1200 | TPP1 | HTA11_866_3004761011 | Human | Colorectum | AD | 6.14e-09 | 3.37e-01 | 0.096 |
| 1200 | TPP1 | HTA11_99999970781_79442 | Human | Colorectum | MSS | 1.40e-05 | 2.64e-01 | 0.294 |
| 1200 | TPP1 | HTA11_99999965104_69814 | Human | Colorectum | MSS | 3.01e-10 | 3.92e-01 | 0.281 |
| 1200 | TPP1 | HTA11_99999971662_82457 | Human | Colorectum | MSS | 1.01e-12 | 4.00e-01 | 0.3859 |
| 1200 | TPP1 | HTA11_99999973899_84307 | Human | Colorectum | MSS | 3.08e-02 | 1.95e-01 | 0.2585 |
| 1200 | TPP1 | HTA11_99999974143_84620 | Human | Colorectum | MSS | 1.11e-03 | 1.97e-01 | 0.3005 |
| 1200 | TPP1 | LZE4T | Human | Esophagus | ESCC | 8.73e-04 | 2.18e-01 | 0.0811 |
| 1200 | TPP1 | LZE7T | Human | Esophagus | ESCC | 1.18e-09 | 2.82e-01 | 0.0667 |
| 1200 | TPP1 | LZE8T | Human | Esophagus | ESCC | 1.55e-06 | 1.48e-01 | 0.067 |
| 1200 | TPP1 | LZE20T | Human | Esophagus | ESCC | 2.82e-02 | -3.85e-03 | 0.0662 |
| 1200 | TPP1 | LZE22D1 | Human | Esophagus | HGIN | 1.16e-02 | -1.66e-02 | 0.0595 |
| 1200 | TPP1 | LZE22T | Human | Esophagus | ESCC | 7.75e-06 | 1.29e-01 | 0.068 |
| 1200 | TPP1 | LZE24T | Human | Esophagus | ESCC | 1.12e-20 | 6.31e-01 | 0.0596 |
| 1200 | TPP1 | LZE21T | Human | Esophagus | ESCC | 3.29e-03 | 7.45e-02 | 0.0655 |
| 1200 | TPP1 | P1T-E | Human | Esophagus | ESCC | 3.95e-07 | 2.19e-01 | 0.0875 |
| Page: 1 2 3 4 5 6 7 |
| Tissue | Expression Dynamics | Abbreviation |
| Colorectum (GSE201348) |  | FAP: Familial adenomatous polyposis |
| CRC: Colorectal cancer | ||
| Colorectum (HTA11) |  | AD: Adenomas |
| SER: Sessile serrated lesions | ||
| MSI-H: Microsatellite-high colorectal cancer | ||
| MSS: Microsatellite stable colorectal cancer | ||
| Esophagus | 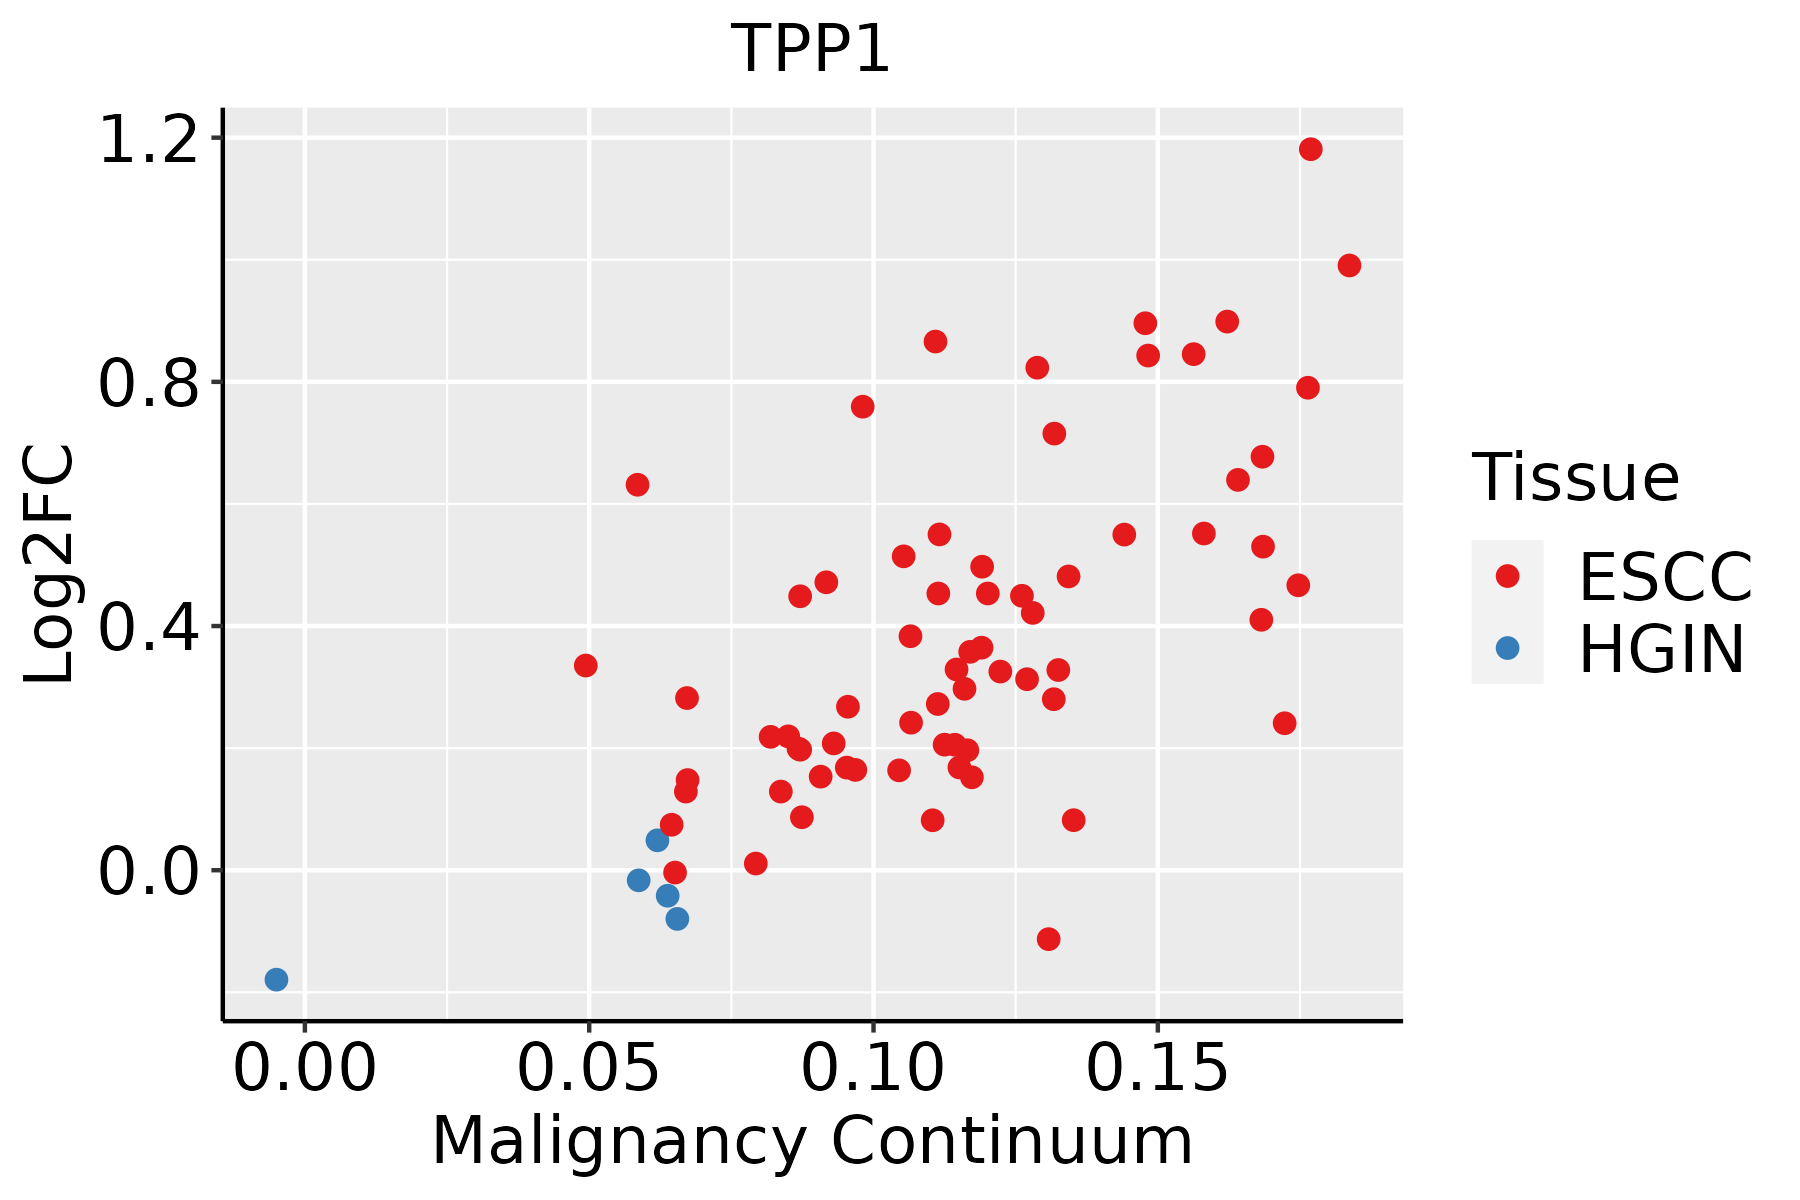 | ESCC: Esophageal squamous cell carcinoma |
| HGIN: High-grade intraepithelial neoplasias | ||
| LGIN: Low-grade intraepithelial neoplasias | ||
| Liver |  | HCC: Hepatocellular carcinoma |
| NAFLD: Non-alcoholic fatty liver disease | ||
| Oral Cavity |  | EOLP: Erosive Oral lichen planus |
| LP: leukoplakia | ||
| NEOLP: Non-erosive oral lichen planus | ||
| OSCC: Oral squamous cell carcinoma | ||
| Thyroid | 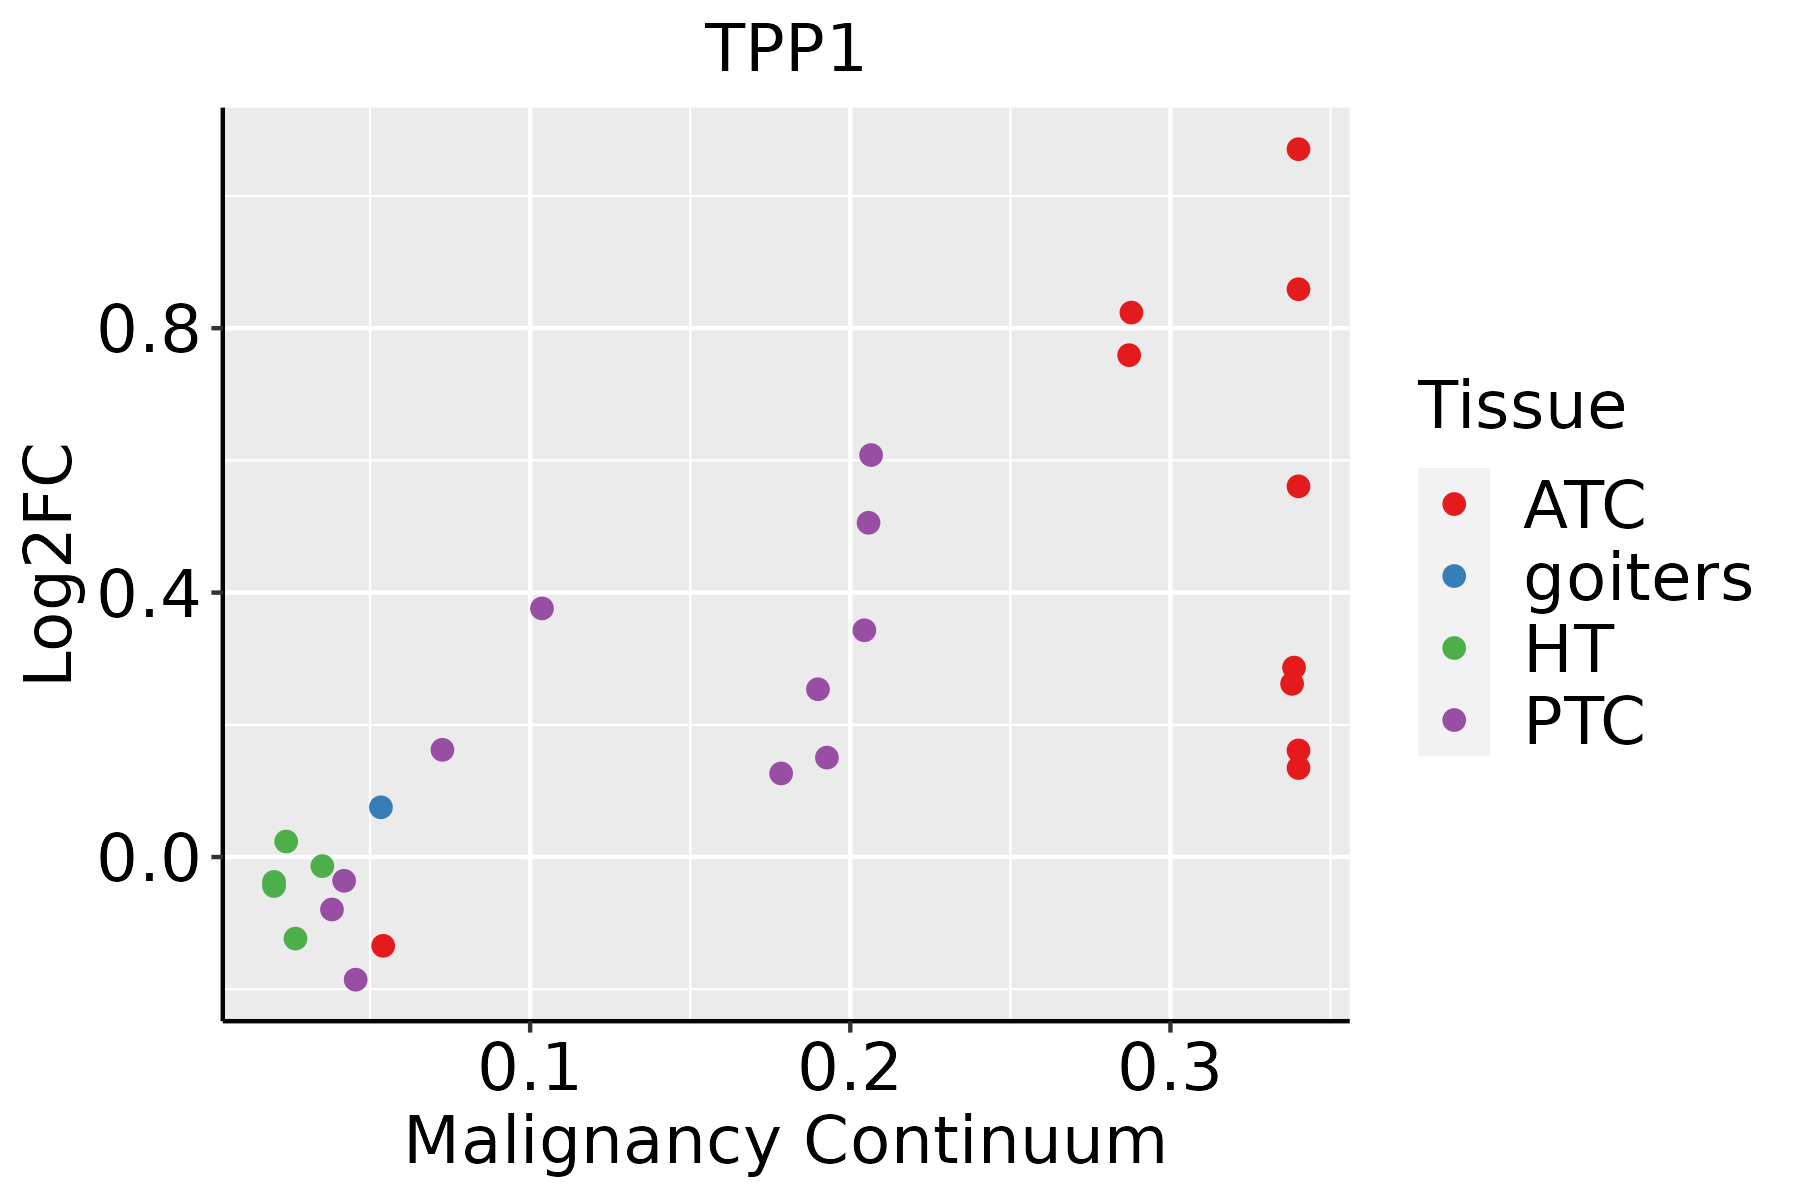 | ATC: Anaplastic thyroid cancer |
| HT: Hashimoto's thyroiditis | ||
| PTC: Papillary thyroid cancer |
| ∗log2FC in expression of this searched gene in stem-like cells from each diseased tissue sample relative to stem-like cells in normal samples in each tissue plotted against the malignancy continuum. Samples are colored based on if they are from different disease stage. |
Top |
Malignant transformation related pathway analysis |
| Find out the enriched GO biological processes and KEGG pathways involved in transition from healthy to precancer to cancer |
| Tissue | Disease Stage | Enriched GO biological Processes |
| Colorectum | AD |  |
| Colorectum | SER |  |
| Colorectum | MSS |  |
| Colorectum | MSI-H |  |
| Colorectum | FAP |  |
| ∗Top 15 enriched GO BP terms are showed in the bar plot of each disease state in each tissue. Each row represents a significant GO biological process which is colored according to the -log10(p.adjust). |
| Page: 1 2 3 4 5 6 7 8 9 |
| GO ID | Tissue | Disease Stage | Description | Gene Ratio | Bg Ratio | pvalue | p.adjust | Count |
| GO:190136115 | Oral cavity | OSCC | organic cyclic compound catabolic process | 272/7305 | 495/18723 | 2.73e-13 | 1.36e-11 | 272 |
| GO:007149620 | Oral cavity | OSCC | cellular response to external stimulus | 186/7305 | 320/18723 | 2.56e-12 | 1.05e-10 | 186 |
| GO:00070335 | Oral cavity | OSCC | vacuole organization | 115/7305 | 180/18723 | 1.11e-11 | 4.00e-10 | 115 |
| GO:003166819 | Oral cavity | OSCC | cellular response to extracellular stimulus | 141/7305 | 246/18723 | 3.99e-09 | 8.95e-08 | 141 |
| GO:00070402 | Oral cavity | OSCC | lysosome organization | 51/7305 | 74/18723 | 1.77e-07 | 2.87e-06 | 51 |
| GO:00801712 | Oral cavity | OSCC | lytic vacuole organization | 51/7305 | 74/18723 | 1.77e-07 | 2.87e-06 | 51 |
| GO:00345023 | Oral cavity | OSCC | protein localization to chromosome | 60/7305 | 92/18723 | 3.17e-07 | 4.79e-06 | 60 |
| GO:000675318 | Oral cavity | OSCC | nucleoside phosphate metabolic process | 247/7305 | 497/18723 | 6.28e-07 | 8.96e-06 | 247 |
| GO:000911719 | Oral cavity | OSCC | nucleotide metabolic process | 243/7305 | 489/18723 | 7.80e-07 | 1.09e-05 | 243 |
| GO:00196923 | Oral cavity | OSCC | deoxyribose phosphate metabolic process | 30/7305 | 42/18723 | 2.06e-05 | 1.96e-04 | 30 |
| GO:00092623 | Oral cavity | OSCC | deoxyribonucleotide metabolic process | 31/7305 | 44/18723 | 2.33e-05 | 2.21e-04 | 31 |
| GO:00093943 | Oral cavity | OSCC | 2'-deoxyribonucleotide metabolic process | 28/7305 | 40/18723 | 7.00e-05 | 5.60e-04 | 28 |
| GO:00062202 | Oral cavity | OSCC | pyrimidine nucleotide metabolic process | 33/7305 | 50/18723 | 1.01e-04 | 7.58e-04 | 33 |
| GO:00092004 | Oral cavity | OSCC | deoxyribonucleoside triphosphate metabolic process | 14/7305 | 17/18723 | 3.31e-04 | 2.04e-03 | 14 |
| GO:19011361 | Oral cavity | OSCC | carbohydrate derivative catabolic process | 89/7305 | 172/18723 | 4.52e-04 | 2.73e-03 | 89 |
| GO:00091472 | Oral cavity | OSCC | pyrimidine nucleoside triphosphate metabolic process | 18/7305 | 25/18723 | 8.47e-04 | 4.47e-03 | 18 |
| GO:00701986 | Oral cavity | OSCC | protein localization to chromosome, telomeric region | 20/7305 | 29/18723 | 1.05e-03 | 5.39e-03 | 20 |
| GO:00463862 | Oral cavity | OSCC | deoxyribose phosphate catabolic process | 21/7305 | 31/18723 | 1.13e-03 | 5.75e-03 | 21 |
| GO:19051462 | Oral cavity | OSCC | lysosomal protein catabolic process | 12/7305 | 15/18723 | 1.49e-03 | 7.13e-03 | 12 |
| GO:00092192 | Oral cavity | OSCC | pyrimidine deoxyribonucleotide metabolic process | 17/7305 | 24/18723 | 1.59e-03 | 7.56e-03 | 17 |
| Page: 1 2 3 4 5 6 7 8 9 10 11 12 13 14 15 16 |
| Pathway ID | Tissue | Disease Stage | Description | Gene Ratio | Bg Ratio | pvalue | p.adjust | qvalue | Count |
| hsa04142 | Colorectum | SER | Lysosome | 38/1580 | 132/8465 | 2.87e-03 | 2.03e-02 | 1.47e-02 | 38 |
| hsa041421 | Colorectum | SER | Lysosome | 38/1580 | 132/8465 | 2.87e-03 | 2.03e-02 | 1.47e-02 | 38 |
| hsa041426 | Esophagus | HGIN | Lysosome | 33/1383 | 132/8465 | 6.65e-03 | 4.37e-02 | 3.47e-02 | 33 |
| hsa0414213 | Esophagus | HGIN | Lysosome | 33/1383 | 132/8465 | 6.65e-03 | 4.37e-02 | 3.47e-02 | 33 |
| hsa0414222 | Esophagus | ESCC | Lysosome | 102/4205 | 132/8465 | 5.11e-11 | 7.13e-10 | 3.65e-10 | 102 |
| hsa0414232 | Esophagus | ESCC | Lysosome | 102/4205 | 132/8465 | 5.11e-11 | 7.13e-10 | 3.65e-10 | 102 |
| hsa041424 | Liver | Cirrhotic | Lysosome | 68/2530 | 132/8465 | 1.34e-07 | 1.97e-06 | 1.21e-06 | 68 |
| hsa0414211 | Liver | Cirrhotic | Lysosome | 68/2530 | 132/8465 | 1.34e-07 | 1.97e-06 | 1.21e-06 | 68 |
| hsa041422 | Liver | HCC | Lysosome | 100/4020 | 132/8465 | 2.32e-11 | 4.31e-10 | 2.40e-10 | 100 |
| hsa041423 | Liver | HCC | Lysosome | 100/4020 | 132/8465 | 2.32e-11 | 4.31e-10 | 2.40e-10 | 100 |
| hsa041425 | Oral cavity | OSCC | Lysosome | 87/3704 | 132/8465 | 1.97e-07 | 1.35e-06 | 6.86e-07 | 87 |
| hsa0414212 | Oral cavity | OSCC | Lysosome | 87/3704 | 132/8465 | 1.97e-07 | 1.35e-06 | 6.86e-07 | 87 |
| hsa0414221 | Oral cavity | LP | Lysosome | 67/2418 | 132/8465 | 5.13e-08 | 7.77e-07 | 5.01e-07 | 67 |
| hsa0414231 | Oral cavity | LP | Lysosome | 67/2418 | 132/8465 | 5.13e-08 | 7.77e-07 | 5.01e-07 | 67 |
| Page: 1 |
Top |
Cell-cell communication analysis |
| Identification of potential cell-cell interactions between two cell types and their ligand-receptor pairs for different disease states |
| Ligand | Receptor | LRpair | Pathway | Tissue | Disease Stage |
| Page: 1 |
Top |
Single-cell gene regulatory network inference analysis |
| Find out the significant the regulons (TFs) and the target genes of each regulon across cell types for different disease states |
| TF | Cell Type | Tissue | Disease Stage | Target Gene | RSS | Regulon Activity |
| ∗The dot plots of a searched regulon are shown for all cell subpopulations in each disease state of each tissue based on the regulon specific score inferred using pySCENIC and by calculating the average expression. |
| Page: 1 |
Top |
Somatic mutation of malignant transformation related genes |
| Annotation of somatic variants for genes involved in malignant transformation |
| Hugo Symbol | Variant Class | Variant Classification | dbSNP RS | HGVSc | HGVSp | HGVSp Short | SWISSPROT | BIOTYPE | SIFT | PolyPhen | Tumor Sample Barcode | Tissue | Histology | Sex | Age | Stage | Therapy Types | Drugs | Outcome |
| TPP1 | SNV | Missense_Mutation | c.508G>A | p.Val170Met | p.V170M | O14773 | protein_coding | deleterious(0) | probably_damaging(0.99) | TCGA-A2-A0EM-01 | Breast | breast invasive carcinoma | Female | >=65 | I/II | Hormone Therapy | tamoxiphen | SD | |
| TPP1 | SNV | Missense_Mutation | c.1514N>T | p.Pro505Leu | p.P505L | O14773 | protein_coding | deleterious(0) | probably_damaging(1) | TCGA-A8-A079-01 | Breast | breast invasive carcinoma | Female | >=65 | III/IV | Chemotherapy | 5-fluorouracil | SD | |
| TPP1 | SNV | Missense_Mutation | novel | c.312N>T | p.Leu104Phe | p.L104F | O14773 | protein_coding | deleterious(0.05) | benign(0.165) | TCGA-BH-A0BZ-01 | Breast | breast invasive carcinoma | Female | <65 | III/IV | Chemotherapy | doxorubicin | CR |
| TPP1 | SNV | Missense_Mutation | rs149529997 | c.1526N>G | p.Gln509Arg | p.Q509R | O14773 | protein_coding | tolerated(0.12) | benign(0) | TCGA-D8-A1XK-01 | Breast | breast invasive carcinoma | Female | <65 | I/II | Chemotherapy | doxorubicine+cyclophosphamide | SD |
| TPP1 | SNV | Missense_Mutation | rs778410642 | c.802N>T | p.Arg268Trp | p.R268W | O14773 | protein_coding | deleterious(0.02) | possibly_damaging(0.812) | TCGA-D8-A1XQ-01 | Breast | breast invasive carcinoma | Female | >=65 | I/II | Unknown | Unknown | SD |
| TPP1 | SNV | Missense_Mutation | rs769487055 | c.1279A>T | p.Thr427Ser | p.T427S | O14773 | protein_coding | tolerated(0.84) | benign(0) | TCGA-E2-A14S-01 | Breast | breast invasive carcinoma | Female | >=65 | I/II | Chemotherapy | cytoxan | SD |
| TPP1 | SNV | Missense_Mutation | rs368914445 | c.1123C>T | p.Arg375Cys | p.R375C | O14773 | protein_coding | tolerated(0.06) | probably_damaging(0.99) | TCGA-AA-3833-01 | Colorectum | colon adenocarcinoma | Female | <65 | I/II | Unknown | Unknown | SD |
| TPP1 | SNV | Missense_Mutation | rs140176031 | c.776N>A | p.Arg259His | p.R259H | O14773 | protein_coding | tolerated(0.09) | benign(0.003) | TCGA-AA-A024-01 | Colorectum | colon adenocarcinoma | Male | >=65 | I/II | Unknown | Unknown | SD |
| TPP1 | SNV | Missense_Mutation | c.1157N>A | p.Thr386Asn | p.T386N | O14773 | protein_coding | deleterious(0.02) | probably_damaging(0.996) | TCGA-AD-6964-01 | Colorectum | colon adenocarcinoma | Male | <65 | III/IV | Chemotherapy | folfox | PD | |
| TPP1 | SNV | Missense_Mutation | c.800N>C | p.Gly267Ala | p.G267A | O14773 | protein_coding | tolerated(0.13) | benign(0.14) | TCGA-AD-A5EJ-01 | Colorectum | colon adenocarcinoma | Female | >=65 | I/II | Unknown | Unknown | SD |
| Page: 1 2 3 4 5 6 |
Top |
Related drugs of malignant transformation related genes |
| Identification of chemicals and drugs interact with genes involved in malignant transfromation |
| (DGIdb 4.0) |
| Entrez ID | Symbol | Category | Interaction Types | Drug Claim Name | Drug Name | PMIDs |
| 1200 | TPP1 | PROTEASE, ENZYME, DRUGGABLE GENOME | Cerliponase Alfa | |||
| 1200 | TPP1 | PROTEASE, ENZYME, DRUGGABLE GENOME | cerliponase alfa | |||
| 1200 | TPP1 | PROTEASE, ENZYME, DRUGGABLE GENOME | Cerliponase Alfa |
| Page: 1 |

Copyright 2023-Present -The University of Texas Health Science Center at Houston |