
|
|||||
|
 | |
| |
| |
| |
| |
| |
|
Gene: TOB1 |
Gene summary for TOB1 |
| Gene information | Species | Human | Gene symbol | TOB1 | Gene ID | 10140 |
| Gene name | transducer of ERBB2, 1 | |
| Gene Alias | APRO5 | |
| Cytomap | 17q21.33 | |
| Gene Type | protein-coding | GO ID | GO:0000288 | UniProtAcc | P50616 |
Top |
Malignant transformation analysis |
| Identification of the aberrant gene expression in precancerous and cancerous lesions by comparing the gene expression of stem-like cells in diseased tissues with normal stem cells |
| Entrez ID | Symbol | Replicates | Species | Organ | Tissue | Adj P-value | Log2FC | Malignancy |
| 10140 | TOB1 | GSM4909286 | Human | Breast | IDC | 4.03e-07 | 2.26e-01 | 0.1081 |
| 10140 | TOB1 | GSM4909290 | Human | Breast | IDC | 4.51e-04 | 3.26e-01 | 0.2096 |
| 10140 | TOB1 | GSM4909291 | Human | Breast | IDC | 6.22e-11 | 5.83e-01 | 0.1753 |
| 10140 | TOB1 | GSM4909293 | Human | Breast | IDC | 1.43e-05 | 2.50e-01 | 0.1581 |
| 10140 | TOB1 | GSM4909295 | Human | Breast | IDC | 1.92e-05 | 5.10e-01 | 0.0898 |
| 10140 | TOB1 | GSM4909296 | Human | Breast | IDC | 5.97e-08 | -3.04e-01 | 0.1524 |
| 10140 | TOB1 | GSM4909297 | Human | Breast | IDC | 1.57e-11 | 2.49e-01 | 0.1517 |
| 10140 | TOB1 | GSM4909298 | Human | Breast | IDC | 9.28e-09 | 4.17e-01 | 0.1551 |
| 10140 | TOB1 | GSM4909299 | Human | Breast | IDC | 2.87e-07 | 3.91e-01 | 0.035 |
| 10140 | TOB1 | GSM4909305 | Human | Breast | IDC | 5.16e-08 | 4.41e-01 | 0.0436 |
| 10140 | TOB1 | GSM4909308 | Human | Breast | IDC | 5.77e-08 | 3.59e-01 | 0.158 |
| 10140 | TOB1 | GSM4909311 | Human | Breast | IDC | 7.41e-16 | -2.80e-01 | 0.1534 |
| 10140 | TOB1 | GSM4909312 | Human | Breast | IDC | 6.04e-05 | 2.37e-01 | 0.1552 |
| 10140 | TOB1 | GSM4909313 | Human | Breast | IDC | 1.51e-07 | 4.55e-01 | 0.0391 |
| 10140 | TOB1 | GSM4909315 | Human | Breast | IDC | 6.27e-03 | -2.44e-01 | 0.21 |
| 10140 | TOB1 | GSM4909317 | Human | Breast | IDC | 1.92e-05 | 3.23e-01 | 0.1355 |
| 10140 | TOB1 | GSM4909319 | Human | Breast | IDC | 4.47e-22 | -1.35e-01 | 0.1563 |
| 10140 | TOB1 | GSM4909321 | Human | Breast | IDC | 6.13e-07 | 2.20e-01 | 0.1559 |
| 10140 | TOB1 | brca1 | Human | Breast | Precancer | 3.91e-04 | -3.04e-01 | -0.0338 |
| 10140 | TOB1 | brca2 | Human | Breast | Precancer | 2.98e-02 | -1.55e-01 | -0.024 |
| Page: 1 2 3 4 5 6 7 8 9 10 |
| Tissue | Expression Dynamics | Abbreviation |
| Breast |  | IDC: Invasive ductal carcinoma |
| DCIS: Ductal carcinoma in situ | ||
| Precancer(BRCA1-mut): Precancerous lesion from BRCA1 mutation carriers | ||
| Cervix | 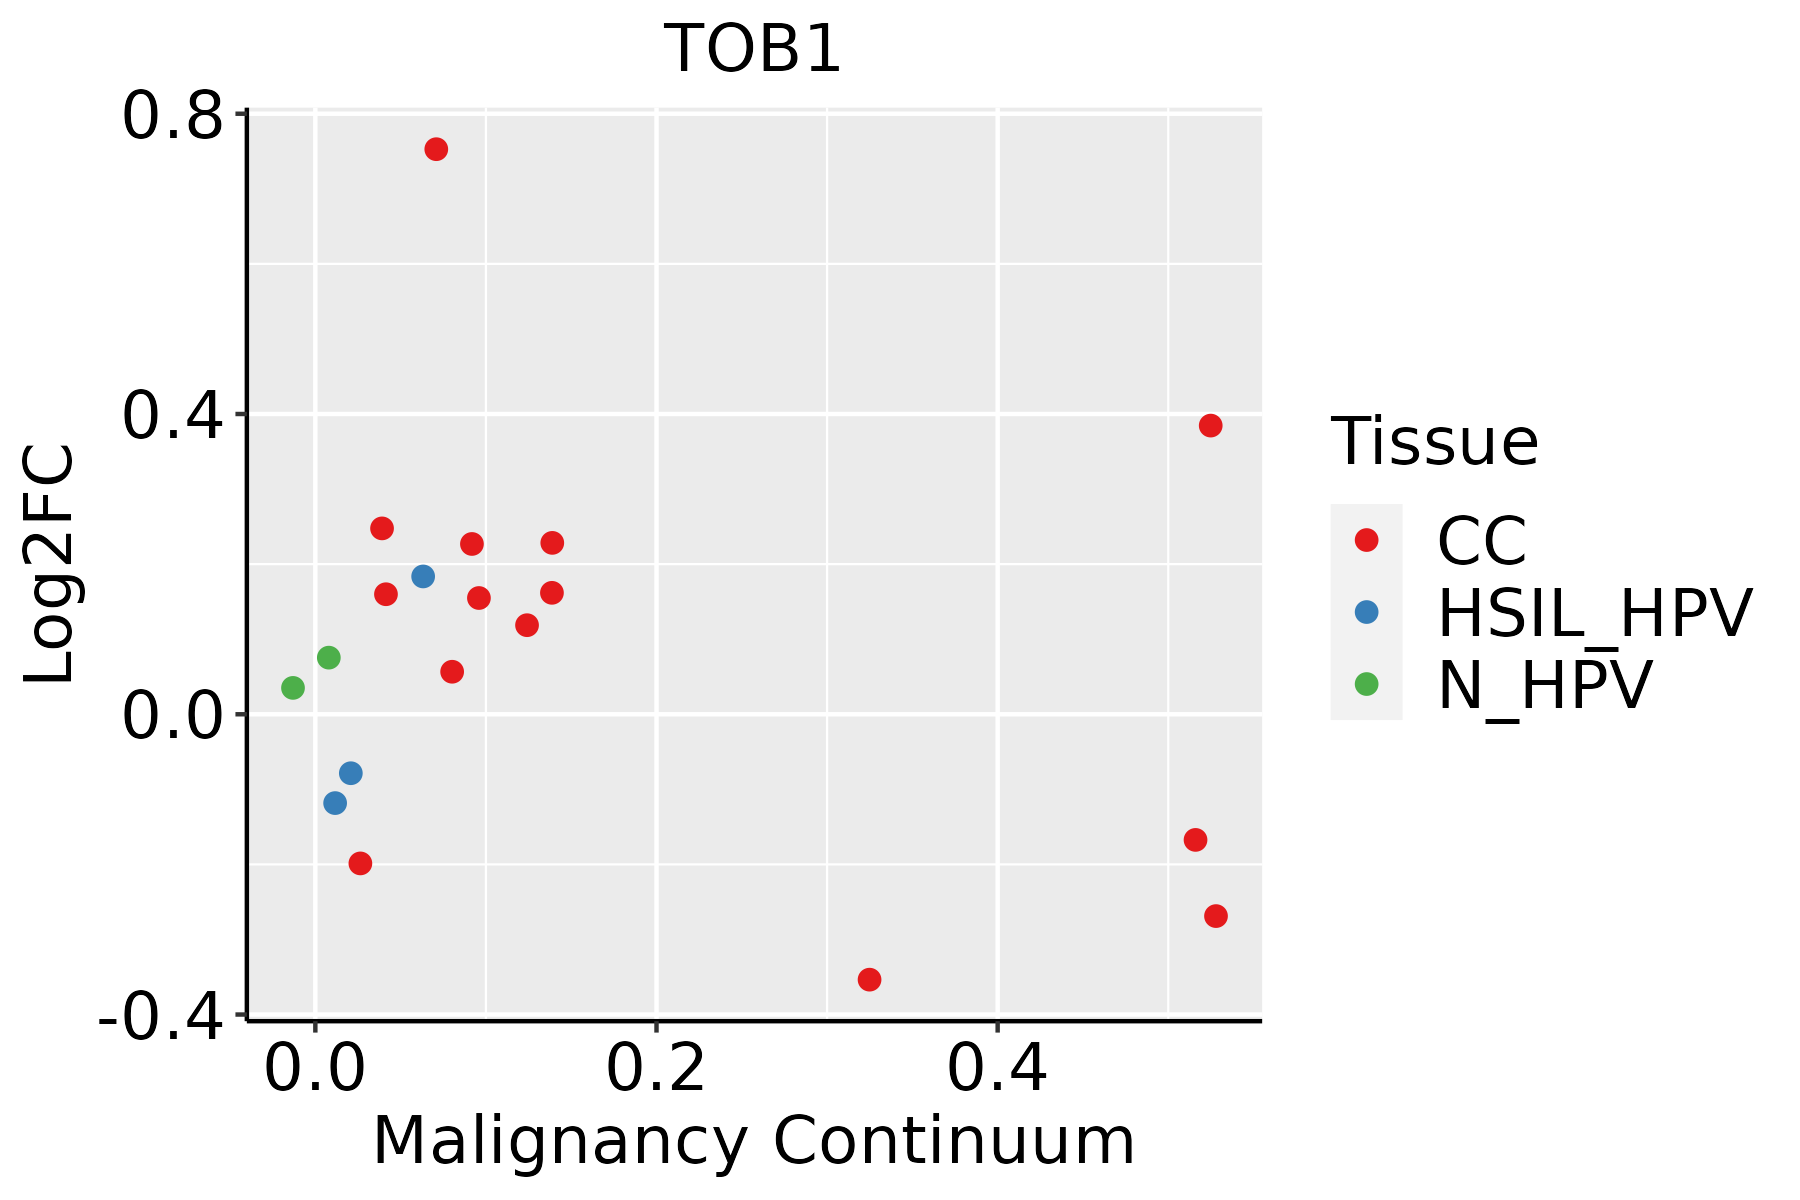 | CC: Cervix cancer |
| HSIL_HPV: HPV-infected high-grade squamous intraepithelial lesions | ||
| N_HPV: HPV-infected normal cervix | ||
| Colorectum (GSE201348) |  | FAP: Familial adenomatous polyposis |
| CRC: Colorectal cancer | ||
| Colorectum (HTA11) |  | AD: Adenomas |
| SER: Sessile serrated lesions | ||
| MSI-H: Microsatellite-high colorectal cancer | ||
| MSS: Microsatellite stable colorectal cancer | ||
| Esophagus |  | ESCC: Esophageal squamous cell carcinoma |
| HGIN: High-grade intraepithelial neoplasias | ||
| LGIN: Low-grade intraepithelial neoplasias | ||
| Liver |  | HCC: Hepatocellular carcinoma |
| NAFLD: Non-alcoholic fatty liver disease | ||
| Oral Cavity | 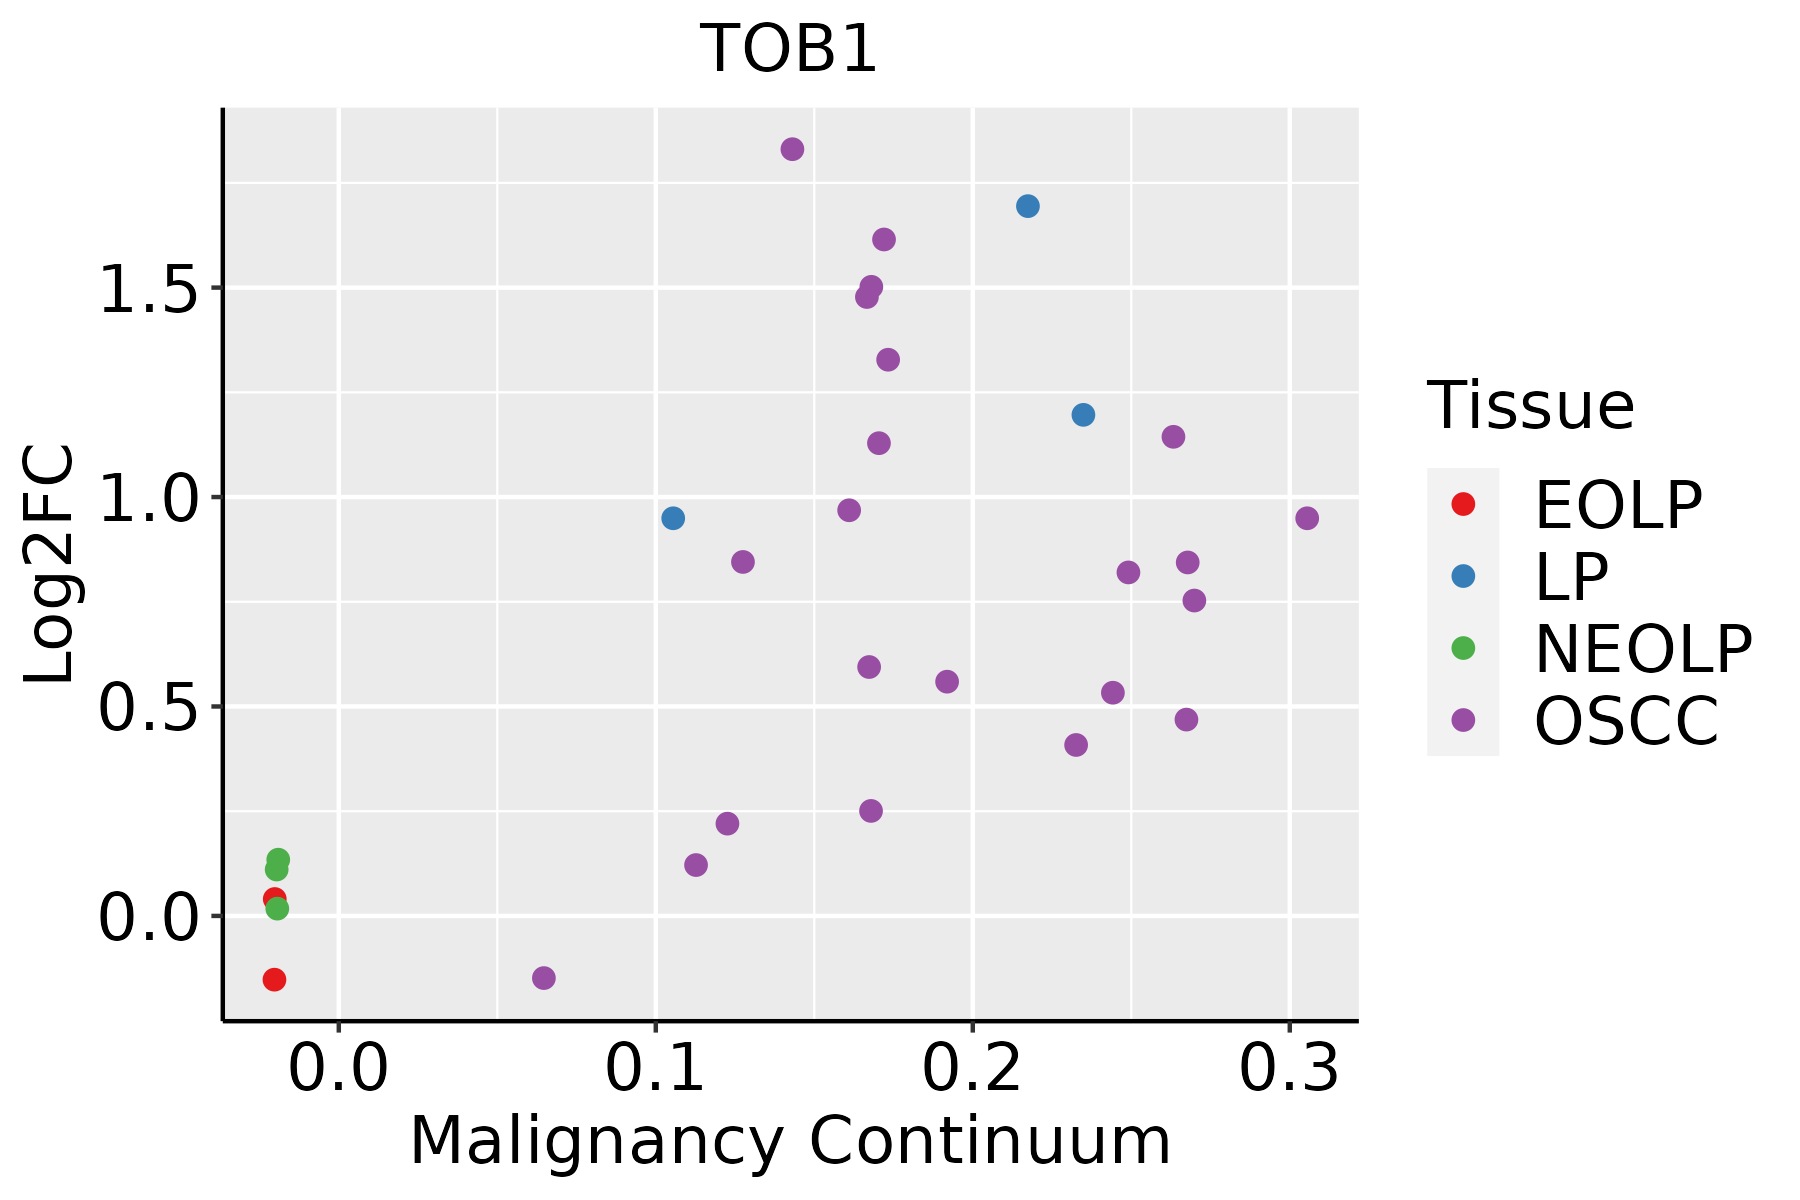 | EOLP: Erosive Oral lichen planus |
| LP: leukoplakia | ||
| NEOLP: Non-erosive oral lichen planus | ||
| OSCC: Oral squamous cell carcinoma | ||
| Prostate | 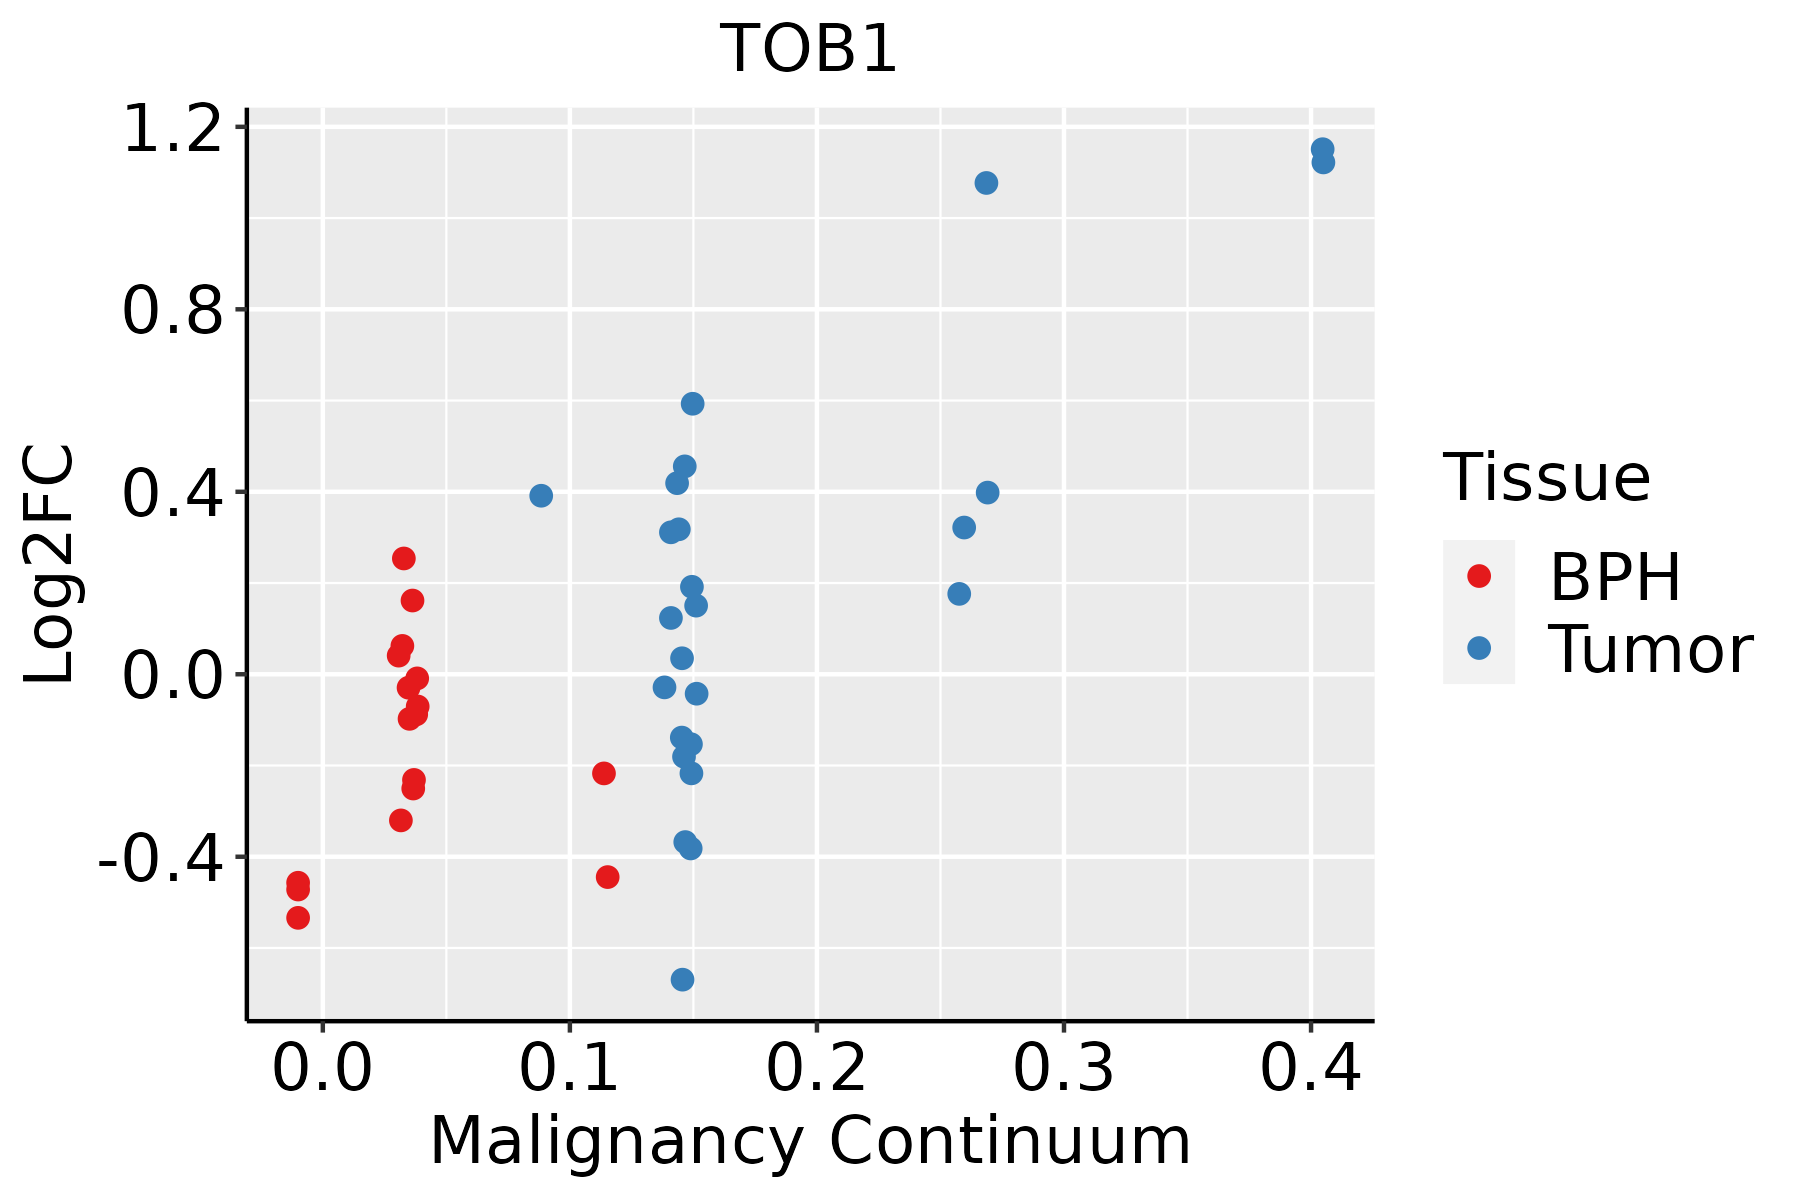 | BPH: Benign Prostatic Hyperplasia |
| Skin |  | AK: Actinic keratosis |
| cSCC: Cutaneous squamous cell carcinoma | ||
| SCCIS:squamous cell carcinoma in situ | ||
| Thyroid | 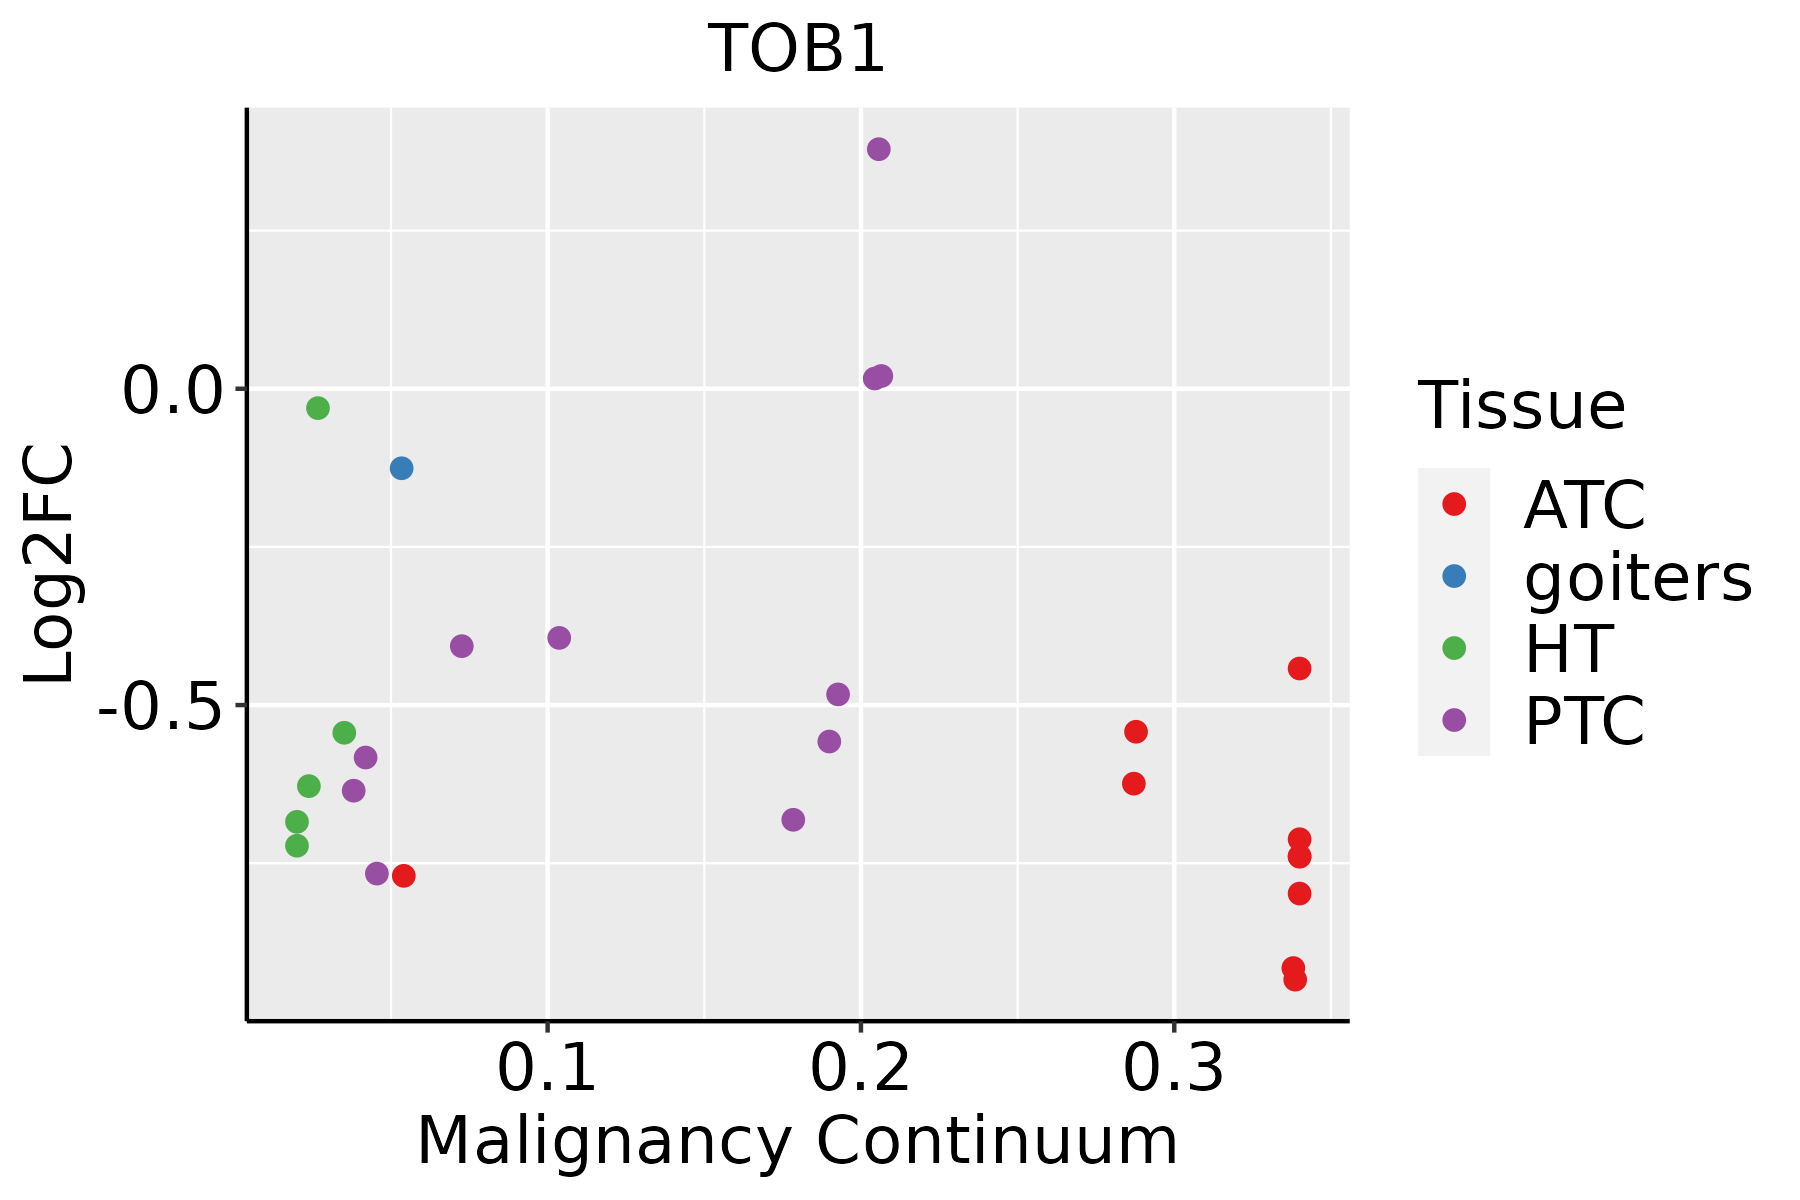 | ATC: Anaplastic thyroid cancer |
| HT: Hashimoto's thyroiditis | ||
| PTC: Papillary thyroid cancer |
| ∗log2FC in expression of this searched gene in stem-like cells from each diseased tissue sample relative to stem-like cells in normal samples in each tissue plotted against the malignancy continuum. Samples are colored based on if they are from different disease stage. |
Top |
Malignant transformation related pathway analysis |
| Find out the enriched GO biological processes and KEGG pathways involved in transition from healthy to precancer to cancer |
| Tissue | Disease Stage | Enriched GO biological Processes |
| Colorectum | AD |  |
| Colorectum | SER |  |
| Colorectum | MSS |  |
| Colorectum | MSI-H |  |
| Colorectum | FAP |  |
| ∗Top 15 enriched GO BP terms are showed in the bar plot of each disease state in each tissue. Each row represents a significant GO biological process which is colored according to the -log10(p.adjust). |
| Page: 1 2 3 4 5 6 7 8 9 |
| GO ID | Tissue | Disease Stage | Description | Gene Ratio | Bg Ratio | pvalue | p.adjust | Count |
| GO:00016492 | Colorectum | MSS | osteoblast differentiation | 64/3467 | 229/18723 | 2.91e-04 | 3.83e-03 | 64 |
| GO:19001531 | Colorectum | MSS | positive regulation of nuclear-transcribed mRNA catabolic process, deadenylation-dependent decay | 9/3467 | 15/18723 | 4.29e-04 | 5.23e-03 | 9 |
| GO:00603901 | Colorectum | MSS | regulation of SMAD protein signal transduction | 14/3467 | 31/18723 | 5.98e-04 | 6.60e-03 | 14 |
| GO:00002881 | Colorectum | MSS | nuclear-transcribed mRNA catabolic process, deadenylation-dependent decay | 21/3467 | 56/18723 | 6.51e-04 | 7.06e-03 | 21 |
| GO:0017148 | Colorectum | MSS | negative regulation of translation | 64/3467 | 245/18723 | 1.94e-03 | 1.67e-02 | 64 |
| GO:0034249 | Colorectum | MSS | negative regulation of cellular amide metabolic process | 70/3467 | 273/18723 | 2.07e-03 | 1.76e-02 | 70 |
| GO:00071781 | Colorectum | MSS | transmembrane receptor protein serine/threonine kinase signaling pathway | 86/3467 | 355/18723 | 4.04e-03 | 2.95e-02 | 86 |
| GO:00015032 | Colorectum | MSS | ossification | 96/3467 | 408/18723 | 6.09e-03 | 4.07e-02 | 96 |
| GO:0009896111 | Esophagus | ESCC | positive regulation of catabolic process | 332/8552 | 492/18723 | 4.36e-23 | 9.22e-21 | 332 |
| GO:0031331111 | Esophagus | ESCC | positive regulation of cellular catabolic process | 292/8552 | 427/18723 | 8.67e-22 | 1.53e-19 | 292 |
| GO:1903311110 | Esophagus | ESCC | regulation of mRNA metabolic process | 210/8552 | 288/18723 | 3.25e-21 | 5.56e-19 | 210 |
| GO:0006401110 | Esophagus | ESCC | RNA catabolic process | 204/8552 | 278/18723 | 3.39e-21 | 5.66e-19 | 204 |
| GO:0034655110 | Esophagus | ESCC | nucleobase-containing compound catabolic process | 272/8552 | 407/18723 | 2.92e-18 | 2.90e-16 | 272 |
| GO:0006402110 | Esophagus | ESCC | mRNA catabolic process | 170/8552 | 232/18723 | 8.70e-18 | 8.00e-16 | 170 |
| GO:0006417111 | Esophagus | ESCC | regulation of translation | 304/8552 | 468/18723 | 1.53e-17 | 1.33e-15 | 304 |
| GO:004670018 | Esophagus | ESCC | heterocycle catabolic process | 286/8552 | 445/18723 | 1.12e-15 | 7.47e-14 | 286 |
| GO:0045727111 | Esophagus | ESCC | positive regulation of translation | 107/8552 | 136/18723 | 2.79e-15 | 1.68e-13 | 107 |
| GO:004427019 | Esophagus | ESCC | cellular nitrogen compound catabolic process | 288/8552 | 451/18723 | 3.03e-15 | 1.79e-13 | 288 |
| GO:0034250111 | Esophagus | ESCC | positive regulation of cellular amide metabolic process | 123/8552 | 162/18723 | 3.32e-15 | 1.93e-13 | 123 |
| GO:001943918 | Esophagus | ESCC | aromatic compound catabolic process | 295/8552 | 467/18723 | 1.09e-14 | 5.98e-13 | 295 |
| Page: 1 2 3 4 5 6 7 8 9 10 11 12 13 14 15 16 17 18 19 20 21 22 23 24 25 26 27 28 29 30 31 |
| Pathway ID | Tissue | Disease Stage | Description | Gene Ratio | Bg Ratio | pvalue | p.adjust | qvalue | Count |
| hsa030186 | Breast | Precancer | RNA degradation | 14/684 | 79/8465 | 3.97e-03 | 2.37e-02 | 1.81e-02 | 14 |
| hsa0301811 | Breast | Precancer | RNA degradation | 14/684 | 79/8465 | 3.97e-03 | 2.37e-02 | 1.81e-02 | 14 |
| hsa0301821 | Breast | IDC | RNA degradation | 16/867 | 79/8465 | 5.65e-03 | 3.13e-02 | 2.34e-02 | 16 |
| hsa0301831 | Breast | IDC | RNA degradation | 16/867 | 79/8465 | 5.65e-03 | 3.13e-02 | 2.34e-02 | 16 |
| hsa030184 | Breast | DCIS | RNA degradation | 16/846 | 79/8465 | 4.45e-03 | 2.46e-02 | 1.82e-02 | 16 |
| hsa030185 | Breast | DCIS | RNA degradation | 16/846 | 79/8465 | 4.45e-03 | 2.46e-02 | 1.82e-02 | 16 |
| hsa0301824 | Esophagus | ESCC | RNA degradation | 62/4205 | 79/8465 | 1.18e-07 | 9.39e-07 | 4.81e-07 | 62 |
| hsa0301834 | Esophagus | ESCC | RNA degradation | 62/4205 | 79/8465 | 1.18e-07 | 9.39e-07 | 4.81e-07 | 62 |
| hsa03018 | Liver | Cirrhotic | RNA degradation | 44/2530 | 79/8465 | 1.43e-06 | 1.65e-05 | 1.02e-05 | 44 |
| hsa030181 | Liver | Cirrhotic | RNA degradation | 44/2530 | 79/8465 | 1.43e-06 | 1.65e-05 | 1.02e-05 | 44 |
| hsa030182 | Liver | HCC | RNA degradation | 58/4020 | 79/8465 | 2.29e-06 | 2.19e-05 | 1.22e-05 | 58 |
| hsa030183 | Liver | HCC | RNA degradation | 58/4020 | 79/8465 | 2.29e-06 | 2.19e-05 | 1.22e-05 | 58 |
| hsa030189 | Oral cavity | OSCC | RNA degradation | 59/3704 | 79/8465 | 2.05e-08 | 1.91e-07 | 9.70e-08 | 59 |
| hsa0301814 | Oral cavity | OSCC | RNA degradation | 59/3704 | 79/8465 | 2.05e-08 | 1.91e-07 | 9.70e-08 | 59 |
| hsa0301823 | Oral cavity | LP | RNA degradation | 39/2418 | 79/8465 | 6.98e-05 | 4.38e-04 | 2.83e-04 | 39 |
| hsa0301833 | Oral cavity | LP | RNA degradation | 39/2418 | 79/8465 | 6.98e-05 | 4.38e-04 | 2.83e-04 | 39 |
| hsa030188 | Prostate | BPH | RNA degradation | 29/1718 | 79/8465 | 5.17e-04 | 2.67e-03 | 1.65e-03 | 29 |
| hsa0301813 | Prostate | BPH | RNA degradation | 29/1718 | 79/8465 | 5.17e-04 | 2.67e-03 | 1.65e-03 | 29 |
| hsa0301822 | Prostate | Tumor | RNA degradation | 30/1791 | 79/8465 | 4.48e-04 | 2.35e-03 | 1.46e-03 | 30 |
| hsa0301832 | Prostate | Tumor | RNA degradation | 30/1791 | 79/8465 | 4.48e-04 | 2.35e-03 | 1.46e-03 | 30 |
| Page: 1 |
Top |
Cell-cell communication analysis |
| Identification of potential cell-cell interactions between two cell types and their ligand-receptor pairs for different disease states |
| Ligand | Receptor | LRpair | Pathway | Tissue | Disease Stage |
| Page: 1 |
Top |
Single-cell gene regulatory network inference analysis |
| Find out the significant the regulons (TFs) and the target genes of each regulon across cell types for different disease states |
| TF | Cell Type | Tissue | Disease Stage | Target Gene | RSS | Regulon Activity |
| ∗The dot plots of a searched regulon are shown for all cell subpopulations in each disease state of each tissue based on the regulon specific score inferred using pySCENIC and by calculating the average expression. |
| Page: 1 |
Top |
Somatic mutation of malignant transformation related genes |
| Annotation of somatic variants for genes involved in malignant transformation |
| Hugo Symbol | Variant Class | Variant Classification | dbSNP RS | HGVSc | HGVSp | HGVSp Short | SWISSPROT | BIOTYPE | SIFT | PolyPhen | Tumor Sample Barcode | Tissue | Histology | Sex | Age | Stage | Therapy Types | Drugs | Outcome |
| TOB1 | SNV | Missense_Mutation | rs752909817 | c.247N>T | p.Arg83Cys | p.R83C | P50616 | protein_coding | deleterious(0) | probably_damaging(0.994) | TCGA-AC-A23H-01 | Breast | breast invasive carcinoma | Female | >=65 | I/II | Unknown | Unknown | PD |
| TOB1 | SNV | Missense_Mutation | c.332N>C | p.Val111Ala | p.V111A | P50616 | protein_coding | deleterious(0) | probably_damaging(0.93) | TCGA-AN-A0FZ-01 | Breast | breast invasive carcinoma | Female | <65 | III/IV | Unknown | Unknown | SD | |
| TOB1 | SNV | Missense_Mutation | c.299N>A | p.Ser100Tyr | p.S100Y | P50616 | protein_coding | deleterious(0) | probably_damaging(0.957) | TCGA-BH-A18R-01 | Breast | breast invasive carcinoma | Female | <65 | I/II | Unknown | Unknown | SD | |
| TOB1 | SNV | Missense_Mutation | c.283N>C | p.Asp95His | p.D95H | P50616 | protein_coding | deleterious(0) | probably_damaging(0.999) | TCGA-D8-A1JA-01 | Breast | breast invasive carcinoma | Female | <65 | III/IV | Chemotherapy | adriamycin | PD | |
| TOB1 | SNV | Missense_Mutation | c.10N>C | p.Glu4Gln | p.E4Q | P50616 | protein_coding | deleterious(0) | probably_damaging(0.998) | TCGA-D8-A1JA-01 | Breast | breast invasive carcinoma | Female | <65 | III/IV | Chemotherapy | adriamycin | PD | |
| TOB1 | SNV | Missense_Mutation | rs777982053 | c.623A>G | p.Asn208Ser | p.N208S | P50616 | protein_coding | tolerated(0.4) | benign(0.026) | TCGA-D8-A1XK-01 | Breast | breast invasive carcinoma | Female | <65 | I/II | Chemotherapy | doxorubicine+cyclophosphamide | SD |
| TOB1 | SNV | Missense_Mutation | c.440N>T | p.Ser147Leu | p.S147L | P50616 | protein_coding | tolerated(0.14) | benign(0.018) | TCGA-EW-A1IX-01 | Breast | breast invasive carcinoma | Female | <65 | I/II | Hormone Therapy | femara | SD | |
| TOB1 | insertion | Frame_Shift_Ins | novel | c.257_258insCTCCAGTACAGTAATGCCTTTGATGTGTTTGCAGCCTATGGAGG | p.Pro87SerfsTer38 | p.P87Sfs*38 | P50616 | protein_coding | TCGA-A2-A0CX-01 | Breast | breast invasive carcinoma | Female | <65 | I/II | Chemotherapy | adriamycin | SD | ||
| TOB1 | insertion | In_Frame_Ins | novel | c.276_277insAGTGTT | p.Ser91_Val92dup | p.S91_V92dup | P50616 | protein_coding | TCGA-A7-A26H-01 | Breast | breast invasive carcinoma | Female | >=65 | I/II | Hormone Therapy | anastrozole | PD | ||
| TOB1 | insertion | Frame_Shift_Ins | novel | c.330_331insCAGAAAGCCATCTCTTCCTCAAT | p.Val111GlnfsTer40 | p.V111Qfs*40 | P50616 | protein_coding | TCGA-AN-A0FZ-01 | Breast | breast invasive carcinoma | Female | <65 | III/IV | Unknown | Unknown | SD |
| Page: 1 2 3 4 |
Top |
Related drugs of malignant transformation related genes |
| Identification of chemicals and drugs interact with genes involved in malignant transfromation |
| (DGIdb 4.0) |
| Entrez ID | Symbol | Category | Interaction Types | Drug Claim Name | Drug Name | PMIDs |
| 10140 | TOB1 | NA | STEROID HORMONE | 15664454 |
| Page: 1 |

Copyright 2023-Present -The University of Texas Health Science Center at Houston |