
|
|||||
|
 | |
| |
| |
| |
| |
| |
|
Gene: SYT7 |
Gene summary for SYT7 |
| Gene information | Species | Human | Gene symbol | SYT7 | Gene ID | 9066 |
| Gene name | synaptotagmin 7 | |
| Gene Alias | IPCA-7 | |
| Cytomap | 11q12.2 | |
| Gene Type | protein-coding | GO ID | GO:0001505 | UniProtAcc | O43581 |
Top |
Malignant transformation analysis |
| Identification of the aberrant gene expression in precancerous and cancerous lesions by comparing the gene expression of stem-like cells in diseased tissues with normal stem cells |
| Entrez ID | Symbol | Replicates | Species | Organ | Tissue | Adj P-value | Log2FC | Malignancy |
| 9066 | SYT7 | HTA11_78_2000001011 | Human | Colorectum | AD | 2.21e-04 | 2.55e-01 | -0.1088 |
| 9066 | SYT7 | HTA11_411_2000001011 | Human | Colorectum | SER | 1.29e-05 | 7.31e-01 | -0.2602 |
| 9066 | SYT7 | HTA11_2112_2000001011 | Human | Colorectum | SER | 3.83e-04 | 4.09e-01 | -0.2196 |
| 9066 | SYT7 | HTA11_3361_2000001011 | Human | Colorectum | AD | 3.43e-03 | 1.65e-01 | -0.1207 |
| 9066 | SYT7 | HTA11_866_3004761011 | Human | Colorectum | AD | 8.49e-04 | 8.53e-02 | 0.096 |
| 9066 | SYT7 | HTA11_10711_2000001011 | Human | Colorectum | AD | 7.45e-03 | 1.29e-01 | 0.0338 |
| 9066 | SYT7 | HTA11_99999970781_79442 | Human | Colorectum | MSS | 1.44e-05 | 2.30e-01 | 0.294 |
| 9066 | SYT7 | HTA11_99999965104_69814 | Human | Colorectum | MSS | 1.98e-04 | 1.65e-01 | 0.281 |
| 9066 | SYT7 | HTA11_99999971662_82457 | Human | Colorectum | MSS | 4.94e-29 | 6.45e-01 | 0.3859 |
| 9066 | SYT7 | HTA11_99999974143_84620 | Human | Colorectum | MSS | 3.17e-30 | 5.94e-01 | 0.3005 |
| 9066 | SYT7 | A002-C-021 | Human | Colorectum | FAP | 4.63e-03 | 1.46e-01 | 0.1171 |
| 9066 | SYT7 | A001-C-007 | Human | Colorectum | CRC | 9.19e-03 | 3.15e-01 | 0.1899 |
| 9066 | SYT7 | CRC-3-11773 | Human | Colorectum | CRC | 3.19e-02 | 2.03e-01 | 0.2564 |
| 9066 | SYT7 | P26T-E | Human | Esophagus | ESCC | 3.52e-02 | 1.63e-02 | 0.1276 |
| 9066 | SYT7 | P28T-E | Human | Esophagus | ESCC | 3.49e-08 | 9.54e-02 | 0.1149 |
| 9066 | SYT7 | P37T-E | Human | Esophagus | ESCC | 2.95e-26 | 6.38e-01 | 0.1371 |
| 9066 | SYT7 | P44T-E | Human | Esophagus | ESCC | 9.23e-06 | 2.12e-01 | 0.1096 |
| 9066 | SYT7 | P47T-E | Human | Esophagus | ESCC | 4.94e-04 | 3.26e-02 | 0.1067 |
| 9066 | SYT7 | P74T-E | Human | Esophagus | ESCC | 1.24e-03 | 1.41e-01 | 0.1479 |
| 9066 | SYT7 | P75T-E | Human | Esophagus | ESCC | 5.42e-03 | 5.64e-02 | 0.1125 |
| Page: 1 2 3 |
| Tissue | Expression Dynamics | Abbreviation |
| Colorectum (GSE201348) |  | FAP: Familial adenomatous polyposis |
| CRC: Colorectal cancer | ||
| Colorectum (HTA11) |  | AD: Adenomas |
| SER: Sessile serrated lesions | ||
| MSI-H: Microsatellite-high colorectal cancer | ||
| MSS: Microsatellite stable colorectal cancer | ||
| Esophagus | 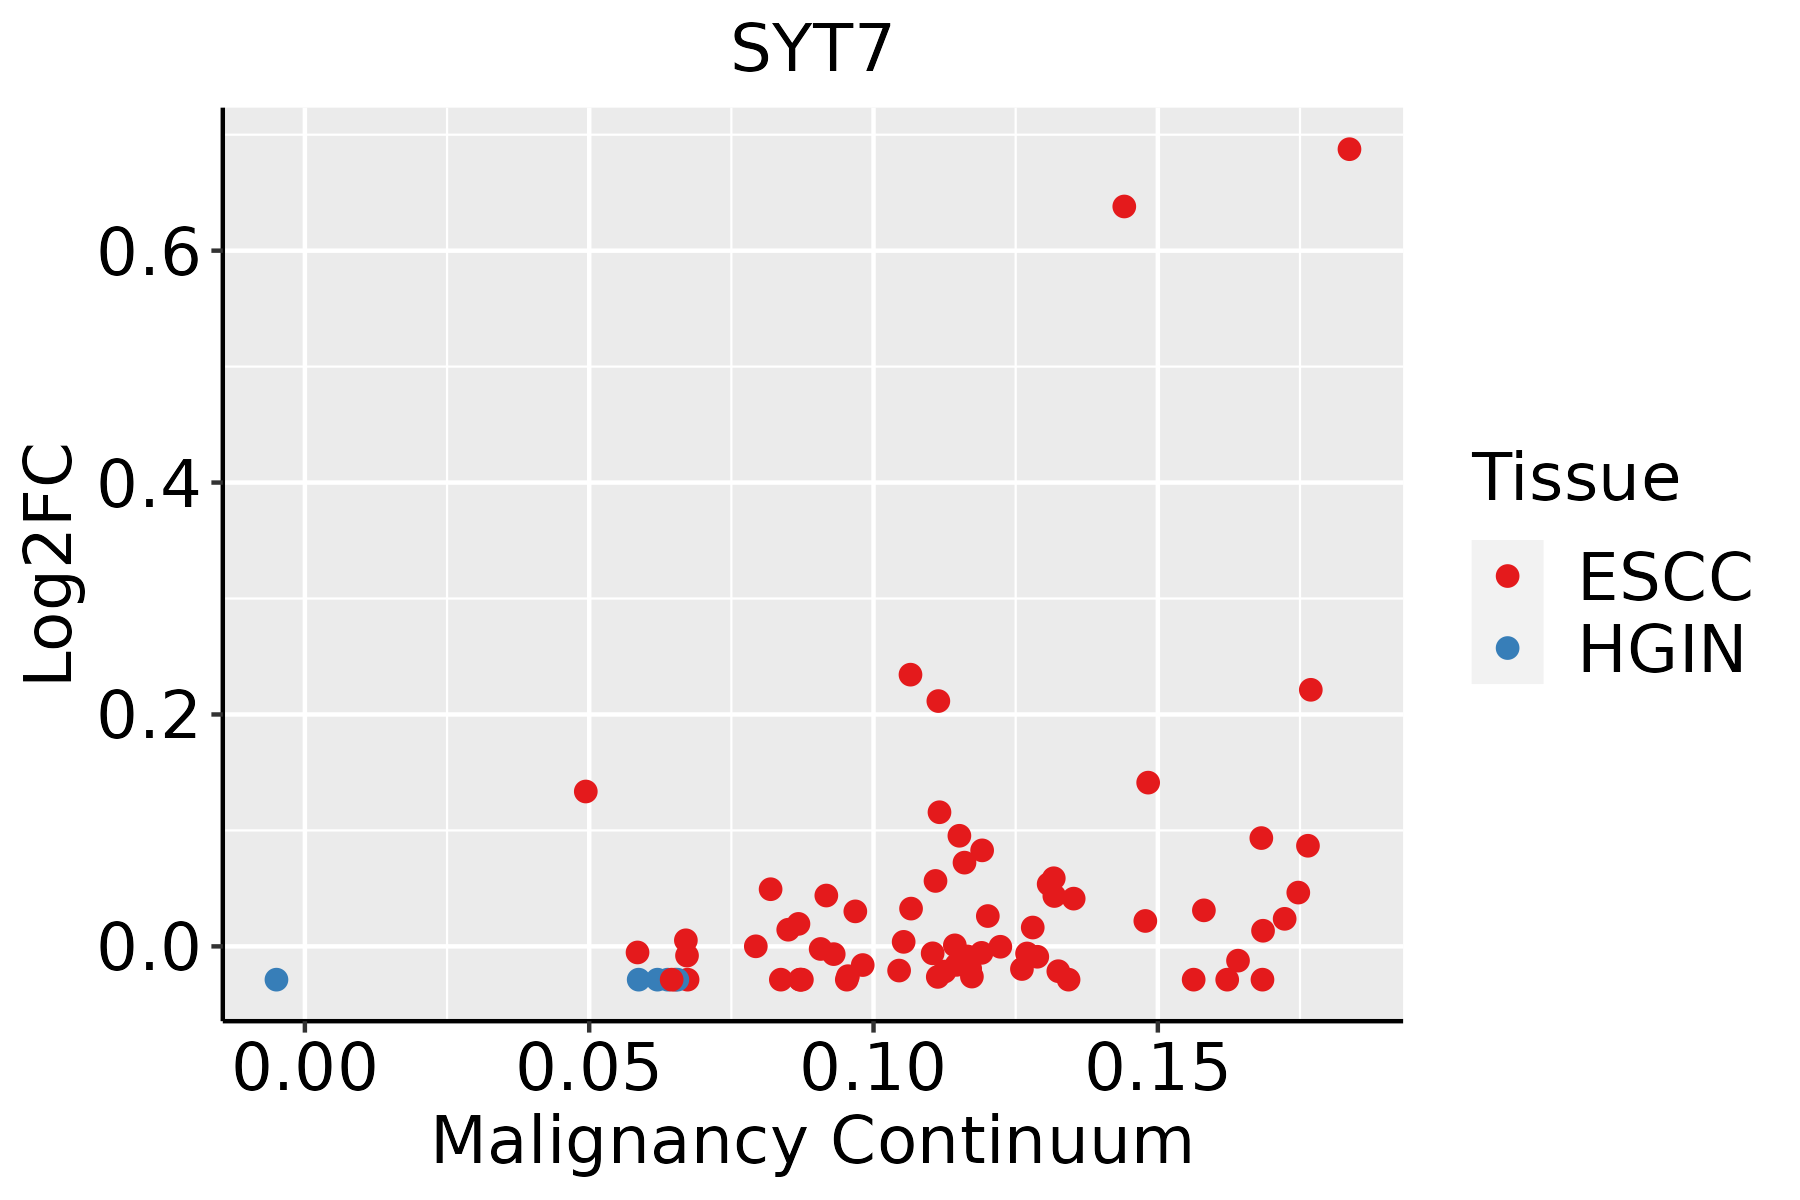 | ESCC: Esophageal squamous cell carcinoma |
| HGIN: High-grade intraepithelial neoplasias | ||
| LGIN: Low-grade intraepithelial neoplasias | ||
| Liver |  | HCC: Hepatocellular carcinoma |
| NAFLD: Non-alcoholic fatty liver disease | ||
| Prostate | 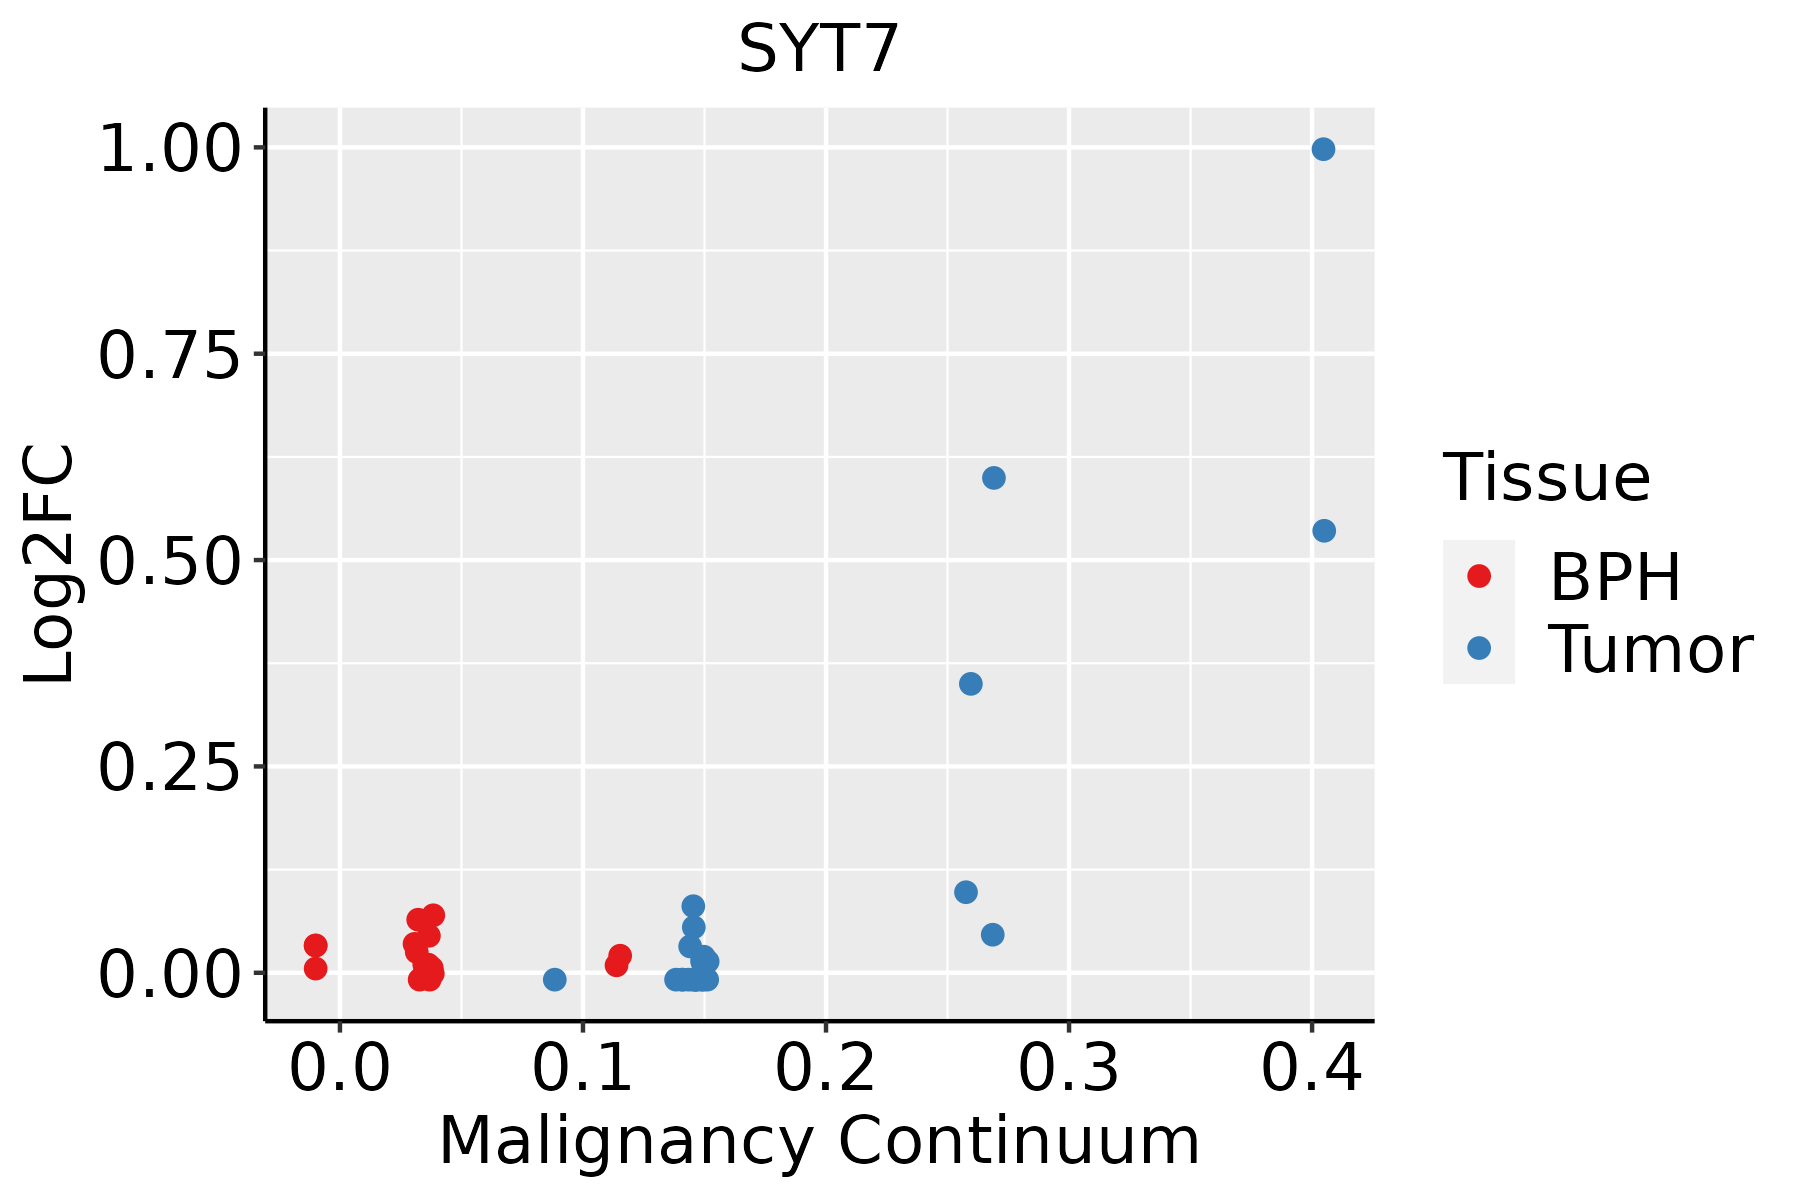 | BPH: Benign Prostatic Hyperplasia |
| Thyroid | 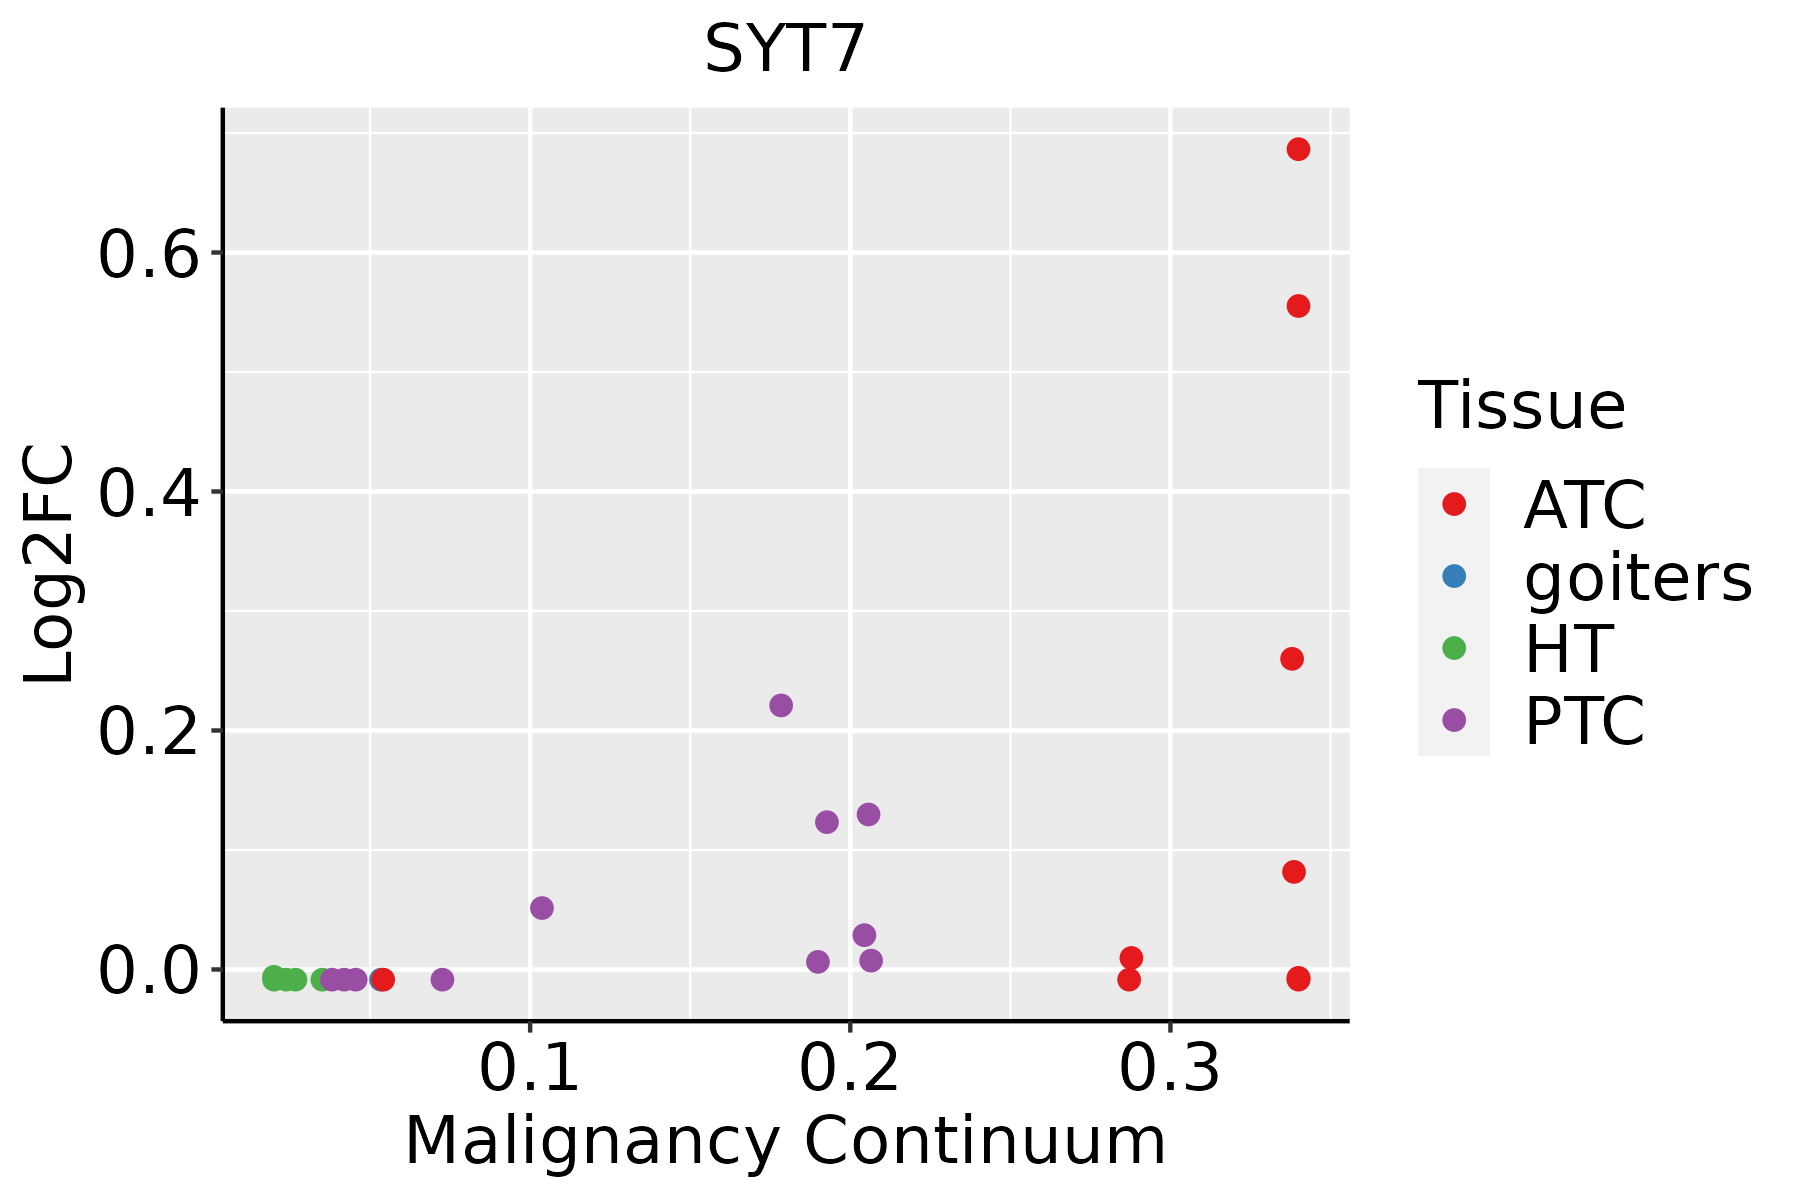 | ATC: Anaplastic thyroid cancer |
| HT: Hashimoto's thyroiditis | ||
| PTC: Papillary thyroid cancer |
| ∗log2FC in expression of this searched gene in stem-like cells from each diseased tissue sample relative to stem-like cells in normal samples in each tissue plotted against the malignancy continuum. Samples are colored based on if they are from different disease stage. |
Top |
Malignant transformation related pathway analysis |
| Find out the enriched GO biological processes and KEGG pathways involved in transition from healthy to precancer to cancer |
| Tissue | Disease Stage | Enriched GO biological Processes |
| Colorectum | AD |  |
| Colorectum | SER |  |
| Colorectum | MSS |  |
| Colorectum | MSI-H |  |
| Colorectum | FAP |  |
| ∗Top 15 enriched GO BP terms are showed in the bar plot of each disease state in each tissue. Each row represents a significant GO biological process which is colored according to the -log10(p.adjust). |
| Page: 1 2 3 4 5 6 7 8 9 |
| GO ID | Tissue | Disease Stage | Description | Gene Ratio | Bg Ratio | pvalue | p.adjust | Count |
| GO:0071241110 | Thyroid | PTC | cellular response to inorganic substance | 92/5968 | 226/18723 | 3.01e-03 | 1.49e-02 | 92 |
| GO:007169216 | Thyroid | PTC | protein localization to extracellular region | 139/5968 | 368/18723 | 8.95e-03 | 3.72e-02 | 139 |
| GO:000930618 | Thyroid | PTC | protein secretion | 135/5968 | 359/18723 | 1.16e-02 | 4.58e-02 | 135 |
| GO:003559218 | Thyroid | PTC | establishment of protein localization to extracellular region | 135/5968 | 360/18723 | 1.28e-02 | 4.95e-02 | 135 |
| GO:0071248110 | Thyroid | PTC | cellular response to metal ion | 78/5968 | 197/18723 | 1.29e-02 | 4.98e-02 | 78 |
| GO:001605023 | Thyroid | ATC | vesicle organization | 166/6293 | 300/18723 | 6.14e-15 | 3.92e-13 | 166 |
| GO:004206034 | Thyroid | ATC | wound healing | 210/6293 | 422/18723 | 3.33e-12 | 1.37e-10 | 210 |
| GO:000703322 | Thyroid | ATC | vacuole organization | 100/6293 | 180/18723 | 1.07e-09 | 2.71e-08 | 100 |
| GO:001648218 | Thyroid | ATC | cytosolic transport | 93/6293 | 168/18723 | 5.19e-09 | 1.15e-07 | 93 |
| GO:0010038210 | Thyroid | ATC | response to metal ion | 165/6293 | 373/18723 | 1.07e-05 | 1.05e-04 | 165 |
| GO:004828413 | Thyroid | ATC | organelle fusion | 71/6293 | 141/18723 | 2.83e-05 | 2.38e-04 | 71 |
| GO:000690612 | Thyroid | ATC | vesicle fusion | 54/6293 | 106/18723 | 1.67e-04 | 1.14e-03 | 54 |
| GO:009017412 | Thyroid | ATC | organelle membrane fusion | 55/6293 | 110/18723 | 2.72e-04 | 1.74e-03 | 55 |
| GO:006102511 | Thyroid | ATC | membrane fusion | 76/6293 | 163/18723 | 3.68e-04 | 2.27e-03 | 76 |
| GO:000704012 | Thyroid | ATC | lysosome organization | 39/6293 | 74/18723 | 5.41e-04 | 3.13e-03 | 39 |
| GO:008017112 | Thyroid | ATC | lytic vacuole organization | 39/6293 | 74/18723 | 5.41e-04 | 3.13e-03 | 39 |
| GO:005159225 | Thyroid | ATC | response to calcium ion | 69/6293 | 149/18723 | 8.43e-04 | 4.62e-03 | 69 |
| GO:007124124 | Thyroid | ATC | cellular response to inorganic substance | 98/6293 | 226/18723 | 1.35e-03 | 7.02e-03 | 98 |
| GO:00487715 | Thyroid | ATC | tissue remodeling | 78/6293 | 175/18723 | 1.60e-03 | 8.04e-03 | 78 |
| GO:007169223 | Thyroid | ATC | protein localization to extracellular region | 150/6293 | 368/18723 | 2.25e-03 | 1.05e-02 | 150 |
| Page: 1 2 3 4 5 6 7 8 9 10 11 12 |
| Pathway ID | Tissue | Disease Stage | Description | Gene Ratio | Bg Ratio | pvalue | p.adjust | qvalue | Count |
| Page: 1 |
Top |
Cell-cell communication analysis |
| Identification of potential cell-cell interactions between two cell types and their ligand-receptor pairs for different disease states |
| Ligand | Receptor | LRpair | Pathway | Tissue | Disease Stage |
| Page: 1 |
Top |
Single-cell gene regulatory network inference analysis |
| Find out the significant the regulons (TFs) and the target genes of each regulon across cell types for different disease states |
| TF | Cell Type | Tissue | Disease Stage | Target Gene | RSS | Regulon Activity |
| ∗The dot plots of a searched regulon are shown for all cell subpopulations in each disease state of each tissue based on the regulon specific score inferred using pySCENIC and by calculating the average expression. |
| Page: 1 |
Top |
Somatic mutation of malignant transformation related genes |
| Annotation of somatic variants for genes involved in malignant transformation |
| Hugo Symbol | Variant Class | Variant Classification | dbSNP RS | HGVSc | HGVSp | HGVSp Short | SWISSPROT | BIOTYPE | SIFT | PolyPhen | Tumor Sample Barcode | Tissue | Histology | Sex | Age | Stage | Therapy Types | Drugs | Outcome |
| SYT7 | SNV | Missense_Mutation | novel | c.1253C>T | p.Thr418Met | p.T418M | O43581 | protein_coding | tolerated(0.23) | benign(0.02) | TCGA-AC-A3W6-01 | Breast | breast invasive carcinoma | Female | >=65 | III/IV | Unknown | Unknown | SD |
| SYT7 | SNV | Missense_Mutation | c.730N>A | p.Gly244Ser | p.G244S | O43581 | protein_coding | deleterious(0) | probably_damaging(0.999) | TCGA-AQ-A1H3-01 | Breast | breast invasive carcinoma | Female | <65 | III/IV | Chemotherapy | adriamycin | SD | |
| SYT7 | SNV | Missense_Mutation | novel | c.621C>G | p.Ser207Arg | p.S207R | O43581 | protein_coding | tolerated(0.4) | possibly_damaging(0.452) | TCGA-B6-A0IC-01 | Breast | breast invasive carcinoma | Female | >=65 | I/II | Unknown | Unknown | SD |
| SYT7 | SNV | Missense_Mutation | novel | c.752A>G | p.Lys251Arg | p.K251R | O43581 | protein_coding | tolerated(0.1) | benign(0.255) | TCGA-BH-A0B1-01 | Breast | breast invasive carcinoma | Female | >=65 | I/II | Chemotherapy | adriamycin | SD |
| SYT7 | insertion | Nonsense_Mutation | novel | c.622_623insTCTGAAATAAGCAAG | p.Arg208delinsLeuTerAsnLysGlnGly | p.R208delinsL*NKQG | O43581 | protein_coding | TCGA-B6-A0IC-01 | Breast | breast invasive carcinoma | Female | >=65 | I/II | Unknown | Unknown | SD | ||
| SYT7 | insertion | Nonsense_Mutation | novel | c.749_750insGATTAAGGAGTGATTTCTATCCCAGGGCCTTTGGGTGC | p.Lys251IlefsTer4 | p.K251Ifs*4 | O43581 | protein_coding | TCGA-BH-A0B1-01 | Breast | breast invasive carcinoma | Female | >=65 | I/II | Chemotherapy | adriamycin | SD | ||
| SYT7 | SNV | Missense_Mutation | novel | c.1393N>T | p.Arg465Cys | p.R465C | O43581 | protein_coding | deleterious(0) | possibly_damaging(0.852) | TCGA-2W-A8YY-01 | Cervix | cervical & endocervical cancer | Female | <65 | I/II | Chemotherapy | cisplatin | CR |
| SYT7 | SNV | Missense_Mutation | rs550321037 | c.1237N>A | p.Ala413Thr | p.A413T | O43581 | protein_coding | tolerated(0.46) | benign(0.01) | TCGA-2W-A8YY-01 | Cervix | cervical & endocervical cancer | Female | <65 | I/II | Chemotherapy | cisplatin | CR |
| SYT7 | SNV | Missense_Mutation | c.907C>T | p.Arg303Cys | p.R303C | O43581 | protein_coding | deleterious(0) | probably_damaging(0.993) | TCGA-C5-A1BF-01 | Cervix | cervical & endocervical cancer | Female | <65 | I/II | Chemotherapy | cisplatin | PD | |
| SYT7 | SNV | Missense_Mutation | rs567302490 | c.1132G>T | p.Asp378Tyr | p.D378Y | O43581 | protein_coding | deleterious(0.01) | probably_damaging(1) | TCGA-EA-A3HQ-01 | Cervix | cervical & endocervical cancer | Female | <65 | I/II | Unknown | Unknown | SD |
| Page: 1 2 3 4 5 |
Top |
Related drugs of malignant transformation related genes |
| Identification of chemicals and drugs interact with genes involved in malignant transfromation |
| (DGIdb 4.0) |
| Entrez ID | Symbol | Category | Interaction Types | Drug Claim Name | Drug Name | PMIDs |
| Page: 1 |

Copyright 2023-Present -The University of Texas Health Science Center at Houston |