
|
|||||
|
 | |
| |
| |
| |
| |
| |
|
Gene: SUCLG2 |
Gene summary for SUCLG2 |
| Gene information | Species | Human | Gene symbol | SUCLG2 | Gene ID | 8801 |
| Gene name | succinate-CoA ligase GDP-forming subunit beta | |
| Gene Alias | G-SCS | |
| Cytomap | 3p14.1 | |
| Gene Type | protein-coding | GO ID | GO:0006082 | UniProtAcc | Q96I99 |
Top |
Malignant transformation analysis |
| Identification of the aberrant gene expression in precancerous and cancerous lesions by comparing the gene expression of stem-like cells in diseased tissues with normal stem cells |
| Entrez ID | Symbol | Replicates | Species | Organ | Tissue | Adj P-value | Log2FC | Malignancy |
| 8801 | SUCLG2 | HTA11_3410_2000001011 | Human | Colorectum | AD | 9.31e-17 | -6.16e-01 | 0.0155 |
| 8801 | SUCLG2 | HTA11_2951_2000001011 | Human | Colorectum | AD | 3.66e-03 | -8.11e-01 | 0.0216 |
| 8801 | SUCLG2 | HTA11_347_2000001011 | Human | Colorectum | AD | 1.13e-20 | 9.72e-01 | -0.1954 |
| 8801 | SUCLG2 | HTA11_3361_2000001011 | Human | Colorectum | AD | 3.60e-09 | -6.07e-01 | -0.1207 |
| 8801 | SUCLG2 | HTA11_866_3004761011 | Human | Colorectum | AD | 2.73e-07 | -5.70e-01 | 0.096 |
| 8801 | SUCLG2 | HTA11_9408_2000001011 | Human | Colorectum | AD | 1.10e-05 | -1.08e+00 | 0.0451 |
| 8801 | SUCLG2 | HTA11_6818_2000001021 | Human | Colorectum | AD | 2.17e-04 | -5.11e-01 | 0.0588 |
| 8801 | SUCLG2 | HTA11_99999965104_69814 | Human | Colorectum | MSS | 3.38e-02 | 3.26e-01 | 0.281 |
| 8801 | SUCLG2 | HTA11_99999971662_82457 | Human | Colorectum | MSS | 7.37e-03 | -2.96e-01 | 0.3859 |
| 8801 | SUCLG2 | HTA11_99999973899_84307 | Human | Colorectum | MSS | 4.77e-16 | -1.01e+00 | 0.2585 |
| 8801 | SUCLG2 | HTA11_99999974143_84620 | Human | Colorectum | MSS | 2.76e-43 | -9.30e-01 | 0.3005 |
| 8801 | SUCLG2 | F007 | Human | Colorectum | FAP | 1.11e-03 | -4.01e-01 | 0.1176 |
| 8801 | SUCLG2 | A001-C-207 | Human | Colorectum | FAP | 5.46e-05 | -3.74e-01 | 0.1278 |
| 8801 | SUCLG2 | A015-C-203 | Human | Colorectum | FAP | 2.34e-39 | -6.14e-01 | -0.1294 |
| 8801 | SUCLG2 | A015-C-204 | Human | Colorectum | FAP | 8.29e-07 | -4.09e-01 | -0.0228 |
| 8801 | SUCLG2 | A014-C-040 | Human | Colorectum | FAP | 6.02e-07 | -5.81e-01 | -0.1184 |
| 8801 | SUCLG2 | A002-C-201 | Human | Colorectum | FAP | 8.03e-22 | -5.95e-01 | 0.0324 |
| 8801 | SUCLG2 | A002-C-203 | Human | Colorectum | FAP | 1.40e-05 | -2.85e-01 | 0.2786 |
| 8801 | SUCLG2 | A001-C-119 | Human | Colorectum | FAP | 7.25e-24 | -9.03e-01 | -0.1557 |
| 8801 | SUCLG2 | A001-C-108 | Human | Colorectum | FAP | 3.10e-27 | -5.70e-01 | -0.0272 |
| Page: 1 2 3 4 5 6 7 8 9 |
| Tissue | Expression Dynamics | Abbreviation |
| Colorectum (GSE201348) |  | FAP: Familial adenomatous polyposis |
| CRC: Colorectal cancer | ||
| Colorectum (HTA11) |  | AD: Adenomas |
| SER: Sessile serrated lesions | ||
| MSI-H: Microsatellite-high colorectal cancer | ||
| MSS: Microsatellite stable colorectal cancer | ||
| Esophagus | 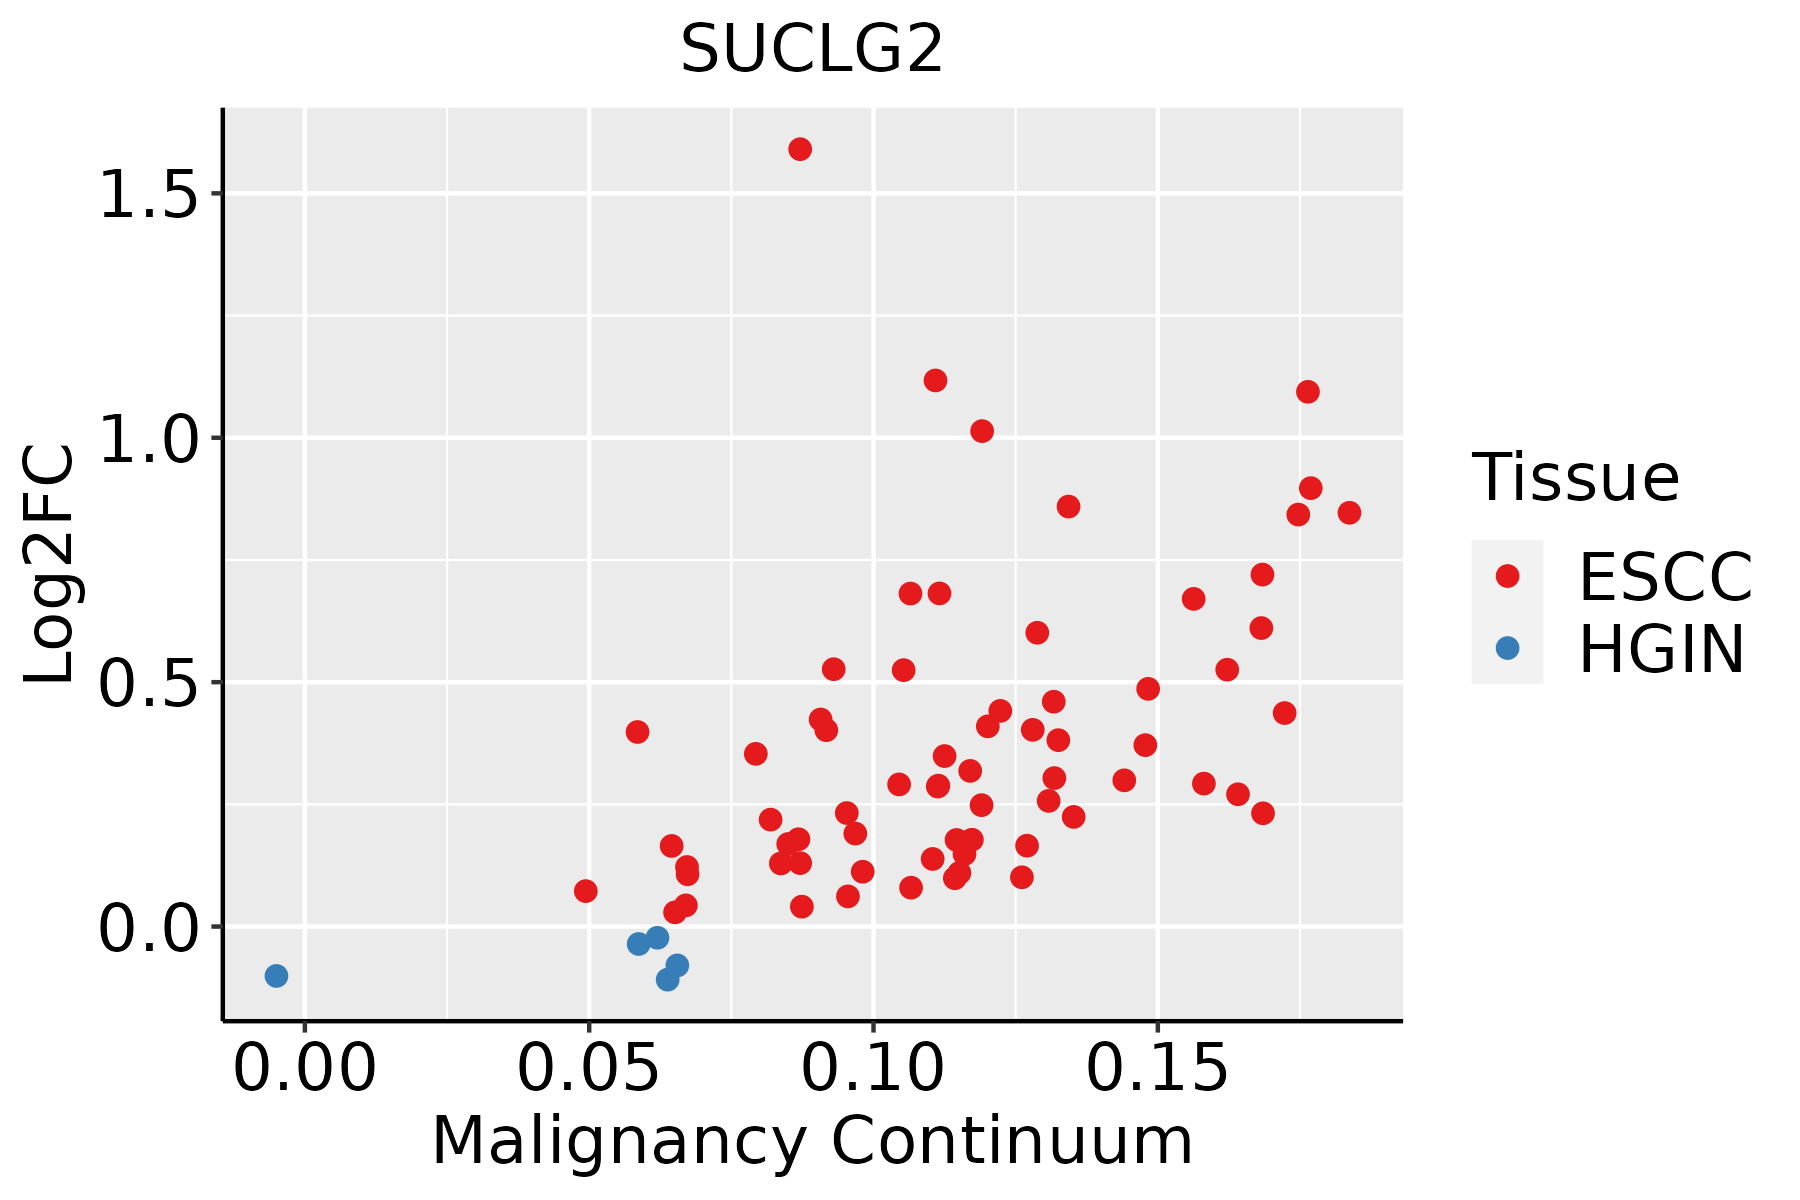 | ESCC: Esophageal squamous cell carcinoma |
| HGIN: High-grade intraepithelial neoplasias | ||
| LGIN: Low-grade intraepithelial neoplasias | ||
| Liver | 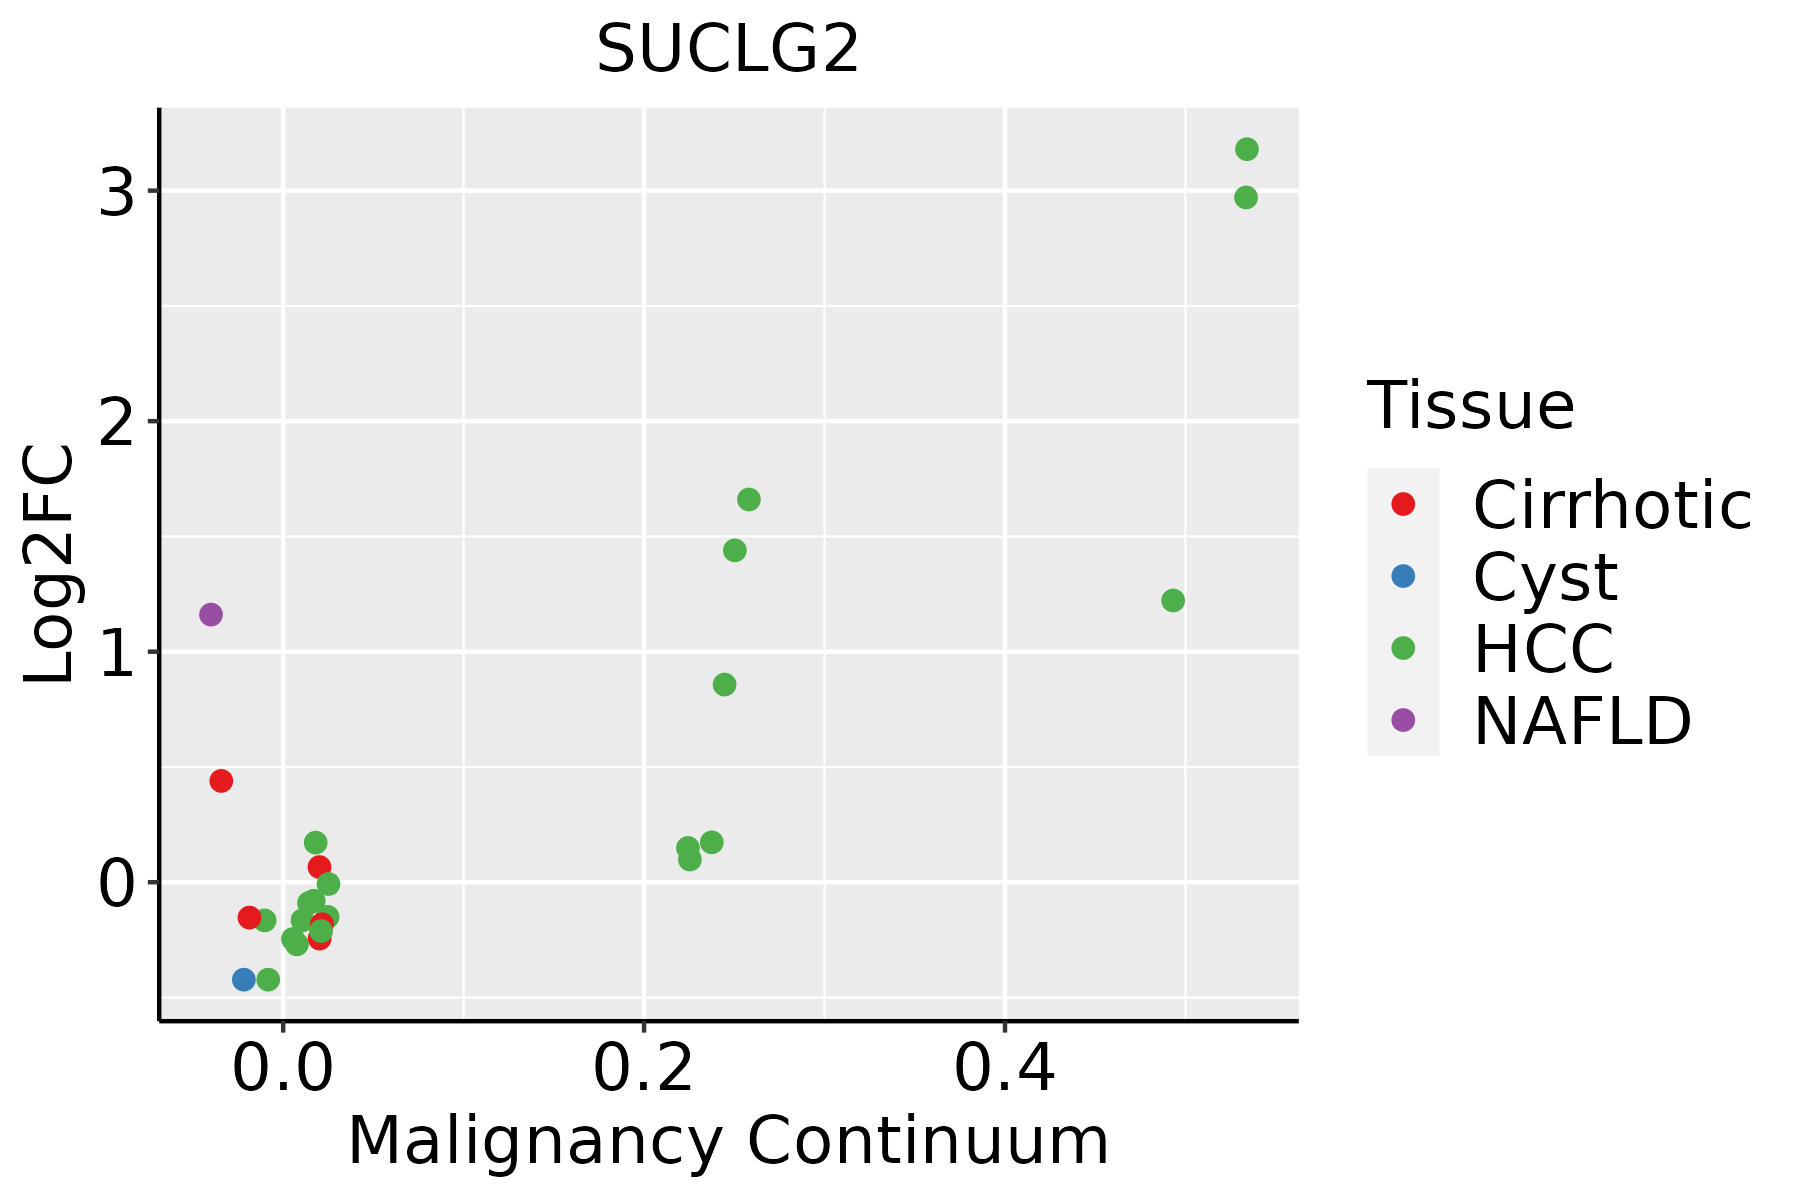 | HCC: Hepatocellular carcinoma |
| NAFLD: Non-alcoholic fatty liver disease | ||
| Lung |  | AAH: Atypical adenomatous hyperplasia |
| AIS: Adenocarcinoma in situ | ||
| IAC: Invasive lung adenocarcinoma | ||
| MIA: Minimally invasive adenocarcinoma | ||
| Oral Cavity |  | EOLP: Erosive Oral lichen planus |
| LP: leukoplakia | ||
| NEOLP: Non-erosive oral lichen planus | ||
| OSCC: Oral squamous cell carcinoma | ||
| Skin | 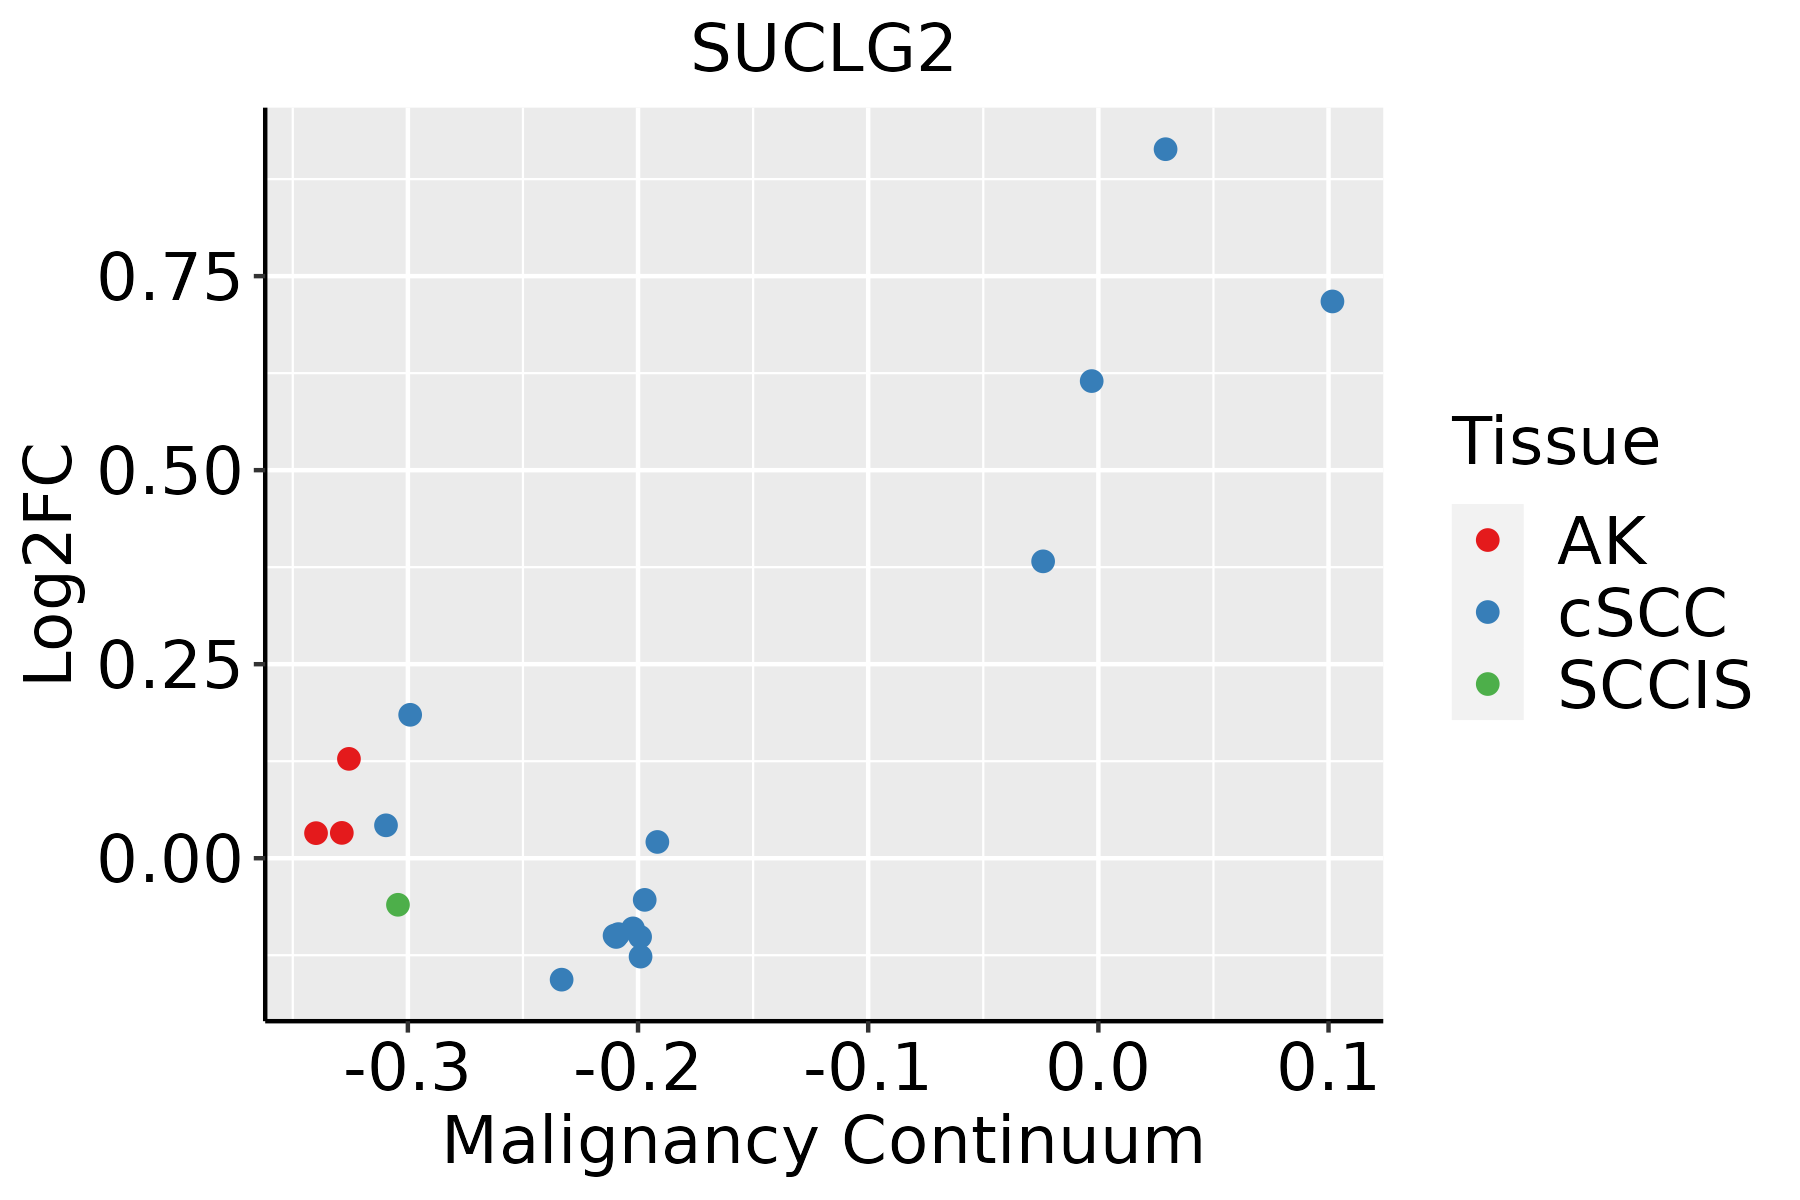 | AK: Actinic keratosis |
| cSCC: Cutaneous squamous cell carcinoma | ||
| SCCIS:squamous cell carcinoma in situ | ||
| Thyroid |  | ATC: Anaplastic thyroid cancer |
| HT: Hashimoto's thyroiditis | ||
| PTC: Papillary thyroid cancer |
| ∗log2FC in expression of this searched gene in stem-like cells from each diseased tissue sample relative to stem-like cells in normal samples in each tissue plotted against the malignancy continuum. Samples are colored based on if they are from different disease stage. |
Top |
Malignant transformation related pathway analysis |
| Find out the enriched GO biological processes and KEGG pathways involved in transition from healthy to precancer to cancer |
| Tissue | Disease Stage | Enriched GO biological Processes |
| Colorectum | AD |  |
| Colorectum | SER |  |
| Colorectum | MSS |  |
| Colorectum | MSI-H |  |
| Colorectum | FAP |  |
| ∗Top 15 enriched GO BP terms are showed in the bar plot of each disease state in each tissue. Each row represents a significant GO biological process which is colored according to the -log10(p.adjust). |
| Page: 1 2 3 4 5 6 7 8 9 |
| GO ID | Tissue | Disease Stage | Description | Gene Ratio | Bg Ratio | pvalue | p.adjust | Count |
| GO:0045333112 | Thyroid | PTC | cellular respiration | 140/5968 | 230/18723 | 9.60e-20 | 1.26e-17 | 140 |
| GO:0015980111 | Thyroid | PTC | energy derivation by oxidation of organic compounds | 176/5968 | 318/18723 | 2.67e-18 | 2.90e-16 | 176 |
| GO:001969327 | Thyroid | PTC | ribose phosphate metabolic process | 176/5968 | 396/18723 | 8.28e-08 | 1.70e-06 | 176 |
| GO:000915028 | Thyroid | PTC | purine ribonucleotide metabolic process | 165/5968 | 368/18723 | 1.03e-07 | 2.05e-06 | 165 |
| GO:007252127 | Thyroid | PTC | purine-containing compound metabolic process | 182/5968 | 416/18723 | 1.92e-07 | 3.51e-06 | 182 |
| GO:000925927 | Thyroid | PTC | ribonucleotide metabolic process | 170/5968 | 385/18723 | 2.32e-07 | 4.08e-06 | 170 |
| GO:000616327 | Thyroid | PTC | purine nucleotide metabolic process | 170/5968 | 396/18723 | 2.02e-06 | 2.75e-05 | 170 |
| GO:000675325 | Thyroid | PTC | nucleoside phosphate metabolic process | 205/5968 | 497/18723 | 5.24e-06 | 6.35e-05 | 205 |
| GO:000911725 | Thyroid | PTC | nucleotide metabolic process | 202/5968 | 489/18723 | 5.46e-06 | 6.60e-05 | 202 |
| GO:00060999 | Thyroid | PTC | tricarboxylic acid cycle | 21/5968 | 30/18723 | 2.04e-05 | 2.06e-04 | 21 |
| GO:000906033 | Thyroid | ATC | aerobic respiration | 126/6293 | 189/18723 | 1.21e-20 | 2.02e-18 | 126 |
| GO:000609134 | Thyroid | ATC | generation of precursor metabolites and energy | 256/6293 | 490/18723 | 6.55e-18 | 7.69e-16 | 256 |
| GO:004533333 | Thyroid | ATC | cellular respiration | 140/6293 | 230/18723 | 1.76e-17 | 1.89e-15 | 140 |
| GO:001598034 | Thyroid | ATC | energy derivation by oxidation of organic compounds | 177/6293 | 318/18723 | 3.60e-16 | 2.92e-14 | 177 |
| GO:001969328 | Thyroid | ATC | ribose phosphate metabolic process | 184/6293 | 396/18723 | 5.87e-08 | 1.05e-06 | 184 |
| GO:000915029 | Thyroid | ATC | purine ribonucleotide metabolic process | 172/6293 | 368/18723 | 9.58e-08 | 1.64e-06 | 172 |
| GO:000925928 | Thyroid | ATC | ribonucleotide metabolic process | 178/6293 | 385/18723 | 1.47e-07 | 2.39e-06 | 178 |
| GO:007252128 | Thyroid | ATC | purine-containing compound metabolic process | 189/6293 | 416/18723 | 2.83e-07 | 4.29e-06 | 189 |
| GO:0006753111 | Thyroid | ATC | nucleoside phosphate metabolic process | 219/6293 | 497/18723 | 5.92e-07 | 8.29e-06 | 219 |
| GO:0009117112 | Thyroid | ATC | nucleotide metabolic process | 215/6293 | 489/18723 | 9.09e-07 | 1.20e-05 | 215 |
| Page: 1 2 3 4 5 6 7 8 9 10 11 12 |
| Pathway ID | Tissue | Disease Stage | Description | Gene Ratio | Bg Ratio | pvalue | p.adjust | qvalue | Count |
| hsa01200 | Colorectum | AD | Carbon metabolism | 55/2092 | 115/8465 | 5.53e-08 | 8.42e-07 | 5.37e-07 | 55 |
| hsa00020 | Colorectum | AD | Citrate cycle (TCA cycle) | 20/2092 | 30/8465 | 1.43e-06 | 1.77e-05 | 1.13e-05 | 20 |
| hsa00640 | Colorectum | AD | Propanoate metabolism | 18/2092 | 32/8465 | 1.33e-04 | 1.11e-03 | 7.08e-04 | 18 |
| hsa012001 | Colorectum | AD | Carbon metabolism | 55/2092 | 115/8465 | 5.53e-08 | 8.42e-07 | 5.37e-07 | 55 |
| hsa000201 | Colorectum | AD | Citrate cycle (TCA cycle) | 20/2092 | 30/8465 | 1.43e-06 | 1.77e-05 | 1.13e-05 | 20 |
| hsa006401 | Colorectum | AD | Propanoate metabolism | 18/2092 | 32/8465 | 1.33e-04 | 1.11e-03 | 7.08e-04 | 18 |
| hsa012004 | Colorectum | MSS | Carbon metabolism | 43/1875 | 115/8465 | 1.37e-04 | 1.17e-03 | 7.19e-04 | 43 |
| hsa000204 | Colorectum | MSS | Citrate cycle (TCA cycle) | 16/1875 | 30/8465 | 1.84e-04 | 1.47e-03 | 9.00e-04 | 16 |
| hsa006404 | Colorectum | MSS | Propanoate metabolism | 15/1875 | 32/8465 | 1.68e-03 | 9.05e-03 | 5.55e-03 | 15 |
| hsa012005 | Colorectum | MSS | Carbon metabolism | 43/1875 | 115/8465 | 1.37e-04 | 1.17e-03 | 7.19e-04 | 43 |
| hsa000205 | Colorectum | MSS | Citrate cycle (TCA cycle) | 16/1875 | 30/8465 | 1.84e-04 | 1.47e-03 | 9.00e-04 | 16 |
| hsa006405 | Colorectum | MSS | Propanoate metabolism | 15/1875 | 32/8465 | 1.68e-03 | 9.05e-03 | 5.55e-03 | 15 |
| hsa012006 | Colorectum | FAP | Carbon metabolism | 38/1404 | 115/8465 | 1.04e-05 | 1.44e-04 | 8.76e-05 | 38 |
| hsa006406 | Colorectum | FAP | Propanoate metabolism | 15/1404 | 32/8465 | 6.21e-05 | 6.10e-04 | 3.71e-04 | 15 |
| hsa000206 | Colorectum | FAP | Citrate cycle (TCA cycle) | 14/1404 | 30/8465 | 1.16e-04 | 1.02e-03 | 6.21e-04 | 14 |
| hsa012007 | Colorectum | FAP | Carbon metabolism | 38/1404 | 115/8465 | 1.04e-05 | 1.44e-04 | 8.76e-05 | 38 |
| hsa006407 | Colorectum | FAP | Propanoate metabolism | 15/1404 | 32/8465 | 6.21e-05 | 6.10e-04 | 3.71e-04 | 15 |
| hsa000207 | Colorectum | FAP | Citrate cycle (TCA cycle) | 14/1404 | 30/8465 | 1.16e-04 | 1.02e-03 | 6.21e-04 | 14 |
| hsa012008 | Colorectum | CRC | Carbon metabolism | 28/1091 | 115/8465 | 5.43e-04 | 5.48e-03 | 3.72e-03 | 28 |
| hsa000208 | Colorectum | CRC | Citrate cycle (TCA cycle) | 11/1091 | 30/8465 | 8.16e-04 | 6.99e-03 | 4.74e-03 | 11 |
| Page: 1 2 |
Top |
Cell-cell communication analysis |
| Identification of potential cell-cell interactions between two cell types and their ligand-receptor pairs for different disease states |
| Ligand | Receptor | LRpair | Pathway | Tissue | Disease Stage |
| Page: 1 |
Top |
Single-cell gene regulatory network inference analysis |
| Find out the significant the regulons (TFs) and the target genes of each regulon across cell types for different disease states |
| TF | Cell Type | Tissue | Disease Stage | Target Gene | RSS | Regulon Activity |
| ∗The dot plots of a searched regulon are shown for all cell subpopulations in each disease state of each tissue based on the regulon specific score inferred using pySCENIC and by calculating the average expression. |
| Page: 1 |
Top |
Somatic mutation of malignant transformation related genes |
| Annotation of somatic variants for genes involved in malignant transformation |
| Hugo Symbol | Variant Class | Variant Classification | dbSNP RS | HGVSc | HGVSp | HGVSp Short | SWISSPROT | BIOTYPE | SIFT | PolyPhen | Tumor Sample Barcode | Tissue | Histology | Sex | Age | Stage | Therapy Types | Drugs | Outcome |
| SUCLG2 | SNV | Missense_Mutation | novel | c.806N>A | p.Arg269Gln | p.R269Q | Q96I99 | protein_coding | deleterious(0.01) | probably_damaging(0.999) | TCGA-PE-A5DE-01 | Breast | breast invasive carcinoma | Female | <65 | I/II | Chemotherapy | taxotere | CR |
| SUCLG2 | deletion | Frame_Shift_Del | novel | c.503_519delNNNNNNNNNNNNNNNNN | p.Val168GlyfsTer5 | p.V168Gfs*5 | Q96I99 | protein_coding | TCGA-AC-A8OQ-01 | Breast | breast invasive carcinoma | Female | >=65 | I/II | Unknown | Unknown | SD | ||
| SUCLG2 | deletion | Frame_Shift_Del | novel | c.279delN | p.Gly94ValfsTer7 | p.G94Vfs*7 | Q96I99 | protein_coding | TCGA-EW-A2FV-01 | Breast | breast invasive carcinoma | Female | <65 | III/IV | Chemotherapy | docetaxel | SD | ||
| SUCLG2 | SNV | Missense_Mutation | c.616C>T | p.Arg206Trp | p.R206W | Q96I99 | protein_coding | deleterious(0.02) | benign(0.031) | TCGA-MA-AA3W-01 | Cervix | cervical & endocervical cancer | Female | <65 | I/II | Chemotherapy | cisplatin | CR | |
| SUCLG2 | SNV | Missense_Mutation | c.494C>T | p.Pro165Leu | p.P165L | Q96I99 | protein_coding | deleterious(0.01) | probably_damaging(1) | TCGA-AA-3488-01 | Colorectum | colon adenocarcinoma | Male | <65 | III/IV | Unknown | Unknown | PD | |
| SUCLG2 | SNV | Missense_Mutation | novel | c.905N>C | p.Asn302Thr | p.N302T | Q96I99 | protein_coding | tolerated(0.09) | possibly_damaging(0.854) | TCGA-AZ-4315-01 | Colorectum | colon adenocarcinoma | Male | <65 | I/II | Unknown | Unknown | SD |
| SUCLG2 | SNV | Missense_Mutation | c.1007N>A | p.Gly336Asp | p.G336D | Q96I99 | protein_coding | deleterious(0) | possibly_damaging(0.76) | TCGA-AZ-4615-01 | Colorectum | colon adenocarcinoma | Male | >=65 | III/IV | Chemotherapy | xeloda | PD | |
| SUCLG2 | SNV | Missense_Mutation | rs149334981 | c.208N>A | p.Glu70Lys | p.E70K | Q96I99 | protein_coding | tolerated(0.62) | benign(0.009) | TCGA-A5-A0G2-01 | Endometrium | uterine corpus endometrioid carcinoma | Female | <65 | III/IV | Unknown | Unknown | SD |
| SUCLG2 | SNV | Missense_Mutation | novel | c.824N>A | p.Ala275Asp | p.A275D | Q96I99 | protein_coding | tolerated(0.25) | benign(0.007) | TCGA-A5-AB3J-01 | Endometrium | uterine corpus endometrioid carcinoma | Female | <65 | I/II | Chemotherapy | carboplatin | CR |
| SUCLG2 | SNV | Missense_Mutation | c.407N>G | p.Lys136Arg | p.K136R | Q96I99 | protein_coding | tolerated(0.32) | benign(0.005) | TCGA-AP-A051-01 | Endometrium | uterine corpus endometrioid carcinoma | Female | >=65 | I/II | Unknown | Unknown | SD |
| Page: 1 2 3 4 |
Top |
Related drugs of malignant transformation related genes |
| Identification of chemicals and drugs interact with genes involved in malignant transfromation |
| (DGIdb 4.0) |
| Entrez ID | Symbol | Category | Interaction Types | Drug Claim Name | Drug Name | PMIDs |
| Page: 1 |

Copyright 2023-Present -The University of Texas Health Science Center at Houston |