
|
|||||
|
 | |
| |
| |
| |
| |
| |
|
Gene: SIAH2 |
Gene summary for SIAH2 |
| Gene information | Species | Human | Gene symbol | SIAH2 | Gene ID | 6478 |
| Gene name | siah E3 ubiquitin protein ligase 2 | |
| Gene Alias | hSiah2 | |
| Cytomap | 3q25.1 | |
| Gene Type | protein-coding | GO ID | GO:0006139 | UniProtAcc | O43255 |
Top |
Malignant transformation analysis |
| Identification of the aberrant gene expression in precancerous and cancerous lesions by comparing the gene expression of stem-like cells in diseased tissues with normal stem cells |
| Entrez ID | Symbol | Replicates | Species | Organ | Tissue | Adj P-value | Log2FC | Malignancy |
| 6478 | SIAH2 | GSM4909282 | Human | Breast | IDC | 7.49e-03 | 2.65e-01 | -0.0288 |
| 6478 | SIAH2 | GSM4909293 | Human | Breast | IDC | 1.19e-24 | 5.33e-01 | 0.1581 |
| 6478 | SIAH2 | GSM4909296 | Human | Breast | IDC | 1.31e-03 | -5.00e-02 | 0.1524 |
| 6478 | SIAH2 | GSM4909297 | Human | Breast | IDC | 1.78e-08 | -1.32e-01 | 0.1517 |
| 6478 | SIAH2 | GSM4909298 | Human | Breast | IDC | 4.10e-02 | 2.43e-01 | 0.1551 |
| 6478 | SIAH2 | GSM4909304 | Human | Breast | IDC | 2.24e-63 | 9.99e-01 | 0.1636 |
| 6478 | SIAH2 | GSM4909306 | Human | Breast | IDC | 2.90e-02 | 2.65e-01 | 0.1564 |
| 6478 | SIAH2 | GSM4909311 | Human | Breast | IDC | 8.65e-08 | -1.01e-01 | 0.1534 |
| 6478 | SIAH2 | GSM4909319 | Human | Breast | IDC | 1.12e-28 | 2.96e-01 | 0.1563 |
| 6478 | SIAH2 | GSM4909321 | Human | Breast | IDC | 2.24e-12 | 3.14e-01 | 0.1559 |
| 6478 | SIAH2 | ctrl6 | Human | Breast | Precancer | 5.08e-04 | 4.08e-01 | -0.0061 |
| 6478 | SIAH2 | NCCBC14 | Human | Breast | DCIS | 3.05e-04 | -1.36e-01 | 0.2021 |
| 6478 | SIAH2 | P1 | Human | Breast | IDC | 6.38e-03 | -1.28e-01 | 0.1527 |
| 6478 | SIAH2 | DCIS2 | Human | Breast | DCIS | 5.19e-20 | -2.61e-02 | 0.0085 |
| 6478 | SIAH2 | LZE4T | Human | Esophagus | ESCC | 8.91e-04 | -8.48e-02 | 0.0811 |
| 6478 | SIAH2 | LZE8T | Human | Esophagus | ESCC | 1.83e-02 | -9.24e-02 | 0.067 |
| 6478 | SIAH2 | LZE20T | Human | Esophagus | ESCC | 1.32e-02 | 8.51e-02 | 0.0662 |
| 6478 | SIAH2 | LZE24T | Human | Esophagus | ESCC | 2.07e-12 | 6.53e-01 | 0.0596 |
| 6478 | SIAH2 | LZE21T | Human | Esophagus | ESCC | 3.54e-07 | 6.77e-01 | 0.0655 |
| 6478 | SIAH2 | LZE6T | Human | Esophagus | ESCC | 7.62e-03 | -1.14e-01 | 0.0845 |
| Page: 1 2 3 4 5 6 |
| Tissue | Expression Dynamics | Abbreviation |
| Breast |  | IDC: Invasive ductal carcinoma |
| DCIS: Ductal carcinoma in situ | ||
| Precancer(BRCA1-mut): Precancerous lesion from BRCA1 mutation carriers | ||
| Esophagus | 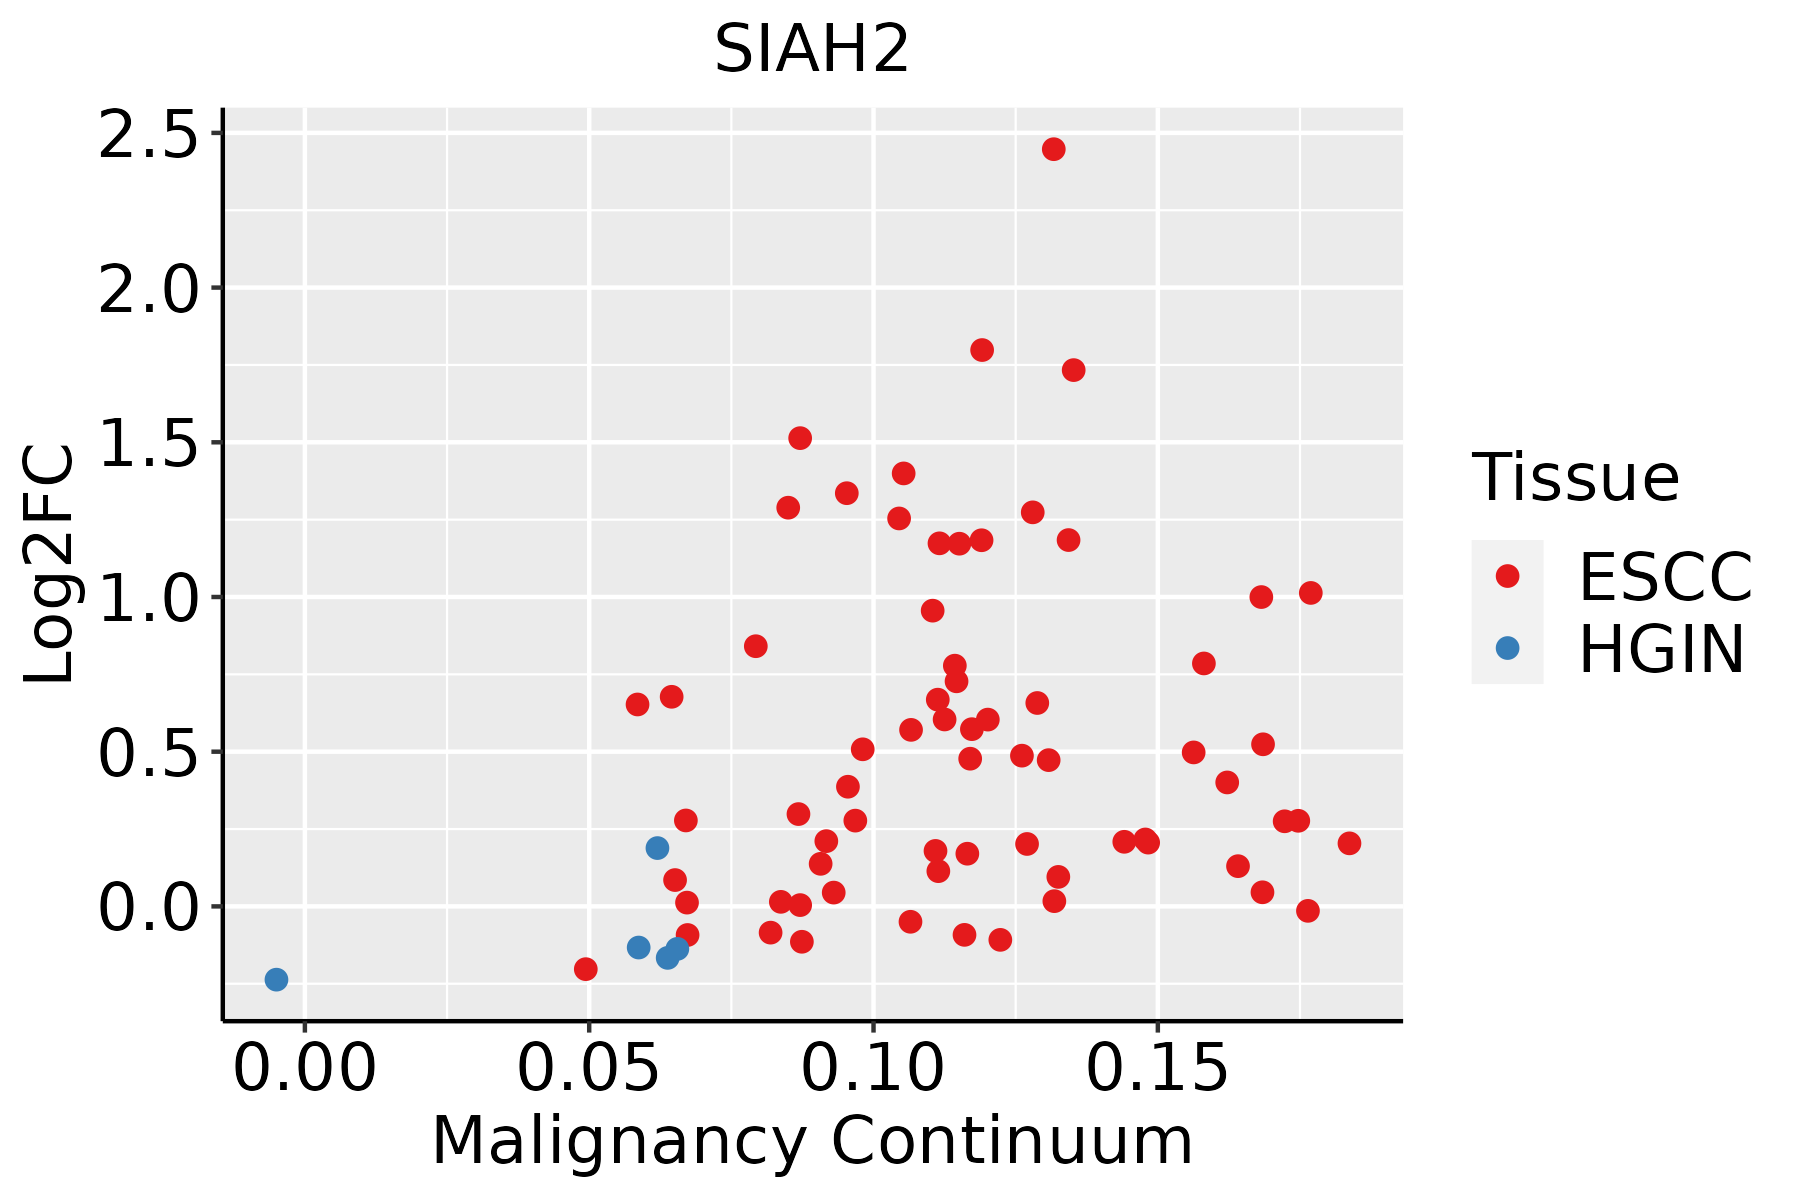 | ESCC: Esophageal squamous cell carcinoma |
| HGIN: High-grade intraepithelial neoplasias | ||
| LGIN: Low-grade intraepithelial neoplasias | ||
| Liver | 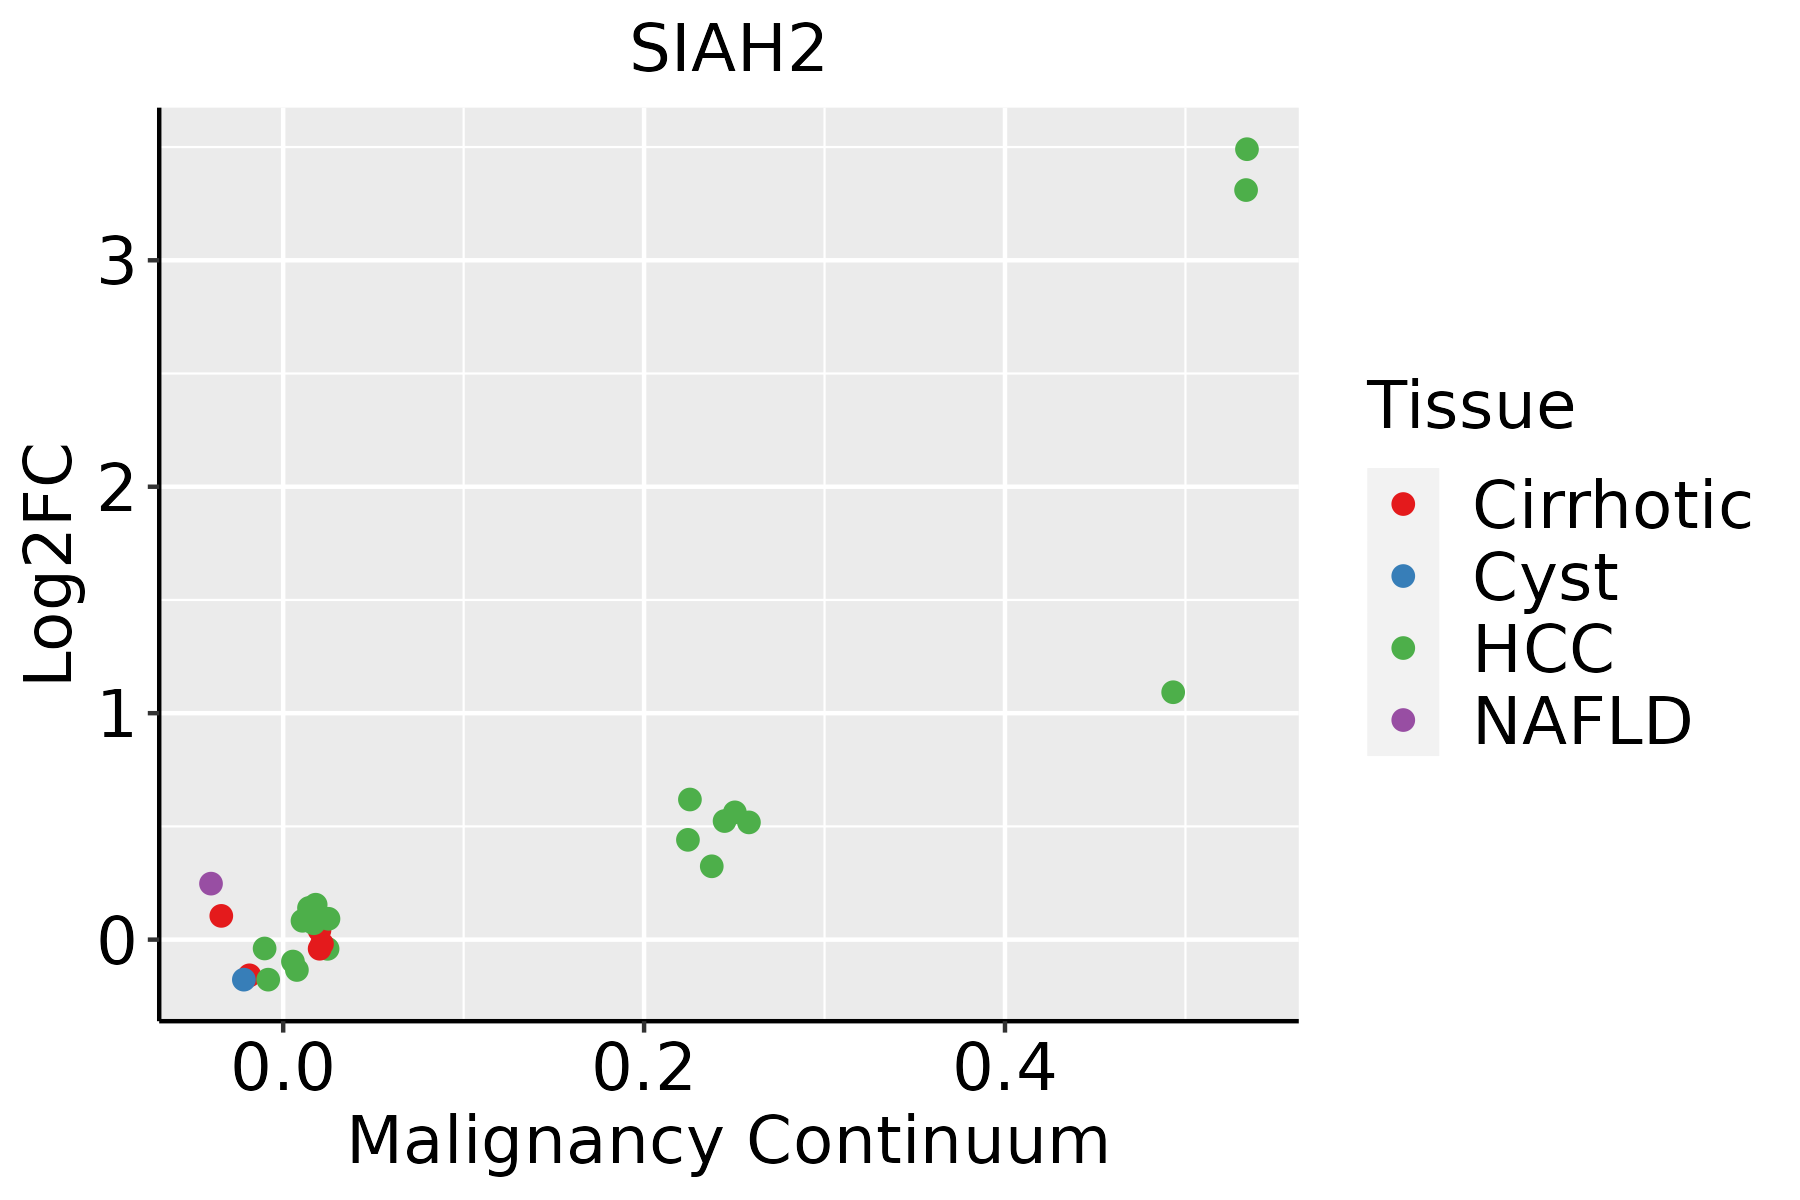 | HCC: Hepatocellular carcinoma |
| NAFLD: Non-alcoholic fatty liver disease | ||
| Oral Cavity | 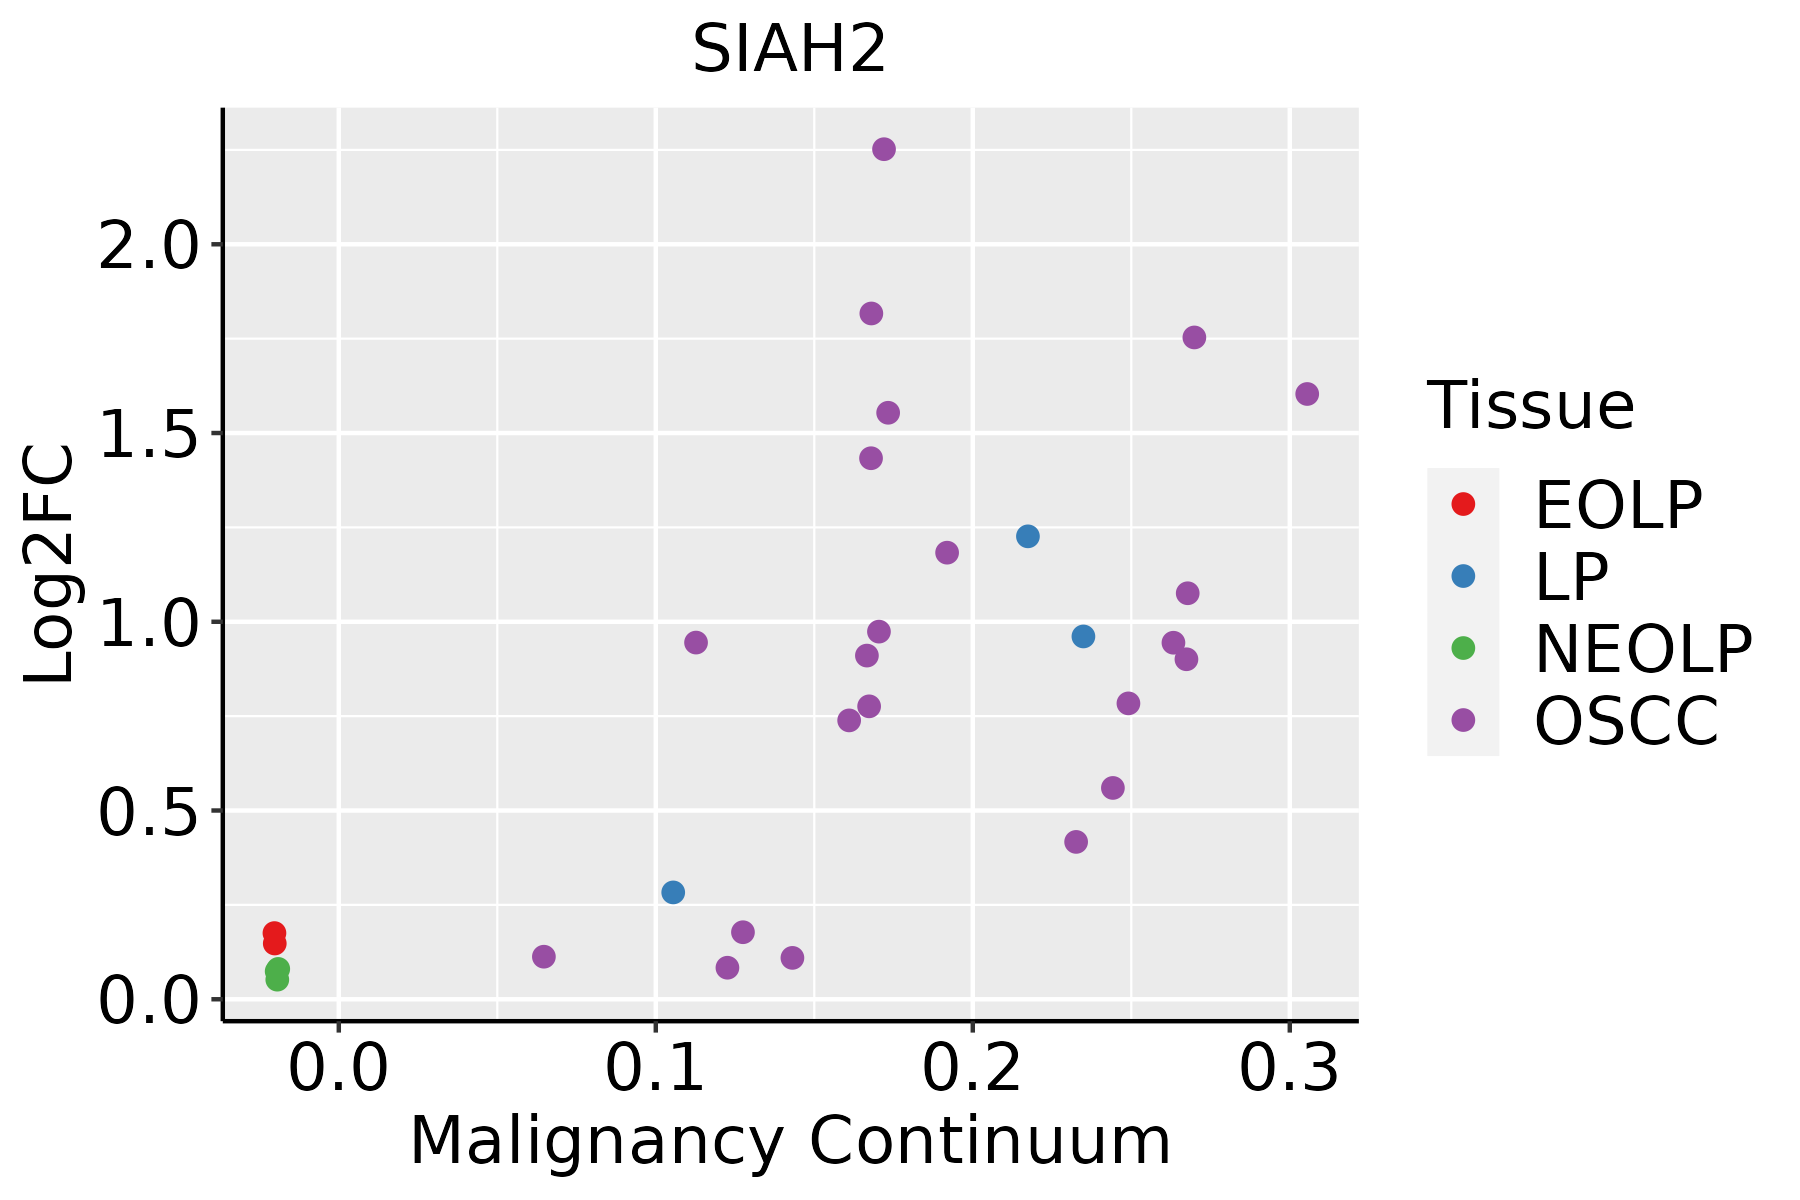 | EOLP: Erosive Oral lichen planus |
| LP: leukoplakia | ||
| NEOLP: Non-erosive oral lichen planus | ||
| OSCC: Oral squamous cell carcinoma | ||
| Skin | 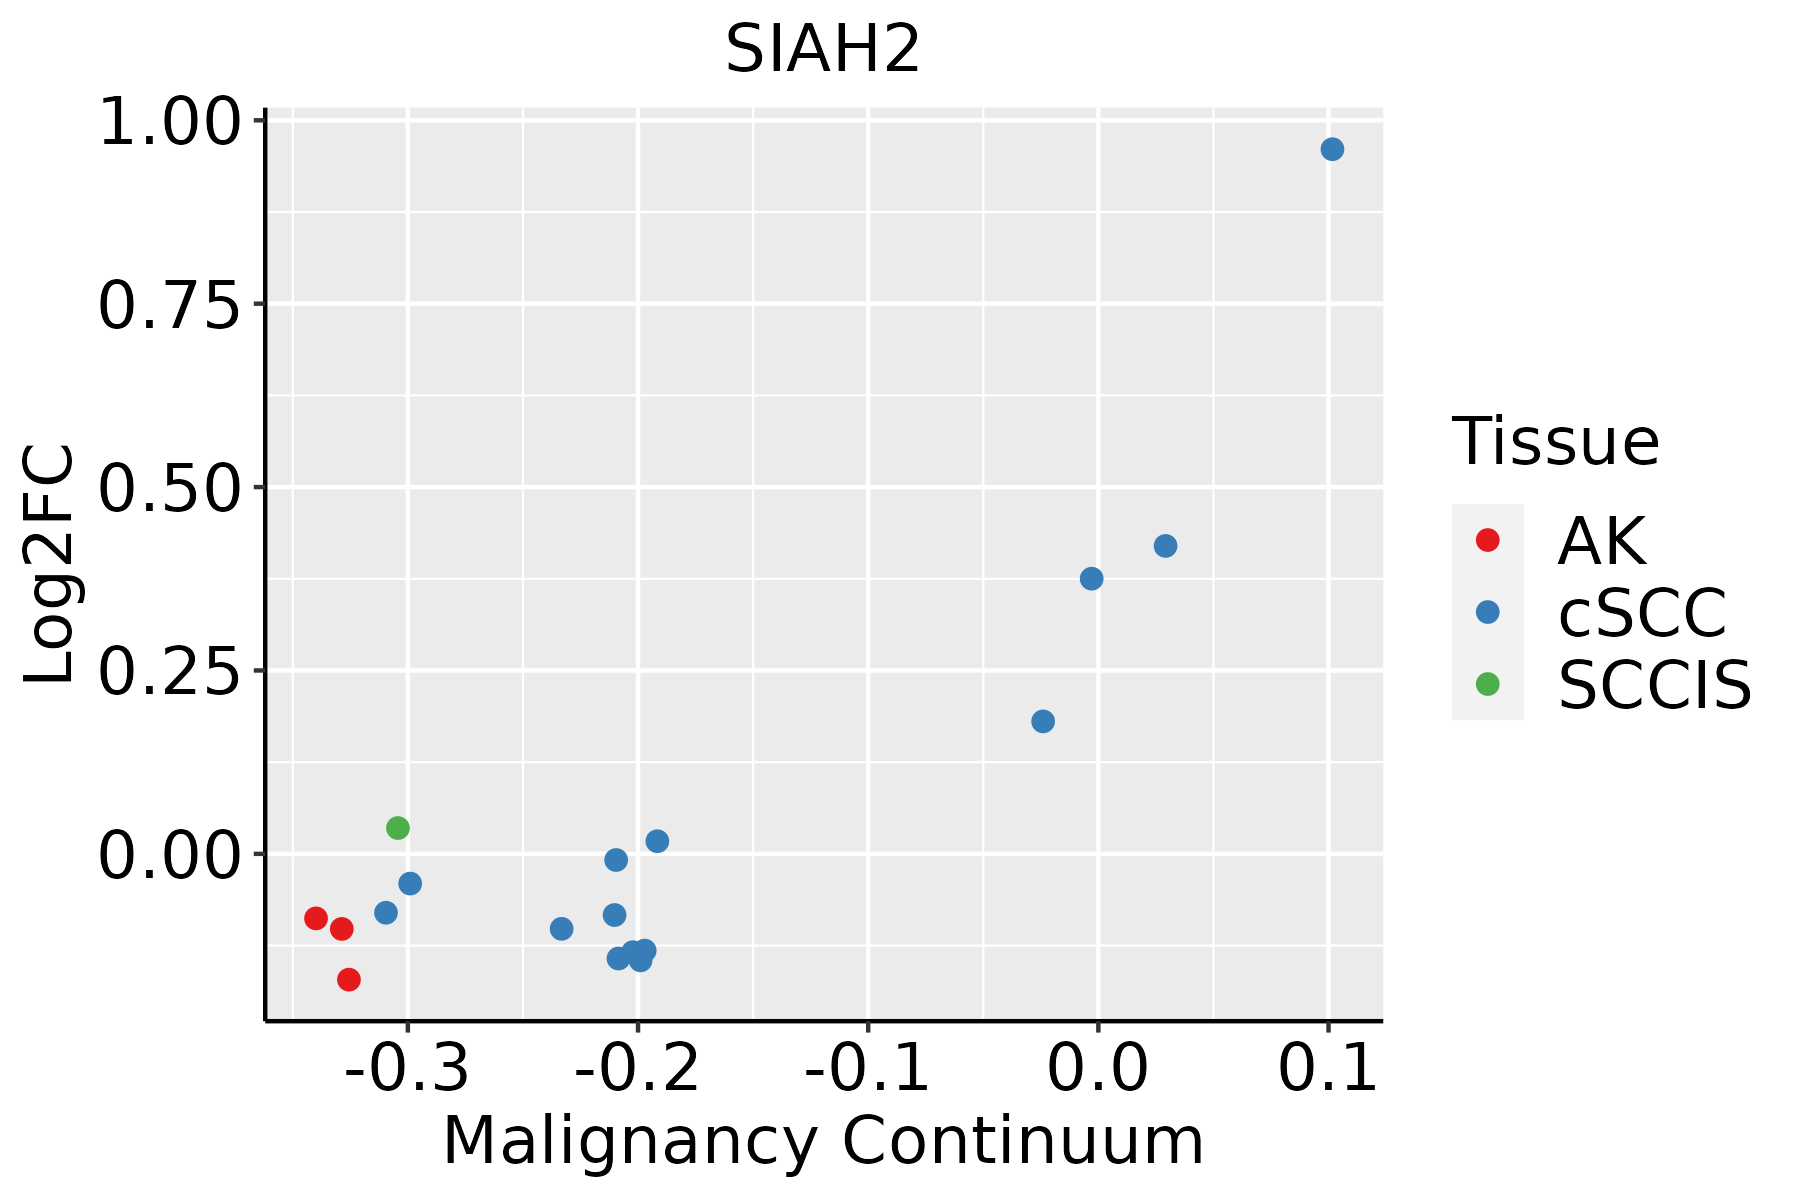 | AK: Actinic keratosis |
| cSCC: Cutaneous squamous cell carcinoma | ||
| SCCIS:squamous cell carcinoma in situ |
| ∗log2FC in expression of this searched gene in stem-like cells from each diseased tissue sample relative to stem-like cells in normal samples in each tissue plotted against the malignancy continuum. Samples are colored based on if they are from different disease stage. |
Top |
Malignant transformation related pathway analysis |
| Find out the enriched GO biological processes and KEGG pathways involved in transition from healthy to precancer to cancer |
| Tissue | Disease Stage | Enriched GO biological Processes |
| Colorectum | AD |  |
| Colorectum | SER |  |
| Colorectum | MSS |  |
| Colorectum | MSI-H |  |
| Colorectum | FAP |  |
| ∗Top 15 enriched GO BP terms are showed in the bar plot of each disease state in each tissue. Each row represents a significant GO biological process which is colored according to the -log10(p.adjust). |
| Page: 1 2 3 4 5 6 7 8 9 |
| GO ID | Tissue | Disease Stage | Description | Gene Ratio | Bg Ratio | pvalue | p.adjust | Count |
| GO:004316128 | Skin | cSCC | proteasome-mediated ubiquitin-dependent protein catabolic process | 205/4864 | 412/18723 | 1.46e-25 | 4.16e-23 | 205 |
| GO:200123329 | Skin | cSCC | regulation of apoptotic signaling pathway | 173/4864 | 356/18723 | 2.25e-20 | 3.44e-18 | 173 |
| GO:190332029 | Skin | cSCC | regulation of protein modification by small protein conjugation or removal | 125/4864 | 242/18723 | 9.50e-18 | 1.05e-15 | 125 |
| GO:003139629 | Skin | cSCC | regulation of protein ubiquitination | 107/4864 | 210/18723 | 7.17e-15 | 5.35e-13 | 107 |
| GO:200123429 | Skin | cSCC | negative regulation of apoptotic signaling pathway | 101/4864 | 224/18723 | 4.17e-10 | 1.70e-08 | 101 |
| GO:005254728 | Skin | cSCC | regulation of peptidase activity | 177/4864 | 461/18723 | 2.21e-09 | 8.02e-08 | 177 |
| GO:005254828 | Skin | cSCC | regulation of endopeptidase activity | 165/4864 | 432/18723 | 1.18e-08 | 3.63e-07 | 165 |
| GO:004328128 | Skin | cSCC | regulation of cysteine-type endopeptidase activity involved in apoptotic process | 89/4864 | 209/18723 | 1.20e-07 | 2.79e-06 | 89 |
| GO:000762323 | Skin | cSCC | circadian rhythm | 89/4864 | 210/18723 | 1.55e-07 | 3.51e-06 | 89 |
| GO:200011628 | Skin | cSCC | regulation of cysteine-type endopeptidase activity | 97/4864 | 235/18723 | 2.01e-07 | 4.34e-06 | 97 |
| GO:200123628 | Skin | cSCC | regulation of extrinsic apoptotic signaling pathway | 68/4864 | 151/18723 | 3.01e-07 | 6.12e-06 | 68 |
| GO:009719128 | Skin | cSCC | extrinsic apoptotic signaling pathway | 91/4864 | 219/18723 | 3.31e-07 | 6.63e-06 | 91 |
| GO:001605524 | Skin | cSCC | Wnt signaling pathway | 158/4864 | 444/18723 | 3.80e-06 | 5.70e-05 | 158 |
| GO:019873824 | Skin | cSCC | cell-cell signaling by wnt | 158/4864 | 446/18723 | 5.08e-06 | 7.38e-05 | 158 |
| GO:004586128 | Skin | cSCC | negative regulation of proteolysis | 128/4864 | 351/18723 | 7.95e-06 | 1.09e-04 | 128 |
| GO:2000117111 | Skin | cSCC | negative regulation of cysteine-type endopeptidase activity | 41/4864 | 86/18723 | 1.20e-05 | 1.53e-04 | 41 |
| GO:0043154111 | Skin | cSCC | negative regulation of cysteine-type endopeptidase activity involved in apoptotic process | 38/4864 | 78/18723 | 1.33e-05 | 1.67e-04 | 38 |
| GO:004851123 | Skin | cSCC | rhythmic process | 110/4864 | 298/18723 | 1.83e-05 | 2.19e-04 | 110 |
| GO:003011124 | Skin | cSCC | regulation of Wnt signaling pathway | 117/4864 | 328/18723 | 5.80e-05 | 5.75e-04 | 117 |
| GO:005134627 | Skin | cSCC | negative regulation of hydrolase activity | 130/4864 | 379/18723 | 1.74e-04 | 1.49e-03 | 130 |
| Page: 1 2 3 4 5 6 7 8 9 10 11 12 |
| Pathway ID | Tissue | Disease Stage | Description | Gene Ratio | Bg Ratio | pvalue | p.adjust | qvalue | Count |
| Page: 1 |
Top |
Cell-cell communication analysis |
| Identification of potential cell-cell interactions between two cell types and their ligand-receptor pairs for different disease states |
| Ligand | Receptor | LRpair | Pathway | Tissue | Disease Stage |
| Page: 1 |
Top |
Single-cell gene regulatory network inference analysis |
| Find out the significant the regulons (TFs) and the target genes of each regulon across cell types for different disease states |
| TF | Cell Type | Tissue | Disease Stage | Target Gene | RSS | Regulon Activity |
| ∗The dot plots of a searched regulon are shown for all cell subpopulations in each disease state of each tissue based on the regulon specific score inferred using pySCENIC and by calculating the average expression. |
| Page: 1 |
Top |
Somatic mutation of malignant transformation related genes |
| Annotation of somatic variants for genes involved in malignant transformation |
| Hugo Symbol | Variant Class | Variant Classification | dbSNP RS | HGVSc | HGVSp | HGVSp Short | SWISSPROT | BIOTYPE | SIFT | PolyPhen | Tumor Sample Barcode | Tissue | Histology | Sex | Age | Stage | Therapy Types | Drugs | Outcome |
| SIAH2 | insertion | Nonsense_Mutation | novel | c.438_439insAAGTCATATGGCCATTGATAGTTCTCATGTAATTAGTTTTG | p.Leu147LysfsTer6 | p.L147Kfs*6 | O43255 | protein_coding | TCGA-A2-A04Y-01 | Breast | breast invasive carcinoma | Female | <65 | I/II | Chemotherapy | cytoxan | SD | ||
| SIAH2 | insertion | Nonsense_Mutation | novel | c.330_331insCTTTGGCCTACAGTTTGAGGCTCCTAGAAATTA | p.Cys110_Cys111insLeuTrpProThrValTerGlySerTerLysLeu | p.C110_C111insLWPTV*GS*KL | O43255 | protein_coding | TCGA-AO-A03R-01 | Breast | breast invasive carcinoma | Female | <65 | I/II | Chemotherapy | doxorubicin | SD | ||
| SIAH2 | SNV | Missense_Mutation | c.95N>T | p.Pro32Leu | p.P32L | O43255 | protein_coding | deleterious_low_confidence(0.01) | possibly_damaging(0.908) | TCGA-AA-3492-01 | Colorectum | colon adenocarcinoma | Female | >=65 | I/II | Unknown | Unknown | SD | |
| SIAH2 | SNV | Missense_Mutation | c.876N>A | p.Met292Ile | p.M292I | O43255 | protein_coding | tolerated(0.21) | benign(0.009) | TCGA-AA-3510-01 | Colorectum | colon adenocarcinoma | Male | >=65 | I/II | Unknown | Unknown | SD | |
| SIAH2 | SNV | Missense_Mutation | rs765846031 | c.842N>A | p.Arg281His | p.R281H | O43255 | protein_coding | deleterious(0.04) | probably_damaging(0.983) | TCGA-AA-3710-01 | Colorectum | colon adenocarcinoma | Female | >=65 | I/II | Unknown | Unknown | SD |
| SIAH2 | SNV | Missense_Mutation | c.745N>A | p.Val249Ile | p.V249I | O43255 | protein_coding | deleterious(0.01) | possibly_damaging(0.7) | TCGA-AA-3710-01 | Colorectum | colon adenocarcinoma | Female | >=65 | I/II | Unknown | Unknown | SD | |
| SIAH2 | SNV | Missense_Mutation | rs748812007 | c.883N>A | p.Asp295Asn | p.D295N | O43255 | protein_coding | tolerated(0.06) | probably_damaging(0.999) | TCGA-AA-3877-01 | Colorectum | colon adenocarcinoma | Female | >=65 | I/II | Unknown | Unknown | SD |
| SIAH2 | SNV | Missense_Mutation | c.611N>C | p.Val204Ala | p.V204A | O43255 | protein_coding | deleterious(0) | probably_damaging(0.928) | TCGA-AA-A00N-01 | Colorectum | colon adenocarcinoma | Male | >=65 | I/II | Unknown | Unknown | PD | |
| SIAH2 | SNV | Missense_Mutation | c.966T>G | p.Cys322Trp | p.C322W | O43255 | protein_coding | deleterious_low_confidence(0) | probably_damaging(0.968) | TCGA-AA-A010-01 | Colorectum | colon adenocarcinoma | Female | <65 | I/II | Chemotherapy | folinic | CR | |
| SIAH2 | SNV | Missense_Mutation | rs137855704 | c.751N>T | p.Leu251Phe | p.L251F | O43255 | protein_coding | deleterious(0) | possibly_damaging(0.826) | TCGA-AZ-4315-01 | Colorectum | colon adenocarcinoma | Male | <65 | I/II | Unknown | Unknown | SD |
| Page: 1 2 3 4 5 |
Top |
Related drugs of malignant transformation related genes |
| Identification of chemicals and drugs interact with genes involved in malignant transfromation |
| (DGIdb 4.0) |
| Entrez ID | Symbol | Category | Interaction Types | Drug Claim Name | Drug Name | PMIDs |
| Page: 1 |

Copyright 2023-Present -The University of Texas Health Science Center at Houston |