
|
|||||
|
 | |
| |
| |
| |
| |
| |
|
Gene: SERPINB5 |
Gene summary for SERPINB5 |
| Gene information | Species | Human | Gene symbol | SERPINB5 | Gene ID | 5268 |
| Gene name | serpin family B member 5 | |
| Gene Alias | PI5 | |
| Cytomap | 18q21.33 | |
| Gene Type | protein-coding | GO ID | GO:0000003 | UniProtAcc | A0A024R2B6 |
Top |
Malignant transformation analysis |
| Identification of the aberrant gene expression in precancerous and cancerous lesions by comparing the gene expression of stem-like cells in diseased tissues with normal stem cells |
| Entrez ID | Symbol | Replicates | Species | Organ | Tissue | Adj P-value | Log2FC | Malignancy |
| 5268 | SERPINB5 | CA_HPV_1 | Human | Cervix | CC | 2.14e-04 | -2.16e-01 | 0.0264 |
| 5268 | SERPINB5 | CA_HPV_2 | Human | Cervix | CC | 7.92e-06 | 3.27e-01 | 0.0391 |
| 5268 | SERPINB5 | CA_HPV_3 | Human | Cervix | CC | 4.96e-03 | 9.06e-02 | 0.0414 |
| 5268 | SERPINB5 | Tumor | Human | Cervix | CC | 1.24e-77 | 1.22e+00 | 0.1241 |
| 5268 | SERPINB5 | sample3 | Human | Cervix | CC | 5.08e-92 | 1.20e+00 | 0.1387 |
| 5268 | SERPINB5 | L1 | Human | Cervix | CC | 9.35e-03 | 3.78e-01 | 0.0802 |
| 5268 | SERPINB5 | T3 | Human | Cervix | CC | 9.52e-85 | 1.22e+00 | 0.1389 |
| 5268 | SERPINB5 | HTA11_3410_2000001011 | Human | Colorectum | AD | 6.55e-04 | 1.47e-01 | 0.0155 |
| 5268 | SERPINB5 | HTA11_2487_2000001011 | Human | Colorectum | SER | 5.80e-07 | 3.54e-01 | -0.1808 |
| 5268 | SERPINB5 | HTA11_1938_2000001011 | Human | Colorectum | AD | 1.39e-17 | 5.52e-01 | -0.0811 |
| 5268 | SERPINB5 | HTA11_78_2000001011 | Human | Colorectum | AD | 2.54e-12 | 4.35e-01 | -0.1088 |
| 5268 | SERPINB5 | HTA11_411_2000001011 | Human | Colorectum | SER | 2.78e-05 | 5.36e-01 | -0.2602 |
| 5268 | SERPINB5 | HTA11_1391_2000001011 | Human | Colorectum | AD | 2.00e-12 | 4.56e-01 | -0.059 |
| 5268 | SERPINB5 | HTA11_8622_2000001021 | Human | Colorectum | SER | 4.45e-03 | 1.82e-01 | 0.0528 |
| 5268 | SERPINB5 | HTA11_6818_2000001021 | Human | Colorectum | AD | 3.09e-05 | 1.93e-01 | 0.0588 |
| 5268 | SERPINB5 | HTA11_99999970781_79442 | Human | Colorectum | MSS | 1.96e-10 | 2.26e-01 | 0.294 |
| 5268 | SERPINB5 | HTA11_99999965062_69753 | Human | Colorectum | MSI-H | 3.42e-04 | 5.35e-01 | 0.3487 |
| 5268 | SERPINB5 | HTA11_99999965104_69814 | Human | Colorectum | MSS | 1.93e-12 | 3.68e-01 | 0.281 |
| 5268 | SERPINB5 | HTA11_99999971662_82457 | Human | Colorectum | MSS | 2.03e-09 | 2.20e-01 | 0.3859 |
| 5268 | SERPINB5 | LZE4T | Human | Esophagus | ESCC | 6.39e-04 | 6.17e-01 | 0.0811 |
| Page: 1 2 3 4 5 6 7 |
| Tissue | Expression Dynamics | Abbreviation |
| Cervix | 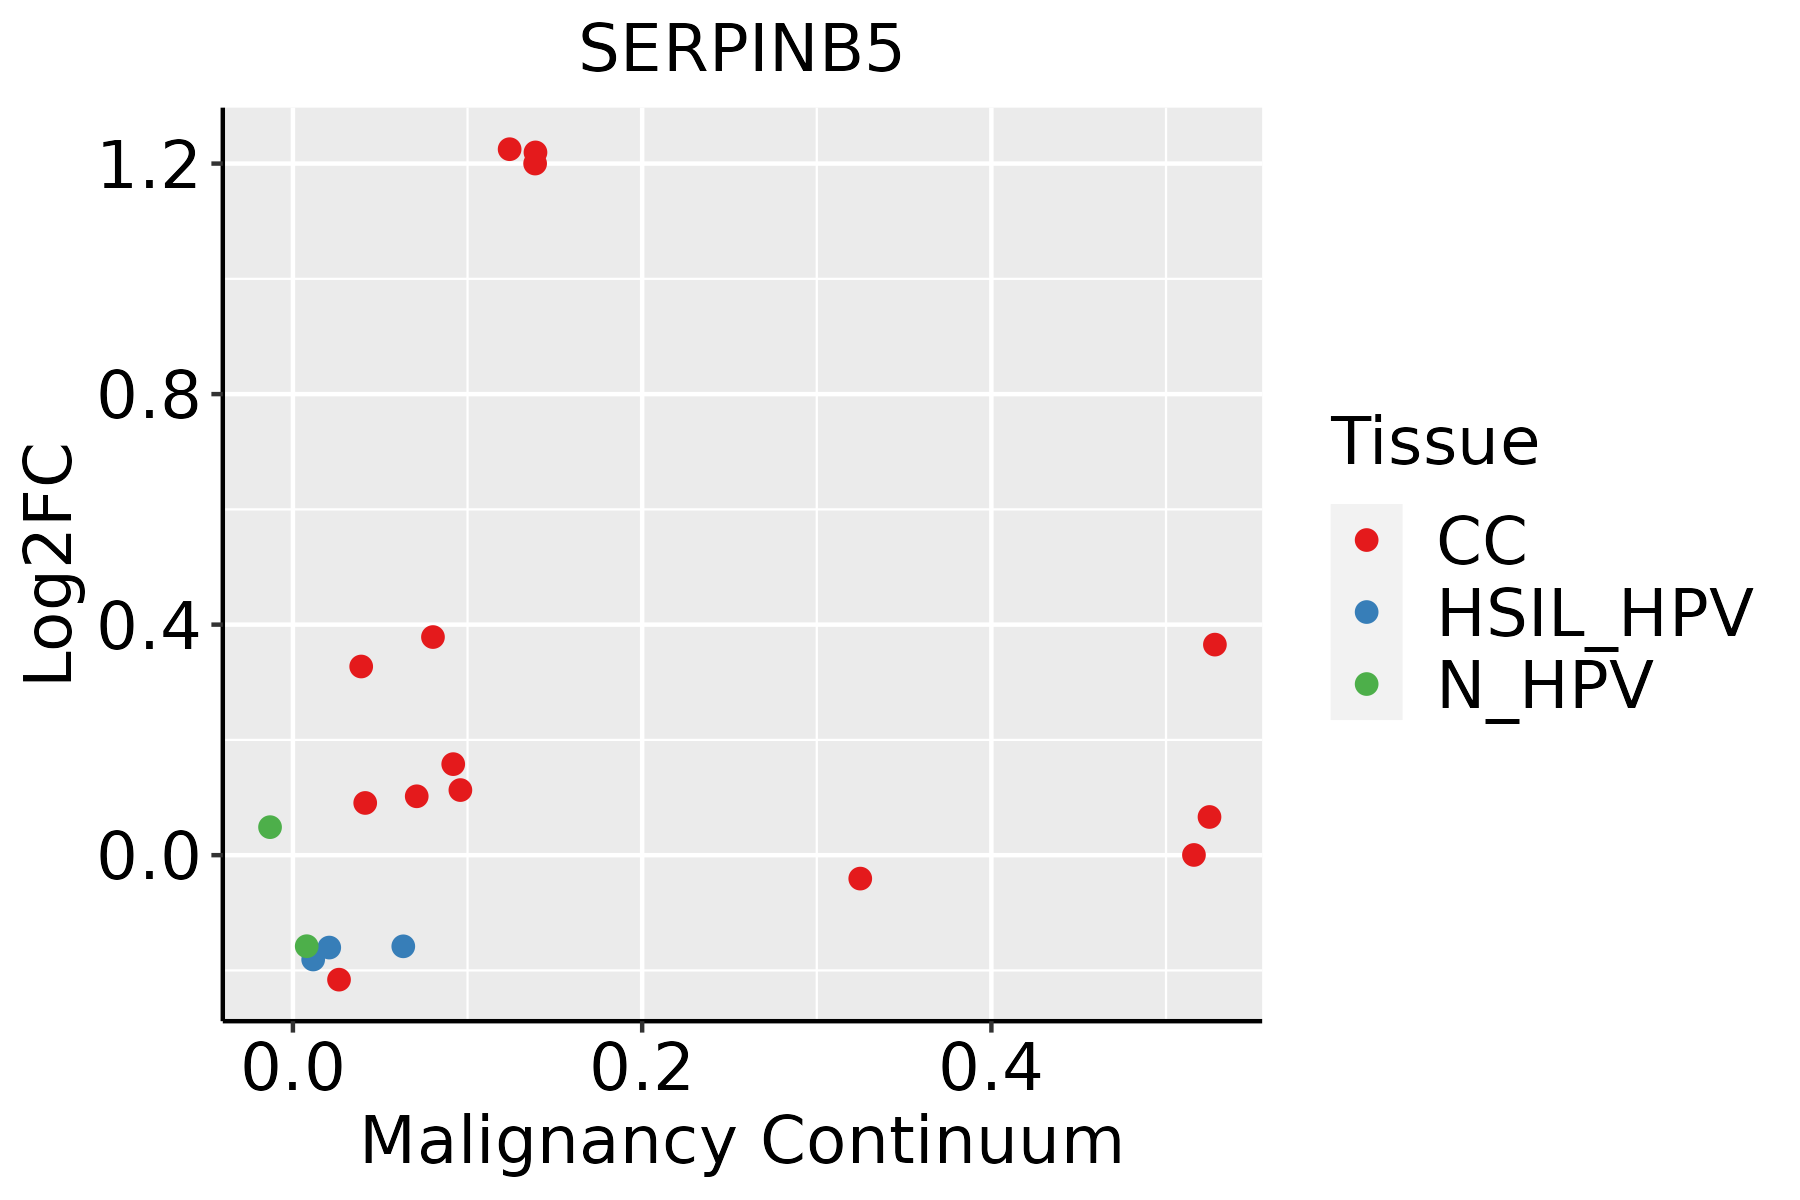 | CC: Cervix cancer |
| HSIL_HPV: HPV-infected high-grade squamous intraepithelial lesions | ||
| N_HPV: HPV-infected normal cervix | ||
| Colorectum (GSE201348) |  | FAP: Familial adenomatous polyposis |
| CRC: Colorectal cancer | ||
| Colorectum (HTA11) |  | AD: Adenomas |
| SER: Sessile serrated lesions | ||
| MSI-H: Microsatellite-high colorectal cancer | ||
| MSS: Microsatellite stable colorectal cancer | ||
| Esophagus | 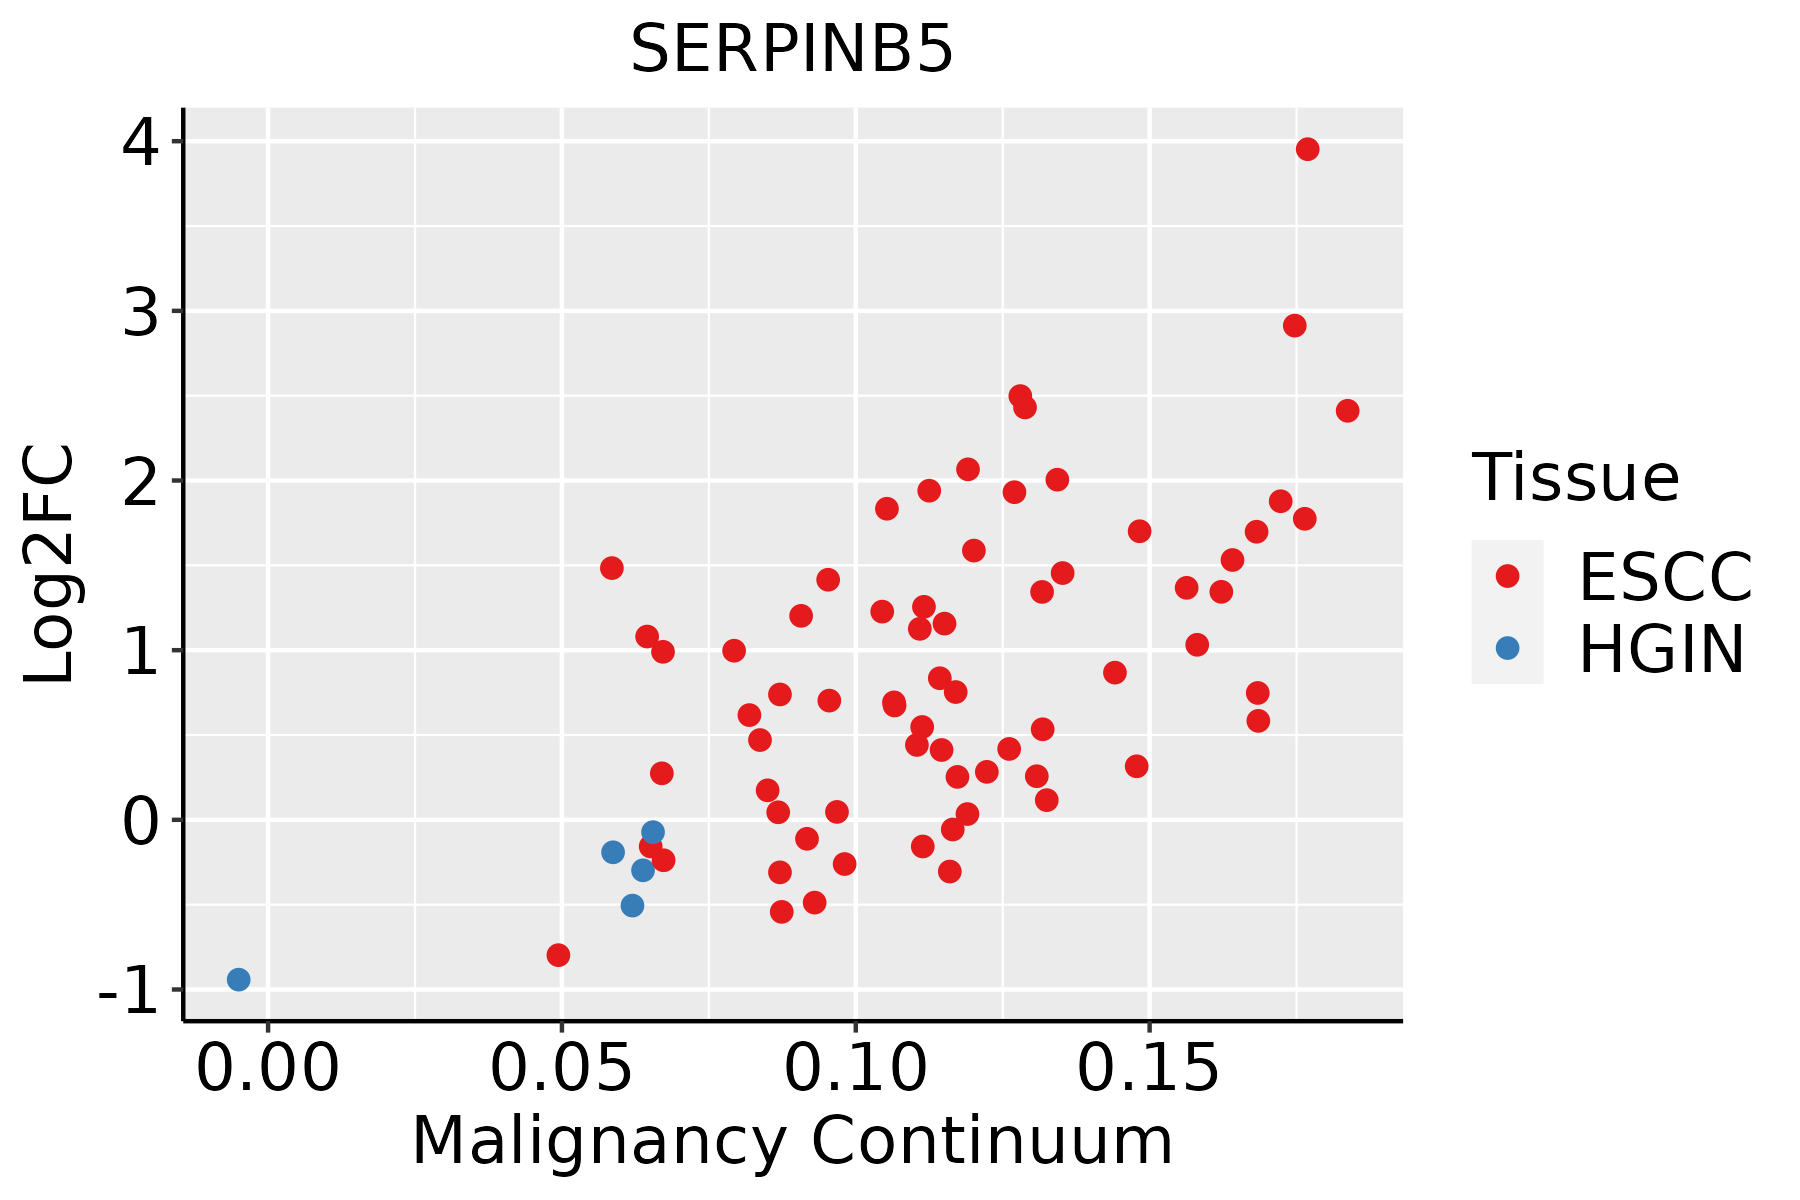 | ESCC: Esophageal squamous cell carcinoma |
| HGIN: High-grade intraepithelial neoplasias | ||
| LGIN: Low-grade intraepithelial neoplasias | ||
| GC | 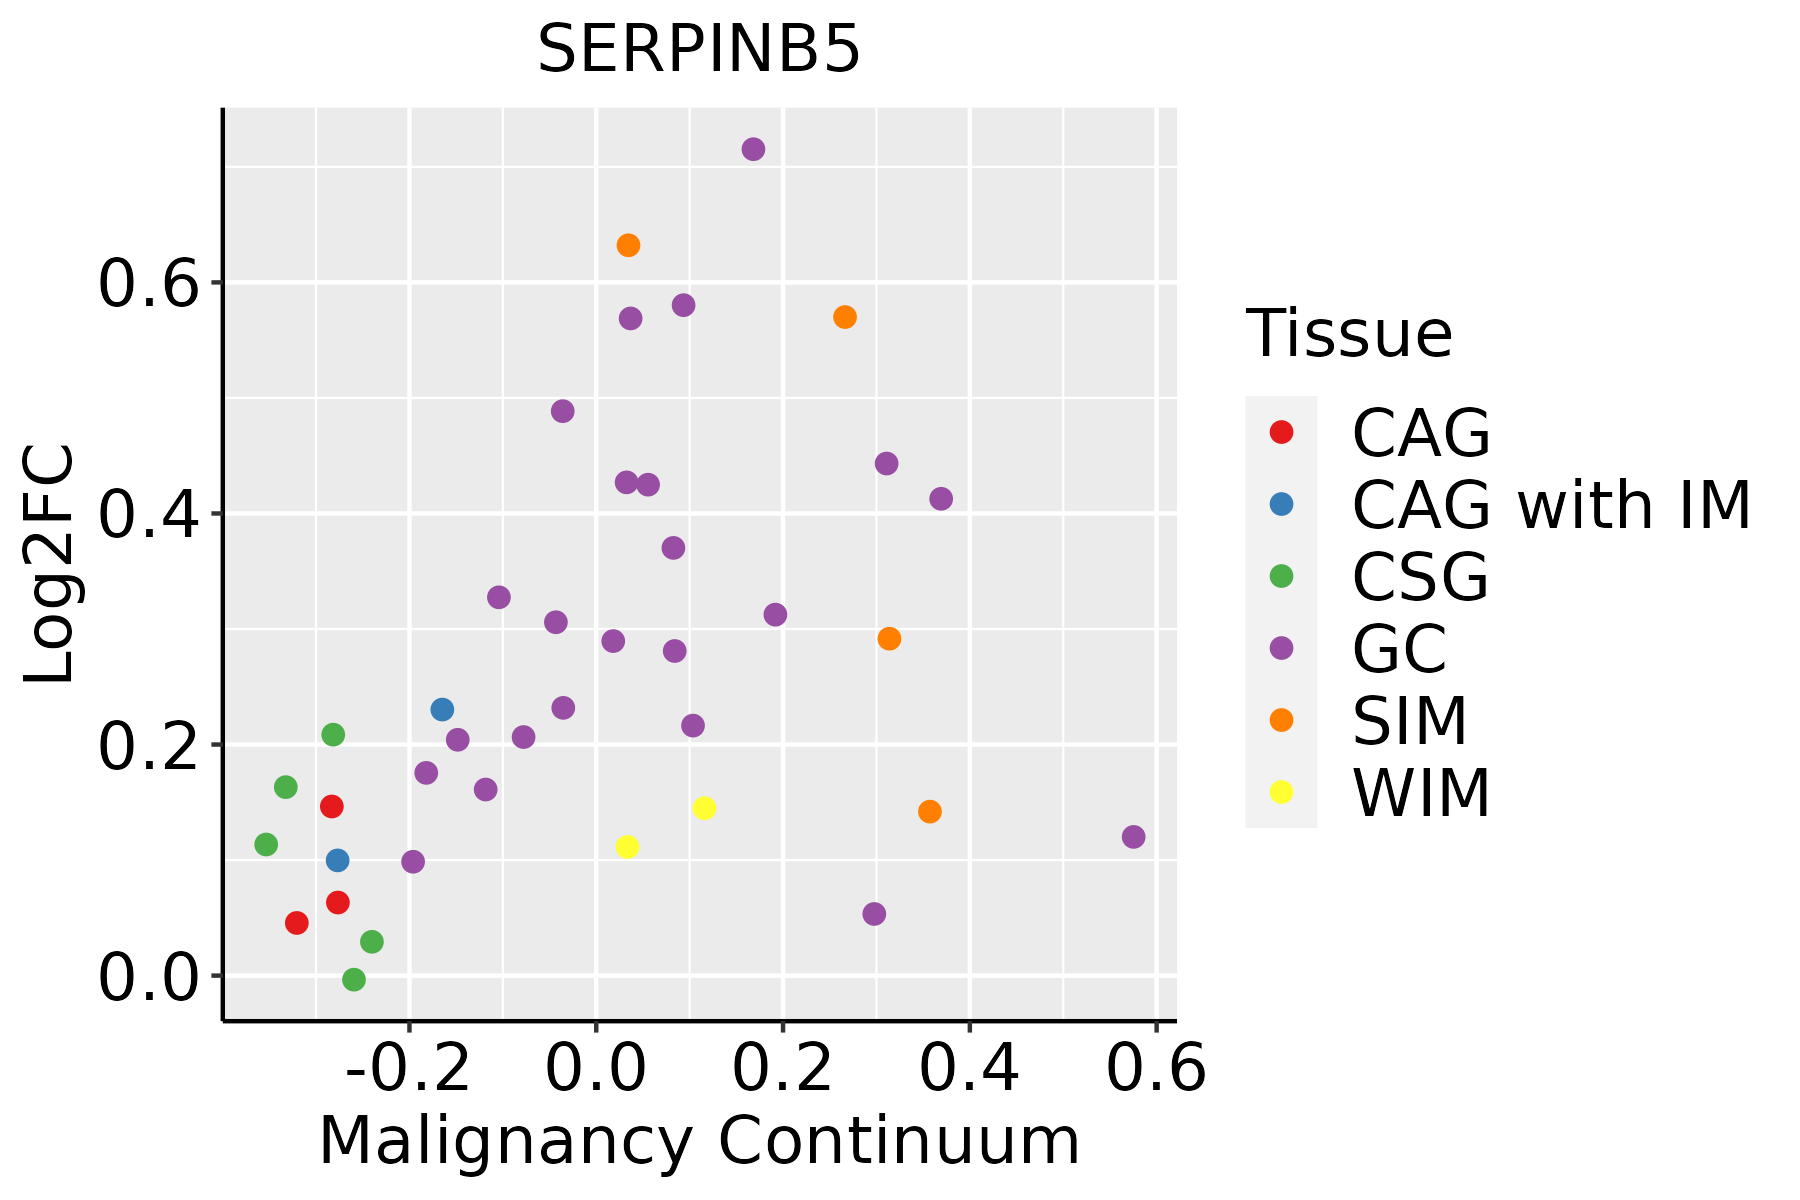 | CAG: Chronic atrophic gastritis |
| CAG with IM: Chronic atrophic gastritis with intestinal metaplasia | ||
| CSG: Chronic superficial gastritis | ||
| GC: Gastric cancer | ||
| SIM: Severe intestinal metaplasia | ||
| WIM: Wild intestinal metaplasia | ||
| Oral Cavity |  | EOLP: Erosive Oral lichen planus |
| LP: leukoplakia | ||
| NEOLP: Non-erosive oral lichen planus | ||
| OSCC: Oral squamous cell carcinoma | ||
| Prostate | 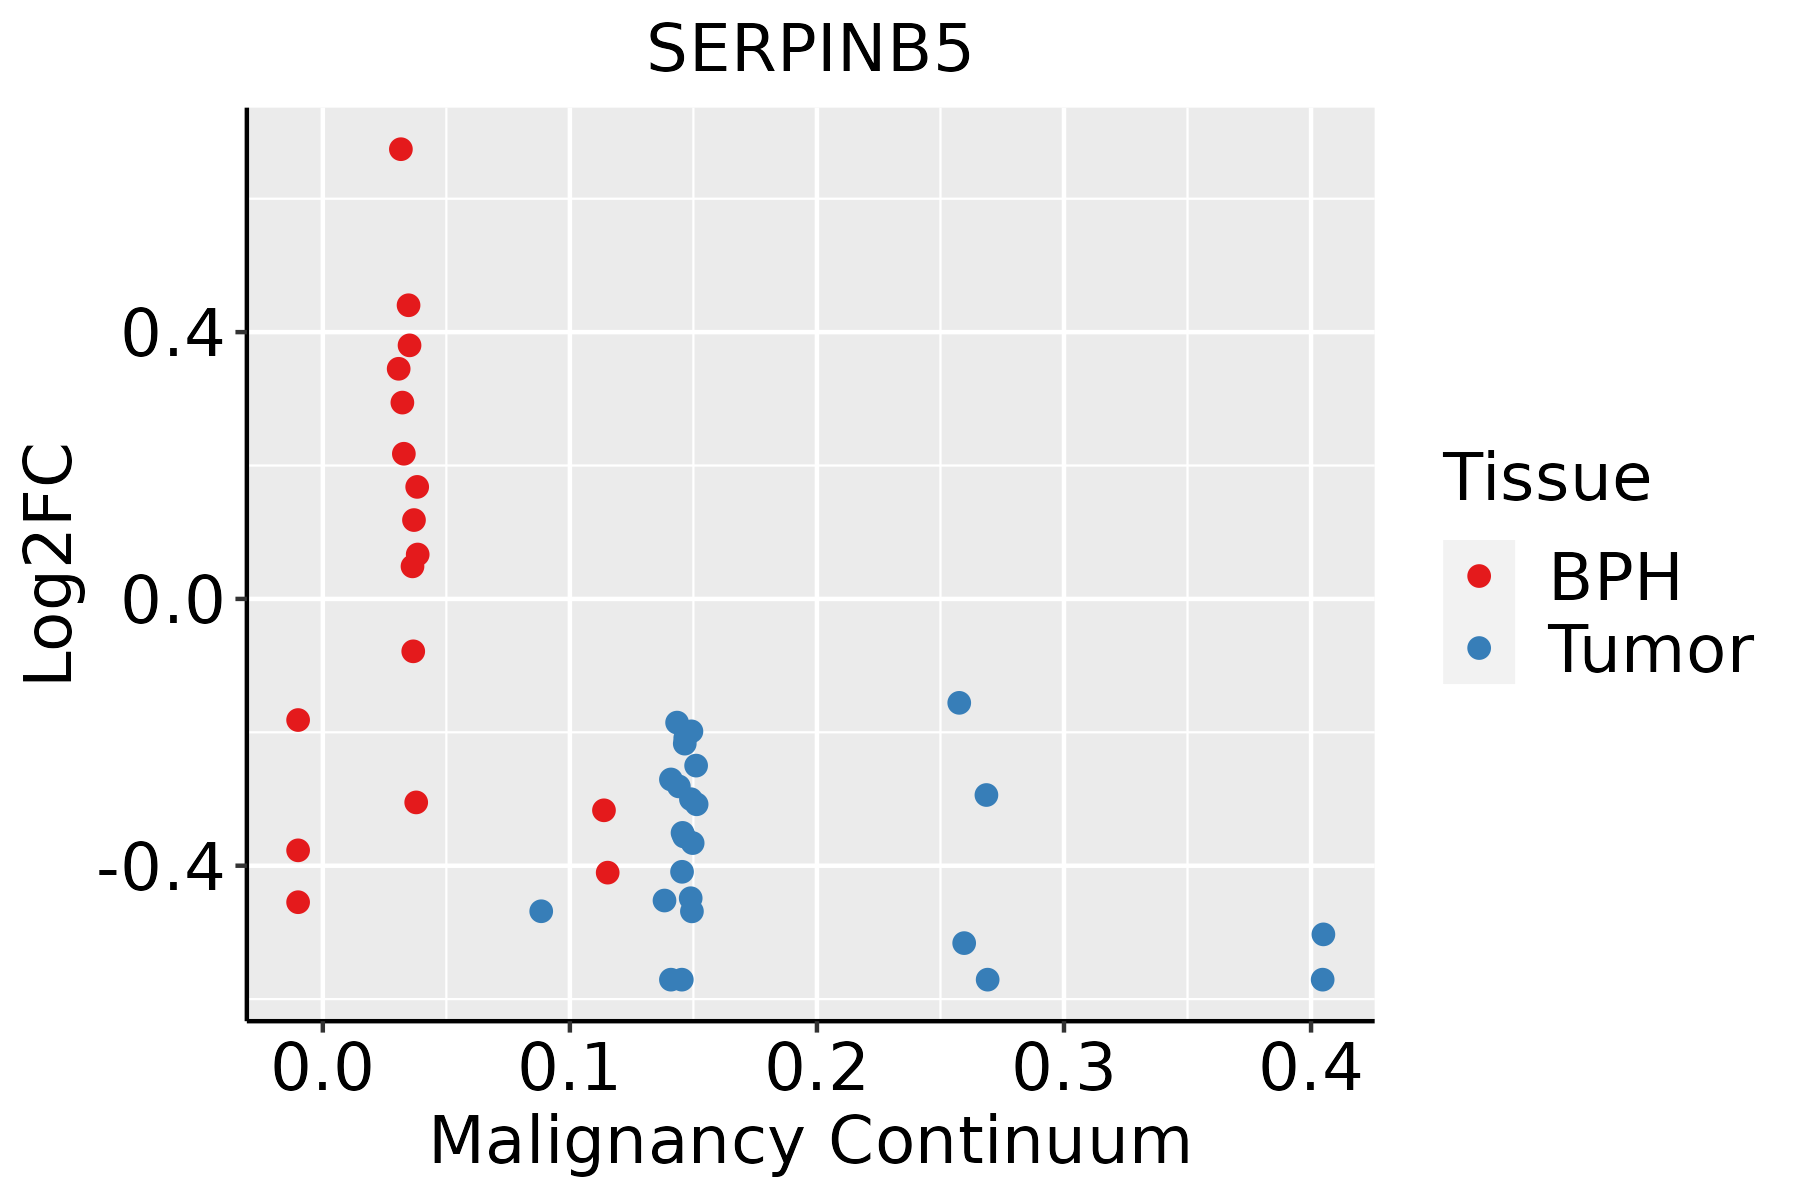 | BPH: Benign Prostatic Hyperplasia |
| Skin | 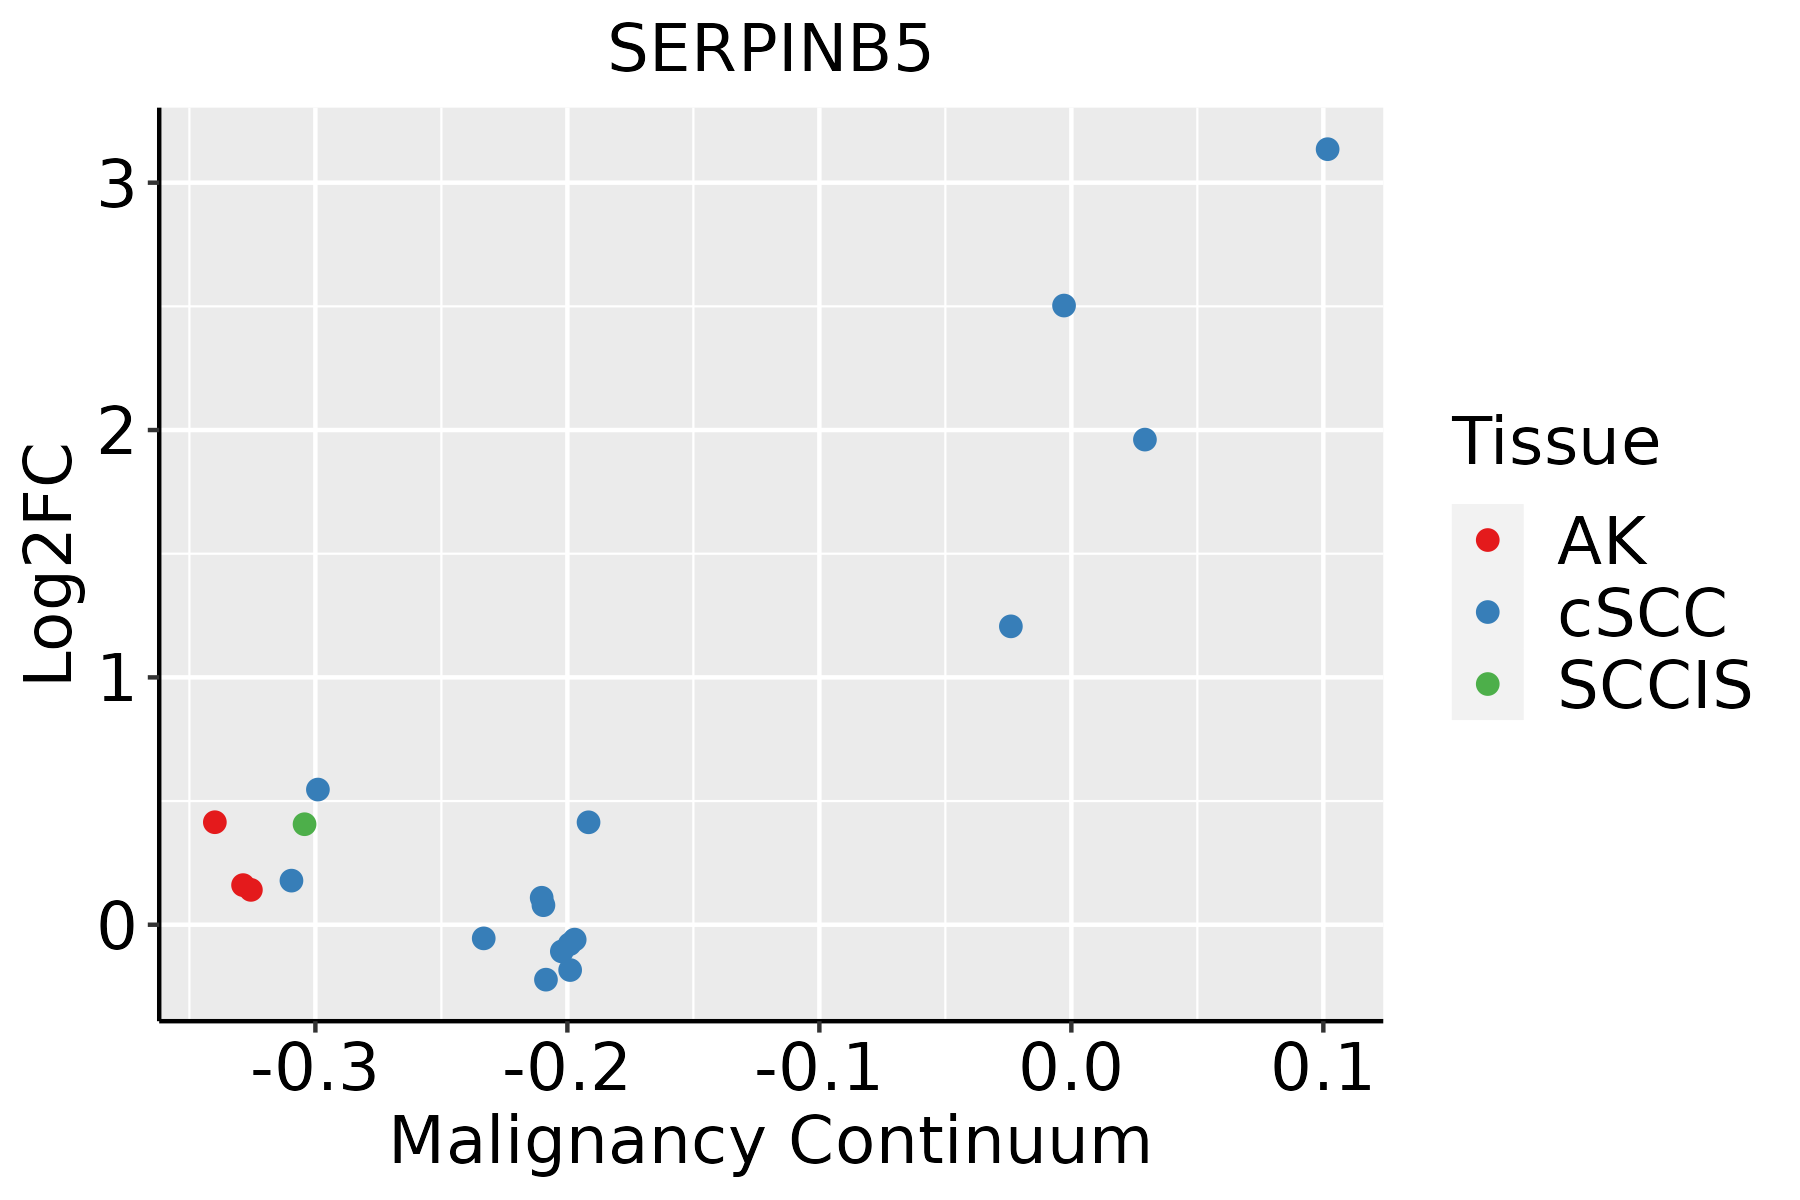 | AK: Actinic keratosis |
| cSCC: Cutaneous squamous cell carcinoma | ||
| SCCIS:squamous cell carcinoma in situ |
| ∗log2FC in expression of this searched gene in stem-like cells from each diseased tissue sample relative to stem-like cells in normal samples in each tissue plotted against the malignancy continuum. Samples are colored based on if they are from different disease stage. |
Top |
Malignant transformation related pathway analysis |
| Find out the enriched GO biological processes and KEGG pathways involved in transition from healthy to precancer to cancer |
| Tissue | Disease Stage | Enriched GO biological Processes |
| Colorectum | AD |  |
| Colorectum | SER |  |
| Colorectum | MSS |  |
| Colorectum | MSI-H |  |
| Colorectum | FAP |  |
| ∗Top 15 enriched GO BP terms are showed in the bar plot of each disease state in each tissue. Each row represents a significant GO biological process which is colored according to the -log10(p.adjust). |
| Page: 1 2 3 4 5 6 7 8 9 |
| GO ID | Tissue | Disease Stage | Description | Gene Ratio | Bg Ratio | pvalue | p.adjust | Count |
| GO:004586128 | Skin | cSCC | negative regulation of proteolysis | 128/4864 | 351/18723 | 7.95e-06 | 1.09e-04 | 128 |
| GO:006145825 | Skin | cSCC | reproductive system development | 149/4864 | 427/18723 | 2.30e-05 | 2.65e-04 | 149 |
| GO:004860824 | Skin | cSCC | reproductive structure development | 148/4864 | 424/18723 | 2.40e-05 | 2.74e-04 | 148 |
| GO:005134627 | Skin | cSCC | negative regulation of hydrolase activity | 130/4864 | 379/18723 | 1.74e-04 | 1.49e-03 | 130 |
| GO:001095125 | Skin | cSCC | negative regulation of endopeptidase activity | 89/4864 | 252/18723 | 6.05e-04 | 4.38e-03 | 89 |
| GO:005067324 | Skin | cSCC | epithelial cell proliferation | 144/4864 | 437/18723 | 6.07e-04 | 4.38e-03 | 144 |
| GO:001046626 | Skin | cSCC | negative regulation of peptidase activity | 91/4864 | 262/18723 | 9.73e-04 | 6.58e-03 | 91 |
| GO:002261221 | Skin | cSCC | gland morphogenesis | 45/4864 | 118/18723 | 2.43e-03 | 1.39e-02 | 45 |
| GO:00525476 | Stomach | GC | regulation of peptidase activity | 67/1159 | 461/18723 | 5.35e-11 | 1.10e-08 | 67 |
| GO:00525486 | Stomach | GC | regulation of endopeptidase activity | 63/1159 | 432/18723 | 1.76e-10 | 2.82e-08 | 63 |
| GO:00458616 | Stomach | GC | negative regulation of proteolysis | 50/1159 | 351/18723 | 2.96e-08 | 2.33e-06 | 50 |
| GO:00513466 | Stomach | GC | negative regulation of hydrolase activity | 51/1159 | 379/18723 | 1.38e-07 | 8.14e-06 | 51 |
| GO:00104666 | Stomach | GC | negative regulation of peptidase activity | 38/1159 | 262/18723 | 8.47e-07 | 4.18e-05 | 38 |
| GO:00109516 | Stomach | GC | negative regulation of endopeptidase activity | 37/1159 | 252/18723 | 8.69e-07 | 4.26e-05 | 37 |
| GO:00487326 | Stomach | GC | gland development | 49/1159 | 436/18723 | 3.88e-05 | 9.90e-04 | 49 |
| GO:00506784 | Stomach | GC | regulation of epithelial cell proliferation | 39/1159 | 381/18723 | 1.42e-03 | 1.55e-02 | 39 |
| GO:00506734 | Stomach | GC | epithelial cell proliferation | 42/1159 | 437/18723 | 3.13e-03 | 2.78e-02 | 42 |
| GO:005254711 | Stomach | CAG with IM | regulation of peptidase activity | 61/1050 | 461/18723 | 3.60e-10 | 6.00e-08 | 61 |
| GO:005254811 | Stomach | CAG with IM | regulation of endopeptidase activity | 58/1050 | 432/18723 | 5.62e-10 | 8.56e-08 | 58 |
| GO:004586111 | Stomach | CAG with IM | negative regulation of proteolysis | 45/1050 | 351/18723 | 1.90e-07 | 1.24e-05 | 45 |
| Page: 1 2 3 4 5 6 7 8 9 10 11 12 13 |
| Pathway ID | Tissue | Disease Stage | Description | Gene Ratio | Bg Ratio | pvalue | p.adjust | qvalue | Count |
| hsa0411510 | Esophagus | HGIN | p53 signaling pathway | 21/1383 | 74/8465 | 6.25e-03 | 4.25e-02 | 3.37e-02 | 21 |
| hsa0411515 | Esophagus | HGIN | p53 signaling pathway | 21/1383 | 74/8465 | 6.25e-03 | 4.25e-02 | 3.37e-02 | 21 |
| hsa0411524 | Esophagus | ESCC | p53 signaling pathway | 65/4205 | 74/8465 | 3.88e-12 | 6.50e-11 | 3.33e-11 | 65 |
| hsa0411534 | Esophagus | ESCC | p53 signaling pathway | 65/4205 | 74/8465 | 3.88e-12 | 6.50e-11 | 3.33e-11 | 65 |
| hsa041159 | Oral cavity | OSCC | p53 signaling pathway | 57/3704 | 74/8465 | 4.99e-09 | 5.07e-08 | 2.58e-08 | 57 |
| hsa0411514 | Oral cavity | OSCC | p53 signaling pathway | 57/3704 | 74/8465 | 4.99e-09 | 5.07e-08 | 2.58e-08 | 57 |
| hsa0411523 | Oral cavity | LP | p53 signaling pathway | 38/2418 | 74/8465 | 2.82e-05 | 1.92e-04 | 1.24e-04 | 38 |
| hsa0411533 | Oral cavity | LP | p53 signaling pathway | 38/2418 | 74/8465 | 2.82e-05 | 1.92e-04 | 1.24e-04 | 38 |
| hsa041158 | Prostate | BPH | p53 signaling pathway | 30/1718 | 74/8465 | 5.15e-05 | 3.40e-04 | 2.10e-04 | 30 |
| hsa0411513 | Prostate | BPH | p53 signaling pathway | 30/1718 | 74/8465 | 5.15e-05 | 3.40e-04 | 2.10e-04 | 30 |
| hsa0411522 | Prostate | Tumor | p53 signaling pathway | 29/1791 | 74/8465 | 2.99e-04 | 1.65e-03 | 1.02e-03 | 29 |
| hsa0411532 | Prostate | Tumor | p53 signaling pathway | 29/1791 | 74/8465 | 2.99e-04 | 1.65e-03 | 1.02e-03 | 29 |
| hsa04115 | Stomach | GC | p53 signaling pathway | 13/708 | 74/8465 | 7.76e-03 | 4.10e-02 | 2.88e-02 | 13 |
| hsa041151 | Stomach | GC | p53 signaling pathway | 13/708 | 74/8465 | 7.76e-03 | 4.10e-02 | 2.88e-02 | 13 |
| hsa041152 | Stomach | CAG with IM | p53 signaling pathway | 12/640 | 74/8465 | 9.02e-03 | 4.86e-02 | 3.41e-02 | 12 |
| hsa041153 | Stomach | CAG with IM | p53 signaling pathway | 12/640 | 74/8465 | 9.02e-03 | 4.86e-02 | 3.41e-02 | 12 |
| Page: 1 |
Top |
Cell-cell communication analysis |
| Identification of potential cell-cell interactions between two cell types and their ligand-receptor pairs for different disease states |
| Ligand | Receptor | LRpair | Pathway | Tissue | Disease Stage |
| Page: 1 |
Top |
Single-cell gene regulatory network inference analysis |
| Find out the significant the regulons (TFs) and the target genes of each regulon across cell types for different disease states |
| TF | Cell Type | Tissue | Disease Stage | Target Gene | RSS | Regulon Activity |
| ∗The dot plots of a searched regulon are shown for all cell subpopulations in each disease state of each tissue based on the regulon specific score inferred using pySCENIC and by calculating the average expression. |
| Page: 1 |
Top |
Somatic mutation of malignant transformation related genes |
| Annotation of somatic variants for genes involved in malignant transformation |
| Hugo Symbol | Variant Class | Variant Classification | dbSNP RS | HGVSc | HGVSp | HGVSp Short | SWISSPROT | BIOTYPE | SIFT | PolyPhen | Tumor Sample Barcode | Tissue | Histology | Sex | Age | Stage | Therapy Types | Drugs | Outcome |
| SERPINB5 | SNV | Missense_Mutation | c.781N>G | p.Pro261Ala | p.P261A | P36952 | protein_coding | deleterious(0.03) | possibly_damaging(0.899) | TCGA-D8-A1JA-01 | Breast | breast invasive carcinoma | Female | <65 | III/IV | Chemotherapy | adriamycin | PD | |
| SERPINB5 | SNV | Missense_Mutation | novel | c.580N>G | p.Pro194Ala | p.P194A | P36952 | protein_coding | deleterious(0.05) | benign(0.011) | TCGA-5M-AAT4-01 | Colorectum | colon adenocarcinoma | Male | >=65 | III/IV | Unknown | Unknown | PD |
| SERPINB5 | SNV | Missense_Mutation | novel | c.519N>T | p.Lys173Asn | p.K173N | P36952 | protein_coding | tolerated(0.09) | probably_damaging(0.983) | TCGA-EI-6917-01 | Colorectum | rectum adenocarcinoma | Male | <65 | III/IV | Chemotherapy | 5fluorouracil+oxaciplatina+l-folinian | SD |
| SERPINB5 | insertion | In_Frame_Ins | novel | c.942_943insATGGTG | p.Ala314_Leu315insMetVal | p.A314_L315insMV | P36952 | protein_coding | TCGA-AM-5820-01 | Colorectum | colon adenocarcinoma | Female | <65 | I/II | Unknown | Unknown | SD | ||
| SERPINB5 | deletion | Frame_Shift_Del | c.665delN | p.Asn223IlefsTer59 | p.N223Ifs*59 | P36952 | protein_coding | TCGA-CM-4746-01 | Colorectum | colon adenocarcinoma | Male | <65 | I/II | Unknown | Unknown | SD | |||
| SERPINB5 | SNV | Missense_Mutation | novel | c.193G>T | p.Asp65Tyr | p.D65Y | P36952 | protein_coding | deleterious(0) | possibly_damaging(0.906) | TCGA-AJ-A3EL-01 | Endometrium | uterine corpus endometrioid carcinoma | Female | <65 | I/II | Unknown | Unknown | SD |
| SERPINB5 | SNV | Missense_Mutation | novel | c.892A>C | p.Ser298Arg | p.S298R | P36952 | protein_coding | deleterious(0) | benign(0.051) | TCGA-AJ-A3EL-01 | Endometrium | uterine corpus endometrioid carcinoma | Female | <65 | I/II | Unknown | Unknown | SD |
| SERPINB5 | SNV | Missense_Mutation | c.329N>T | p.Arg110Ile | p.R110I | P36952 | protein_coding | deleterious(0) | probably_damaging(0.983) | TCGA-AX-A06F-01 | Endometrium | uterine corpus endometrioid carcinoma | Female | <65 | III/IV | Chemotherapy | carboplatin | SD | |
| SERPINB5 | SNV | Missense_Mutation | novel | c.702N>T | p.Lys234Asn | p.K234N | P36952 | protein_coding | tolerated(0.22) | possibly_damaging(0.822) | TCGA-AX-A1CE-01 | Endometrium | uterine corpus endometrioid carcinoma | Female | <65 | I/II | Unspecific | Paclitaxel | SD |
| SERPINB5 | SNV | Missense_Mutation | c.1015G>A | p.Ala339Thr | p.A339T | P36952 | protein_coding | tolerated(0.35) | benign(0.011) | TCGA-B5-A0JY-01 | Endometrium | uterine corpus endometrioid carcinoma | Female | <65 | III/IV | Chemotherapy | doxorubicin | SD |
| Page: 1 2 3 |
Top |
Related drugs of malignant transformation related genes |
| Identification of chemicals and drugs interact with genes involved in malignant transfromation |
| (DGIdb 4.0) |
| Entrez ID | Symbol | Category | Interaction Types | Drug Claim Name | Drug Name | PMIDs |
| Page: 1 |

Copyright 2023-Present -The University of Texas Health Science Center at Houston |