| Tissue | Expression Dynamics | Abbreviation |
| Esophagus |  | ESCC: Esophageal squamous cell carcinoma |
| HGIN: High-grade intraepithelial neoplasias |
| LGIN: Low-grade intraepithelial neoplasias |
| Liver | 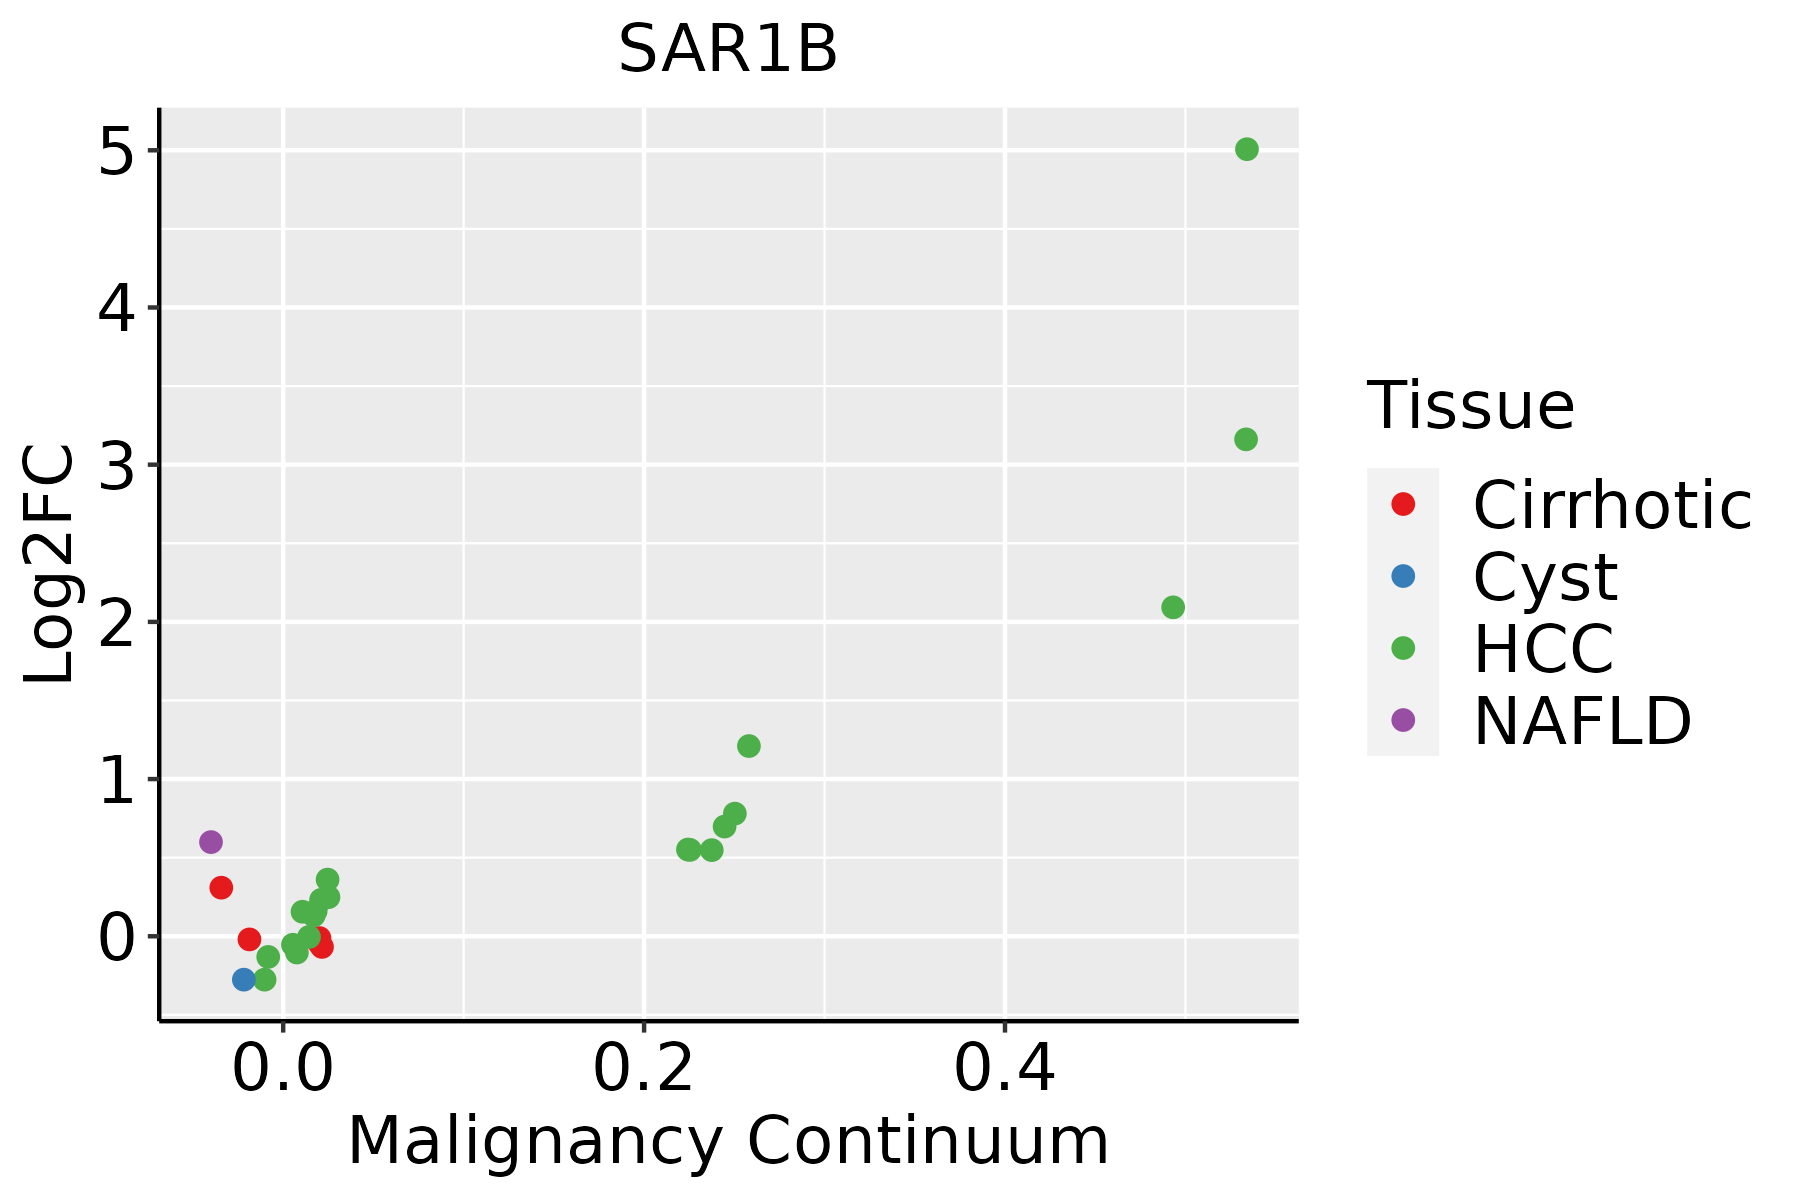 | HCC: Hepatocellular carcinoma |
| NAFLD: Non-alcoholic fatty liver disease |
| Oral Cavity |  | EOLP: Erosive Oral lichen planus |
| LP: leukoplakia |
| NEOLP: Non-erosive oral lichen planus |
| OSCC: Oral squamous cell carcinoma |
| Prostate | 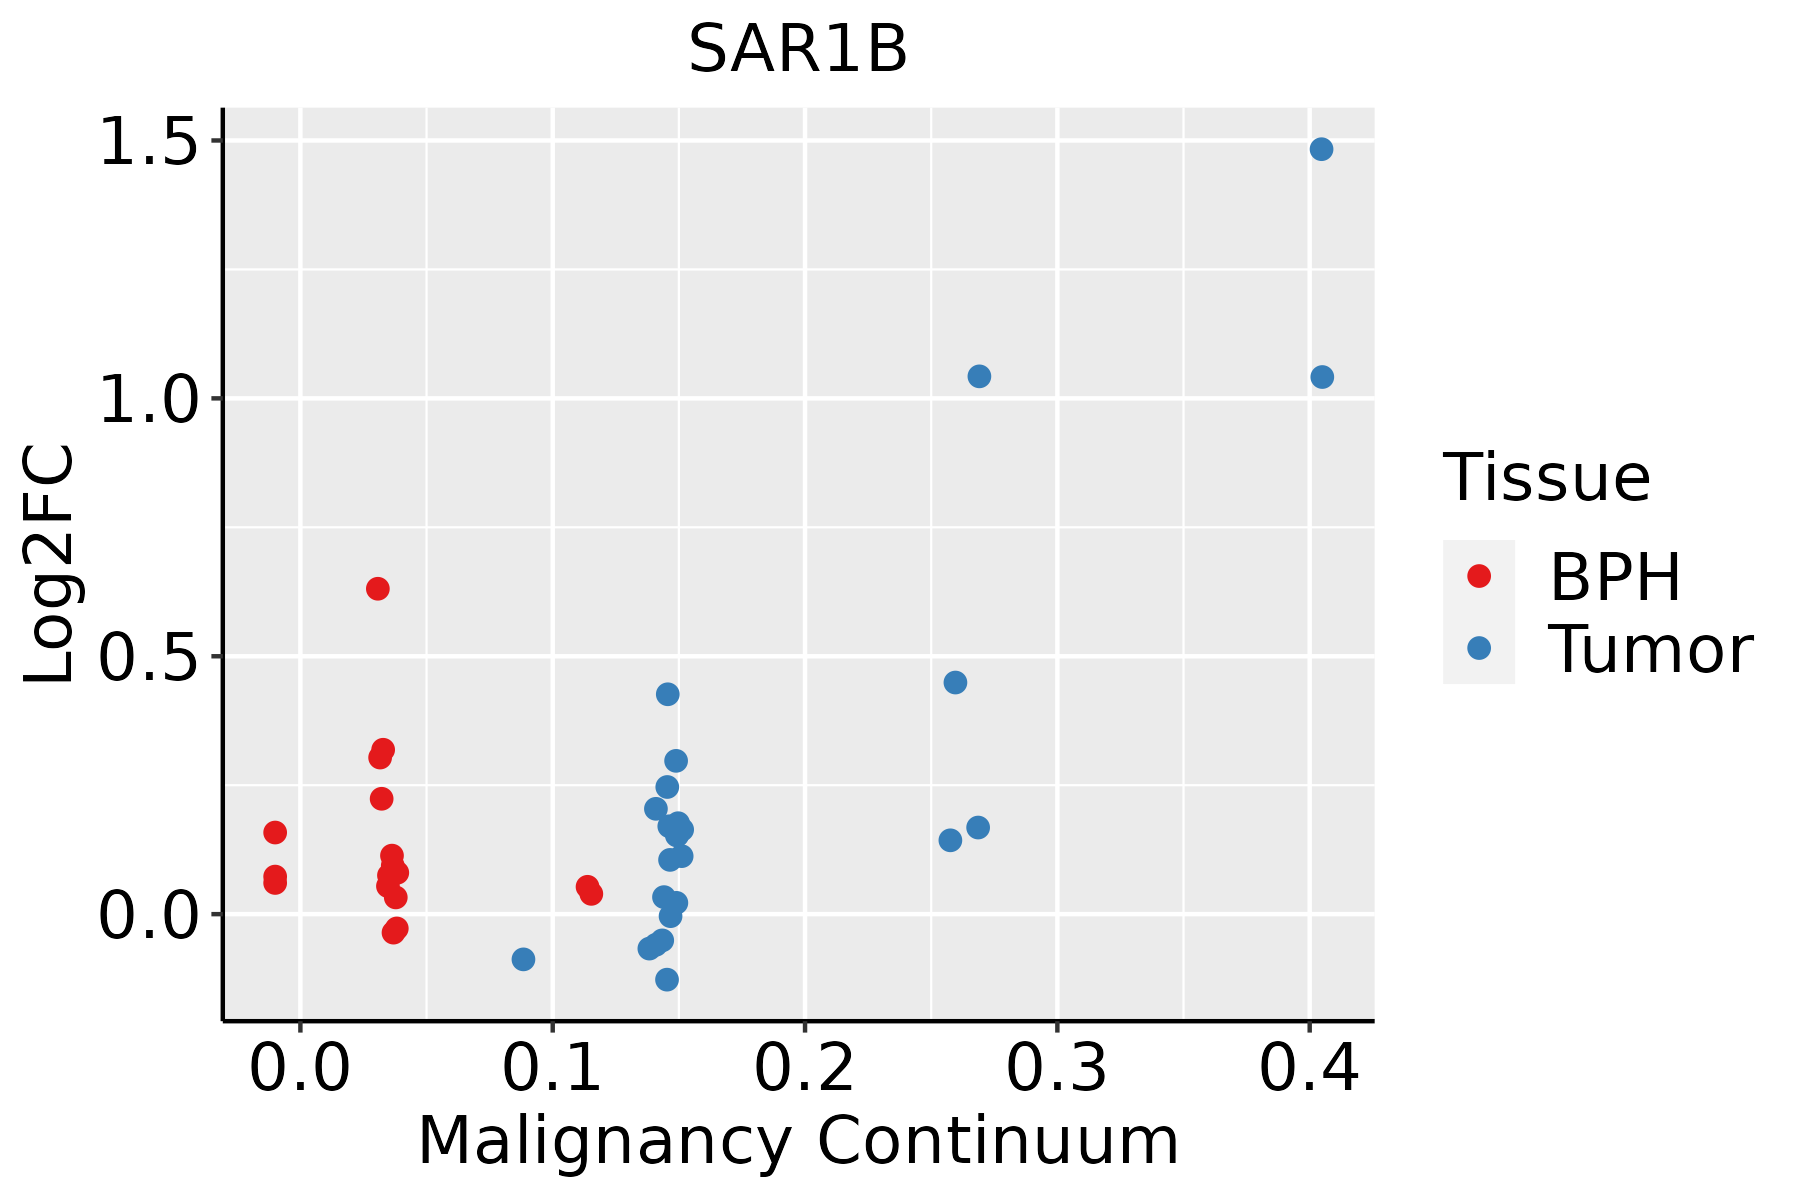 | BPH: Benign Prostatic Hyperplasia |
| Skin | 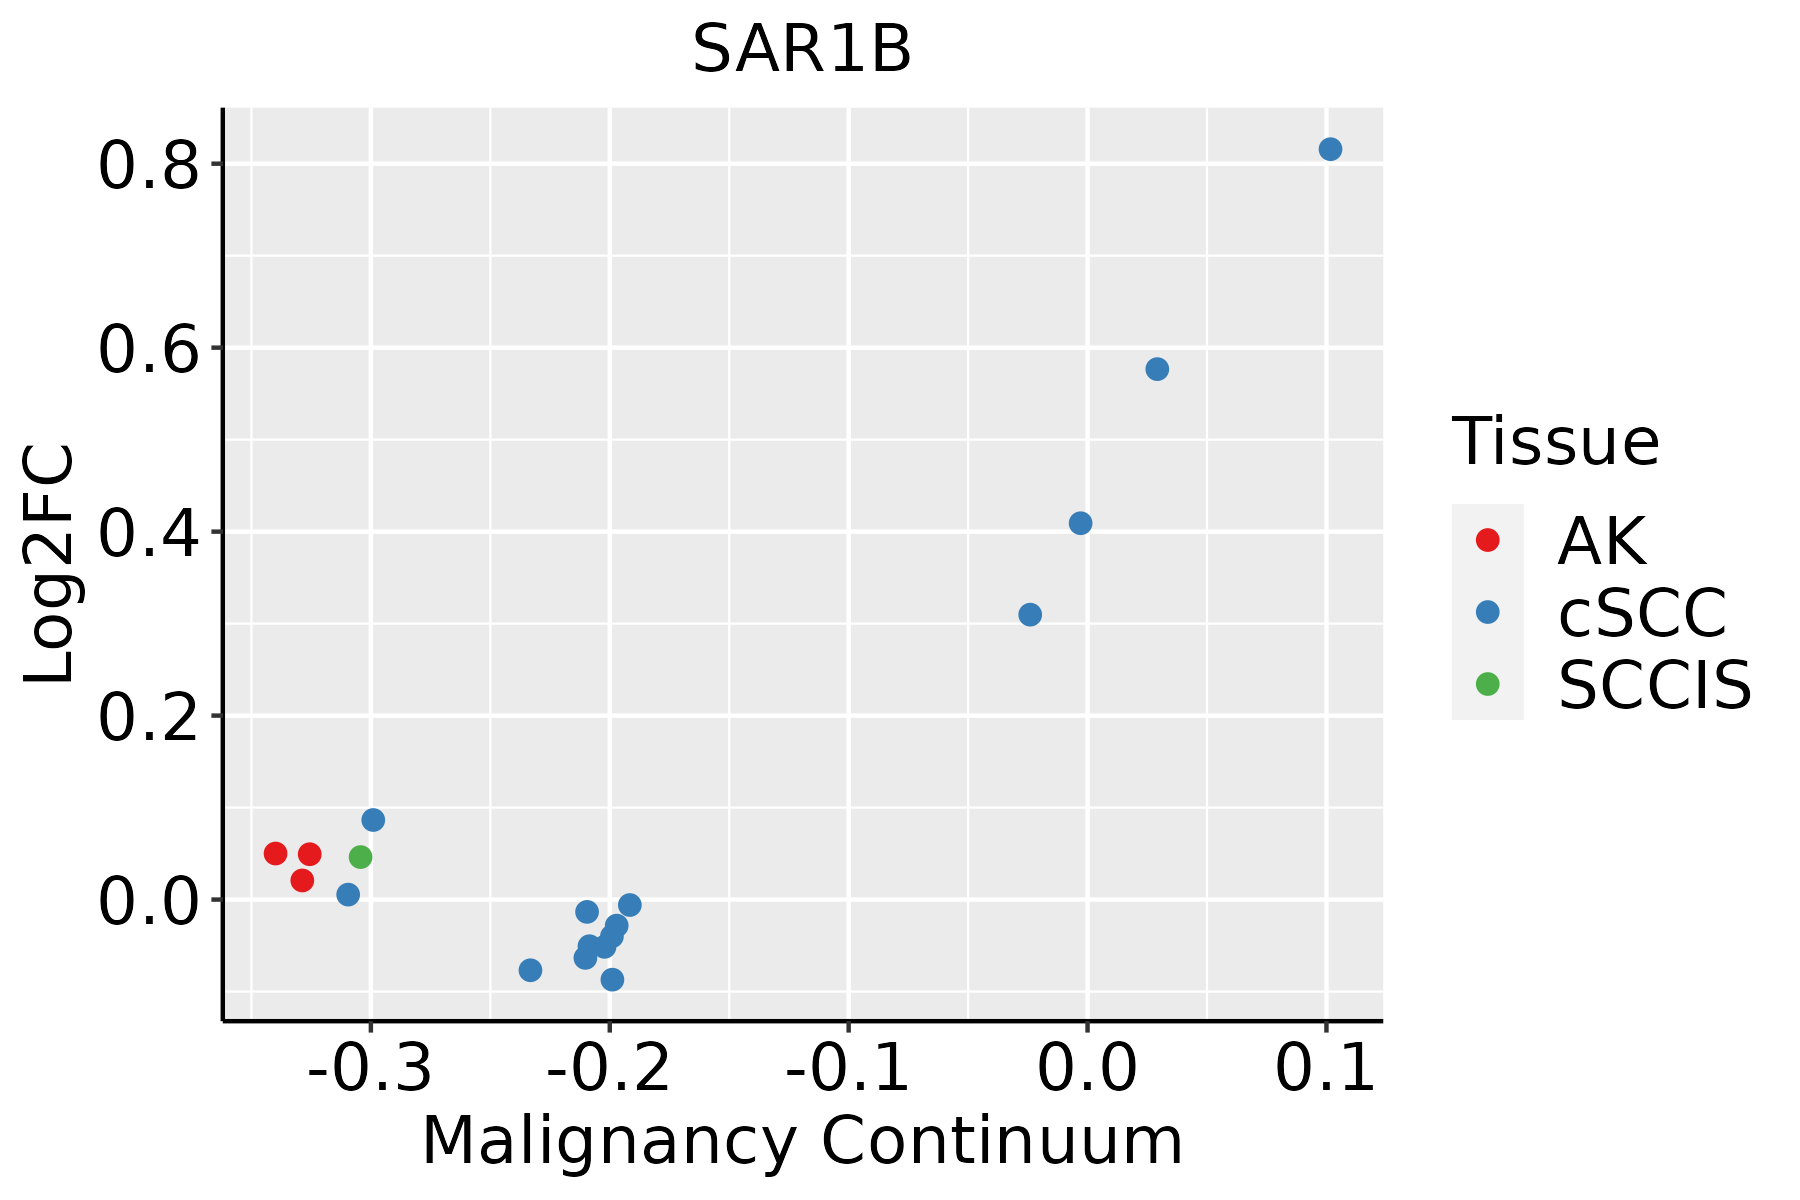 | AK: Actinic keratosis |
| cSCC: Cutaneous squamous cell carcinoma |
| SCCIS:squamous cell carcinoma in situ |
| Thyroid | 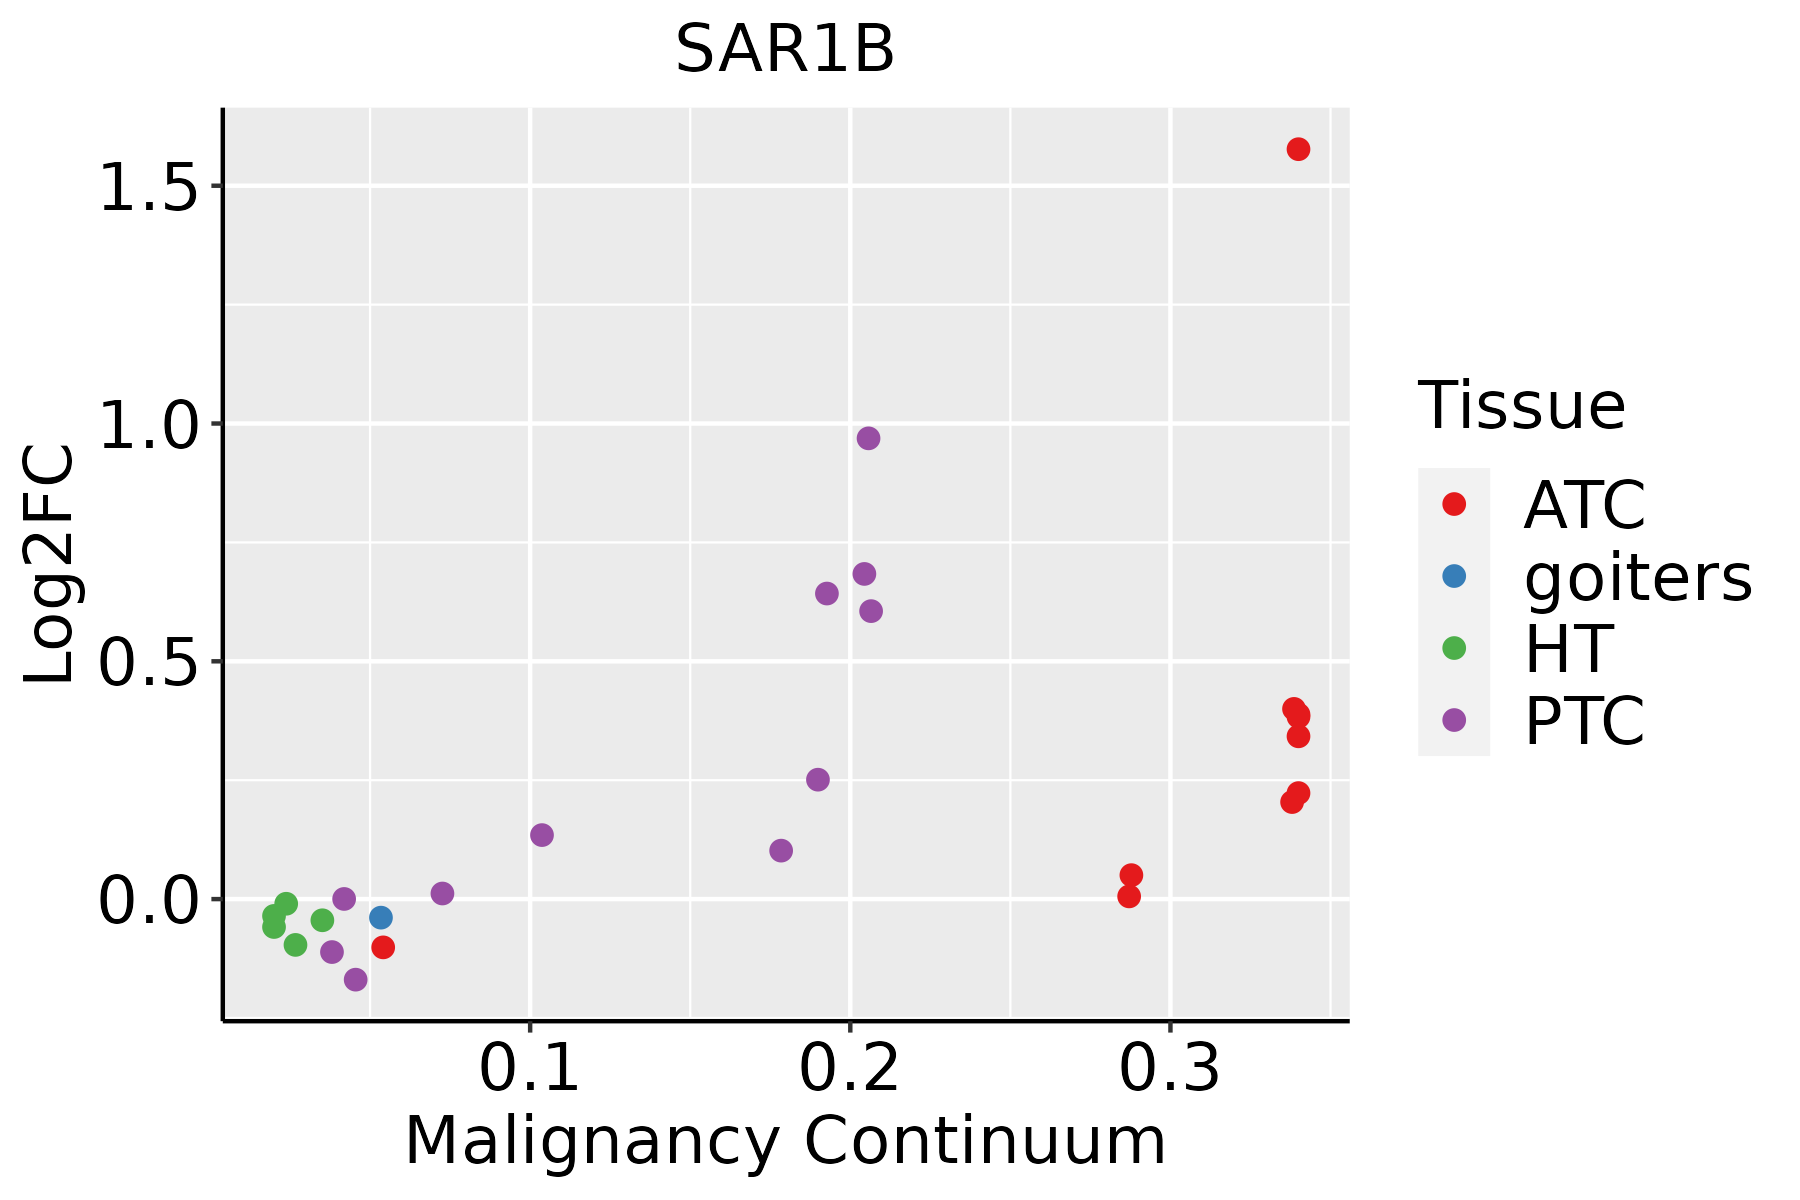 | ATC: Anaplastic thyroid cancer |
| HT: Hashimoto's thyroiditis |
| PTC: Papillary thyroid cancer |
| GO ID | Tissue | Disease Stage | Description | Gene Ratio | Bg Ratio | pvalue | p.adjust | Count |
| GO:001605015 | Skin | cSCC | vesicle organization | 135/4864 | 300/18723 | 5.98e-13 | 3.44e-11 | 135 |
| GO:0032388111 | Skin | cSCC | positive regulation of intracellular transport | 96/4864 | 202/18723 | 3.14e-11 | 1.52e-09 | 96 |
| GO:009031623 | Skin | cSCC | positive regulation of intracellular protein transport | 79/4864 | 160/18723 | 1.71e-10 | 7.52e-09 | 79 |
| GO:1904951112 | Skin | cSCC | positive regulation of establishment of protein localization | 134/4864 | 319/18723 | 2.60e-10 | 1.09e-08 | 134 |
| GO:000690025 | Skin | cSCC | vesicle budding from membrane | 39/4864 | 61/18723 | 5.02e-10 | 2.02e-08 | 39 |
| GO:004325429 | Skin | cSCC | regulation of protein-containing complex assembly | 167/4864 | 428/18723 | 1.60e-09 | 5.97e-08 | 167 |
| GO:0051222112 | Skin | cSCC | positive regulation of protein transport | 125/4864 | 303/18723 | 3.88e-09 | 1.32e-07 | 125 |
| GO:00069039 | Skin | cSCC | vesicle targeting | 28/4864 | 45/18723 | 3.26e-07 | 6.57e-06 | 28 |
| GO:005165018 | Skin | cSCC | establishment of vesicle localization | 70/4864 | 161/18723 | 1.02e-06 | 1.82e-05 | 70 |
| GO:00901147 | Skin | cSCC | COPII-coated vesicle budding | 20/4864 | 29/18723 | 1.50e-06 | 2.57e-05 | 20 |
| GO:005164816 | Skin | cSCC | vesicle localization | 73/4864 | 177/18723 | 6.36e-06 | 8.92e-05 | 73 |
| GO:00325278 | Skin | cSCC | protein exit from endoplasmic reticulum | 27/4864 | 48/18723 | 8.24e-06 | 1.10e-04 | 27 |
| GO:00482076 | Skin | cSCC | vesicle targeting, rough ER to cis-Golgi | 11/4864 | 13/18723 | 1.64e-05 | 1.99e-04 | 11 |
| GO:00482086 | Skin | cSCC | COPII vesicle coating | 11/4864 | 13/18723 | 1.64e-05 | 1.99e-04 | 11 |
| GO:00069018 | Skin | cSCC | vesicle coating | 13/4864 | 17/18723 | 1.92e-05 | 2.27e-04 | 13 |
| GO:00481997 | Skin | cSCC | vesicle targeting, to, from or within Golgi | 14/4864 | 21/18723 | 1.06e-04 | 9.81e-04 | 14 |
| GO:001988227 | Skin | cSCC | antigen processing and presentation | 42/4864 | 106/18723 | 1.42e-03 | 8.98e-03 | 42 |
| GO:00708616 | Skin | cSCC | regulation of protein exit from endoplasmic reticulum | 14/4864 | 27/18723 | 3.58e-03 | 1.93e-02 | 14 |
| GO:004800226 | Skin | cSCC | antigen processing and presentation of peptide antigen | 25/4864 | 62/18723 | 9.44e-03 | 4.25e-02 | 25 |
| GO:004819320 | Thyroid | PTC | Golgi vesicle transport | 186/5968 | 296/18723 | 3.09e-28 | 1.22e-25 | 186 |
| Pathway ID | Tissue | Disease Stage | Description | Gene Ratio | Bg Ratio | pvalue | p.adjust | qvalue | Count |
| hsa04141211 | Esophagus | ESCC | Protein processing in endoplasmic reticulum | 147/4205 | 174/8465 | 3.29e-22 | 1.10e-19 | 5.64e-20 | 147 |
| hsa0513428 | Esophagus | ESCC | Legionellosis | 42/4205 | 57/8465 | 1.83e-04 | 6.90e-04 | 3.53e-04 | 42 |
| hsa04141310 | Esophagus | ESCC | Protein processing in endoplasmic reticulum | 147/4205 | 174/8465 | 3.29e-22 | 1.10e-19 | 5.64e-20 | 147 |
| hsa0513436 | Esophagus | ESCC | Legionellosis | 42/4205 | 57/8465 | 1.83e-04 | 6.90e-04 | 3.53e-04 | 42 |
| hsa0414114 | Liver | Cirrhotic | Protein processing in endoplasmic reticulum | 114/2530 | 174/8465 | 1.16e-22 | 9.67e-21 | 5.96e-21 | 114 |
| hsa0513412 | Liver | Cirrhotic | Legionellosis | 28/2530 | 57/8465 | 1.71e-03 | 8.01e-03 | 4.94e-03 | 28 |
| hsa0414115 | Liver | Cirrhotic | Protein processing in endoplasmic reticulum | 114/2530 | 174/8465 | 1.16e-22 | 9.67e-21 | 5.96e-21 | 114 |
| hsa0513413 | Liver | Cirrhotic | Legionellosis | 28/2530 | 57/8465 | 1.71e-03 | 8.01e-03 | 4.94e-03 | 28 |
| hsa0414122 | Liver | HCC | Protein processing in endoplasmic reticulum | 146/4020 | 174/8465 | 7.34e-24 | 2.46e-21 | 1.37e-21 | 146 |
| hsa0414132 | Liver | HCC | Protein processing in endoplasmic reticulum | 146/4020 | 174/8465 | 7.34e-24 | 2.46e-21 | 1.37e-21 | 146 |
| hsa0414130 | Oral cavity | OSCC | Protein processing in endoplasmic reticulum | 143/3704 | 174/8465 | 6.82e-26 | 2.28e-23 | 1.16e-23 | 143 |
| hsa0513425 | Oral cavity | OSCC | Legionellosis | 42/3704 | 57/8465 | 4.18e-06 | 2.15e-05 | 1.10e-05 | 42 |
| hsa04141113 | Oral cavity | OSCC | Protein processing in endoplasmic reticulum | 143/3704 | 174/8465 | 6.82e-26 | 2.28e-23 | 1.16e-23 | 143 |
| hsa05134111 | Oral cavity | OSCC | Legionellosis | 42/3704 | 57/8465 | 4.18e-06 | 2.15e-05 | 1.10e-05 | 42 |
| hsa04141210 | Oral cavity | LP | Protein processing in endoplasmic reticulum | 113/2418 | 174/8465 | 8.74e-24 | 5.82e-22 | 3.76e-22 | 113 |
| hsa0513426 | Oral cavity | LP | Legionellosis | 33/2418 | 57/8465 | 3.29e-06 | 3.23e-05 | 2.08e-05 | 33 |
| hsa0414138 | Oral cavity | LP | Protein processing in endoplasmic reticulum | 113/2418 | 174/8465 | 8.74e-24 | 5.82e-22 | 3.76e-22 | 113 |
| hsa0513435 | Oral cavity | LP | Legionellosis | 33/2418 | 57/8465 | 3.29e-06 | 3.23e-05 | 2.08e-05 | 33 |
| hsa0414128 | Prostate | BPH | Protein processing in endoplasmic reticulum | 97/1718 | 174/8465 | 2.37e-25 | 1.30e-23 | 8.07e-24 | 97 |
| hsa0513420 | Prostate | BPH | Legionellosis | 22/1718 | 57/8465 | 1.10e-03 | 4.99e-03 | 3.09e-03 | 22 |
| Hugo Symbol | Variant Class | Variant Classification | dbSNP RS | HGVSc | HGVSp | HGVSp Short | SWISSPROT | BIOTYPE | SIFT | PolyPhen | Tumor Sample Barcode | Tissue | Histology | Sex | Age | Stage | Therapy Types | Drugs | Outcome |
| SAR1B | insertion | Frame_Shift_Ins | novel | c.486_487insC | p.Ile163HisfsTer17 | p.I163Hfs*17 | Q9Y6B6 | protein_coding | | | TCGA-BH-A0HF-01 | Breast | breast invasive carcinoma | Female | >=65 | I/II | Hormone Therapy | arimidex | SD |
| SAR1B | insertion | In_Frame_Ins | novel | c.485_486insGTCTCAACGTTCAGGCTTACTCAGAGATTTGATTGC | p.Ser162delinsArgSerGlnArgSerGlyLeuLeuArgAspLeuIleAla | p.S162delinsRSQRSGLLRDLIA | Q9Y6B6 | protein_coding | | | TCGA-BH-A0HF-01 | Breast | breast invasive carcinoma | Female | >=65 | I/II | Hormone Therapy | arimidex | SD |
| SAR1B | SNV | Missense_Mutation | | c.413N>A | p.Arg138Lys | p.R138K | Q9Y6B6 | protein_coding | tolerated(0.72) | benign(0) | TCGA-LP-A5U3-01 | Cervix | cervical & endocervical cancer | Female | <65 | I/II | Unknown | Unknown | SD |
| SAR1B | SNV | Missense_Mutation | novel | c.301N>A | p.Asp101Asn | p.D101N | Q9Y6B6 | protein_coding | deleterious(0) | probably_damaging(0.99) | TCGA-VS-A958-01 | Cervix | cervical & endocervical cancer | Female | <65 | I/II | Chemotherapy | cisplatin | CR |
| SAR1B | SNV | Missense_Mutation | novel | c.272C>A | p.Pro91His | p.P91H | Q9Y6B6 | protein_coding | deleterious(0.05) | benign(0.243) | TCGA-A5-A1OF-01 | Endometrium | uterine corpus endometrioid carcinoma | Female | <65 | I/II | Unknown | Unknown | SD |
| SAR1B | SNV | Missense_Mutation | | c.316G>A | p.Glu106Lys | p.E106K | Q9Y6B6 | protein_coding | tolerated(0.07) | benign(0.013) | TCGA-AP-A0LM-01 | Endometrium | uterine corpus endometrioid carcinoma | Female | <65 | III/IV | Chemotherapy | cisplatin | SD |
| SAR1B | SNV | Missense_Mutation | novel | c.523N>T | p.Val175Phe | p.V175F | Q9Y6B6 | protein_coding | deleterious(0) | possibly_damaging(0.908) | TCGA-AP-A1DV-01 | Endometrium | uterine corpus endometrioid carcinoma | Female | <65 | I/II | Unknown | Unknown | SD |
| SAR1B | SNV | Missense_Mutation | rs376731426 | c.209N>T | p.Thr70Met | p.T70M | Q9Y6B6 | protein_coding | deleterious(0.04) | benign(0.302) | TCGA-AX-A06F-01 | Endometrium | uterine corpus endometrioid carcinoma | Female | <65 | III/IV | Chemotherapy | carboplatin | SD |
| SAR1B | SNV | Missense_Mutation | novel | c.264N>A | p.Asn88Lys | p.N88K | Q9Y6B6 | protein_coding | deleterious(0.03) | benign(0.057) | TCGA-AX-A1CE-01 | Endometrium | uterine corpus endometrioid carcinoma | Female | <65 | I/II | Unspecific | Paclitaxel | SD |
| SAR1B | SNV | Missense_Mutation | | c.226N>A | p.Leu76Met | p.L76M | Q9Y6B6 | protein_coding | deleterious(0.03) | probably_damaging(0.996) | TCGA-B5-A11G-01 | Endometrium | uterine corpus endometrioid carcinoma | Female | >=65 | I/II | Unknown | Unknown | SD |


