
|
|||||
|
 | |
| |
| |
| |
| |
| |
|
Gene: RGS2 |
Gene summary for RGS2 |
| Gene information | Species | Human | Gene symbol | RGS2 | Gene ID | 5997 |
| Gene name | regulator of G protein signaling 2 | |
| Gene Alias | G0S8 | |
| Cytomap | 1q31.2 | |
| Gene Type | protein-coding | GO ID | GO:0000003 | UniProtAcc | A0A024R939 |
Top |
Malignant transformation analysis |
| Identification of the aberrant gene expression in precancerous and cancerous lesions by comparing the gene expression of stem-like cells in diseased tissues with normal stem cells |
| Entrez ID | Symbol | Replicates | Species | Organ | Tissue | Adj P-value | Log2FC | Malignancy |
| 5997 | RGS2 | CA_HPV_1 | Human | Cervix | CC | 1.47e-09 | 5.63e-01 | 0.0264 |
| 5997 | RGS2 | HSIL_HPV_2 | Human | Cervix | HSIL_HPV | 5.45e-07 | -4.49e-01 | 0.0208 |
| 5997 | RGS2 | CCI_1 | Human | Cervix | CC | 9.73e-04 | -7.04e-01 | 0.528 |
| 5997 | RGS2 | CCI_2 | Human | Cervix | CC | 1.72e-04 | -7.43e-01 | 0.5249 |
| 5997 | RGS2 | CCI_3 | Human | Cervix | CC | 2.81e-07 | -7.33e-01 | 0.516 |
| 5997 | RGS2 | CCII_1 | Human | Cervix | CC | 4.27e-14 | -7.65e-01 | 0.3249 |
| 5997 | RGS2 | Tumor | Human | Cervix | CC | 4.47e-16 | -5.82e-01 | 0.1241 |
| 5997 | RGS2 | sample3 | Human | Cervix | CC | 1.87e-16 | -5.59e-01 | 0.1387 |
| 5997 | RGS2 | H2 | Human | Cervix | HSIL_HPV | 5.20e-22 | -6.61e-01 | 0.0632 |
| 5997 | RGS2 | L1 | Human | Cervix | CC | 1.59e-06 | -6.07e-01 | 0.0802 |
| 5997 | RGS2 | T3 | Human | Cervix | CC | 1.06e-16 | -6.00e-01 | 0.1389 |
| 5997 | RGS2 | LZE7T | Human | Esophagus | ESCC | 3.52e-07 | 3.32e-02 | 0.0667 |
| 5997 | RGS2 | LZE8T | Human | Esophagus | ESCC | 1.54e-02 | -2.46e-01 | 0.067 |
| 5997 | RGS2 | LZE21D1 | Human | Esophagus | HGIN | 6.03e-05 | -1.85e-01 | 0.0632 |
| 5997 | RGS2 | LZE24T | Human | Esophagus | ESCC | 2.05e-03 | -8.31e-02 | 0.0596 |
| 5997 | RGS2 | LZE21T | Human | Esophagus | ESCC | 3.37e-02 | -1.36e-01 | 0.0655 |
| 5997 | RGS2 | P2T-E | Human | Esophagus | ESCC | 1.33e-11 | -2.61e-01 | 0.1177 |
| 5997 | RGS2 | P4T-E | Human | Esophagus | ESCC | 5.10e-14 | 8.06e-01 | 0.1323 |
| 5997 | RGS2 | P5T-E | Human | Esophagus | ESCC | 1.59e-36 | 1.15e+00 | 0.1327 |
| 5997 | RGS2 | P8T-E | Human | Esophagus | ESCC | 4.92e-08 | -1.02e-01 | 0.0889 |
| Page: 1 2 3 4 5 6 |
| Tissue | Expression Dynamics | Abbreviation |
| Cervix | 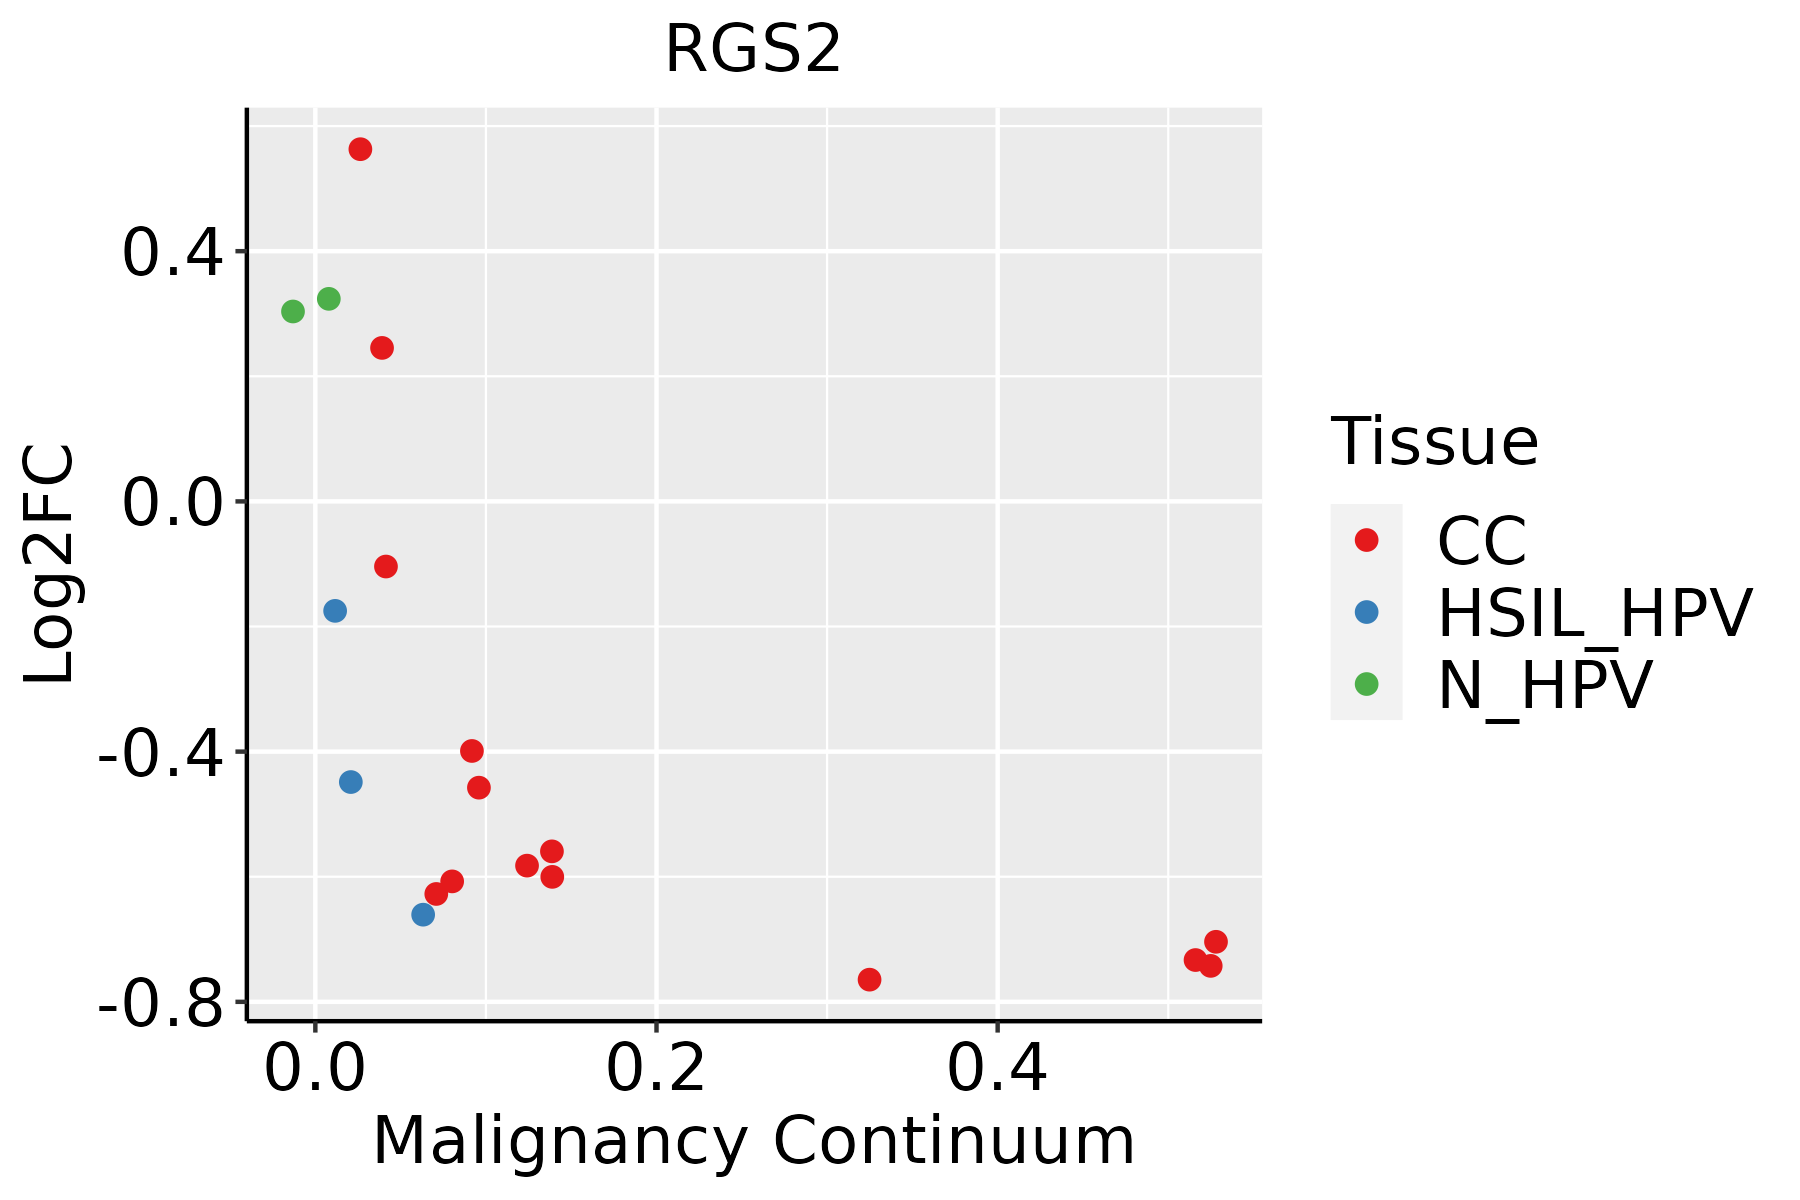 | CC: Cervix cancer |
| HSIL_HPV: HPV-infected high-grade squamous intraepithelial lesions | ||
| N_HPV: HPV-infected normal cervix | ||
| Esophagus |  | ESCC: Esophageal squamous cell carcinoma |
| HGIN: High-grade intraepithelial neoplasias | ||
| LGIN: Low-grade intraepithelial neoplasias | ||
| Liver | 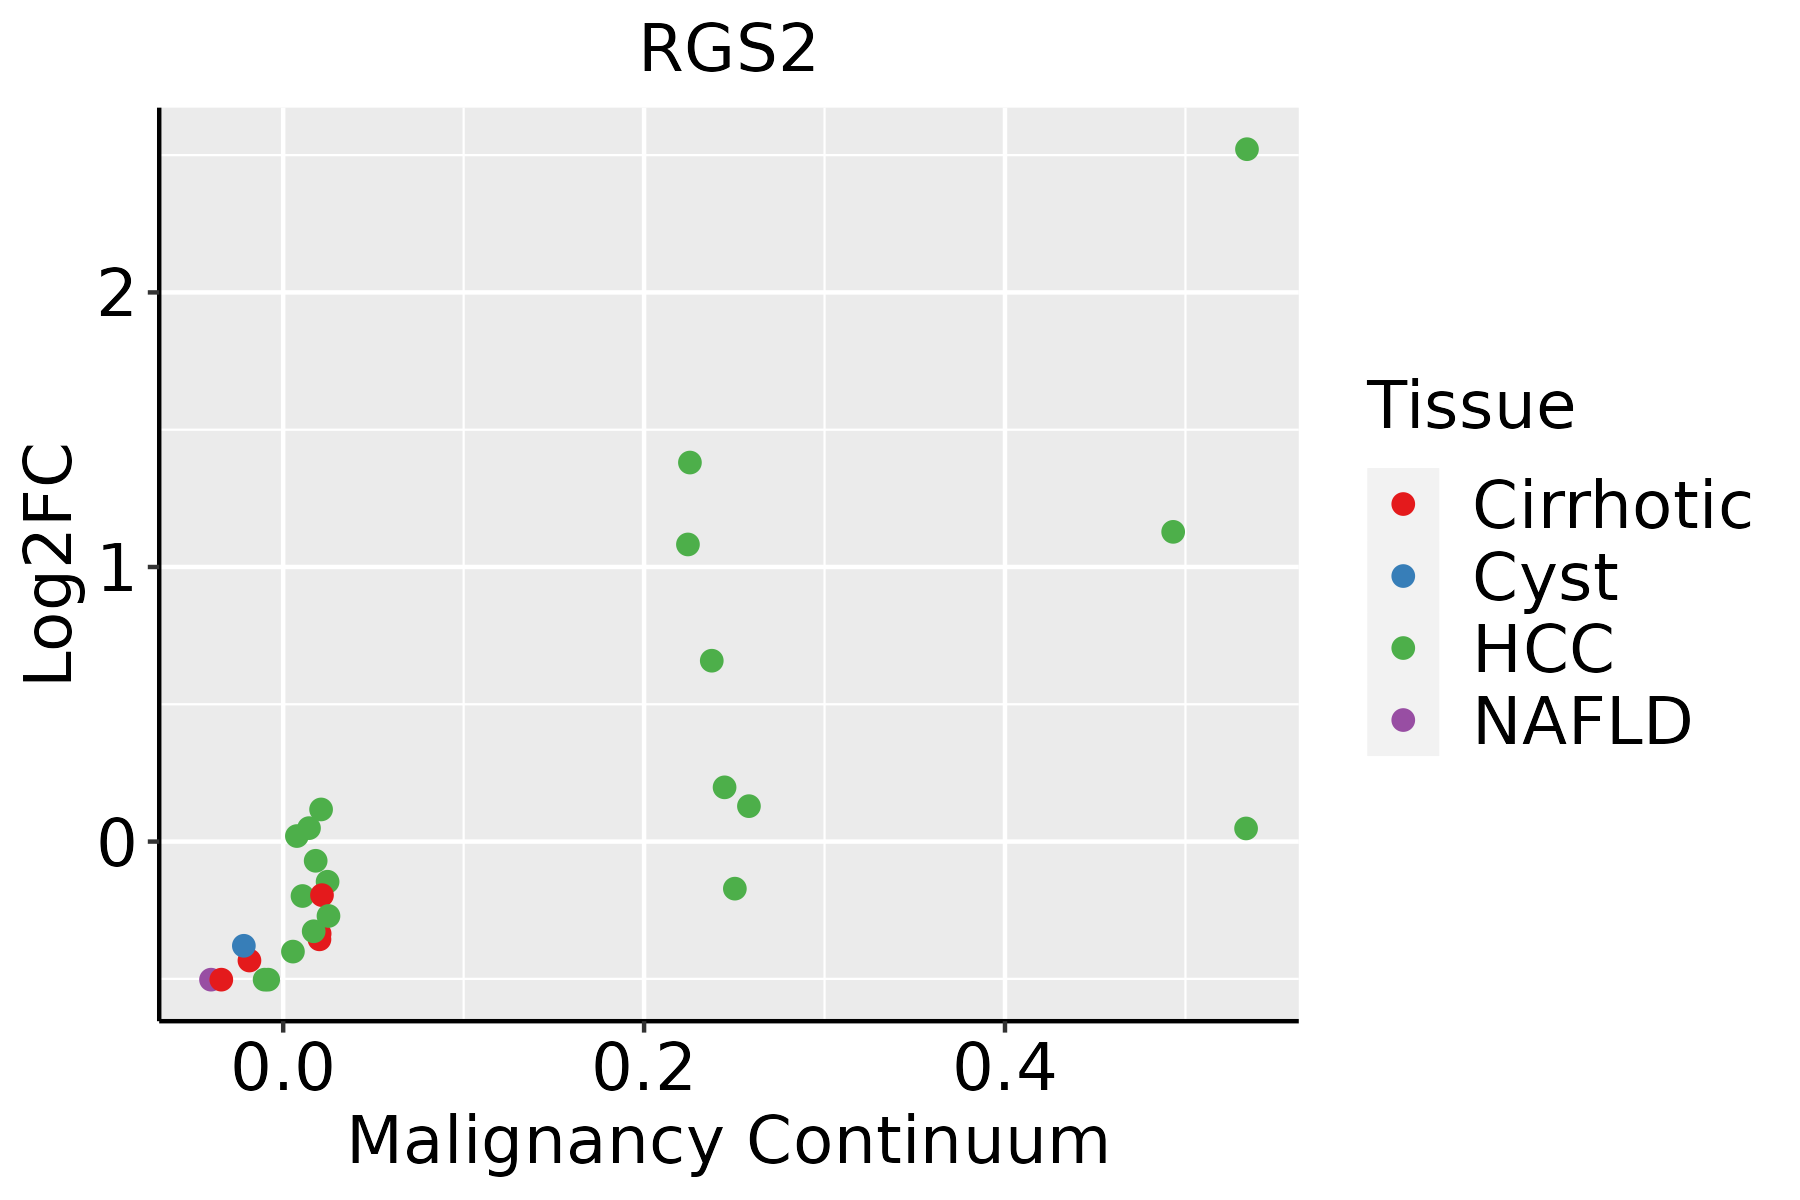 | HCC: Hepatocellular carcinoma |
| NAFLD: Non-alcoholic fatty liver disease | ||
| Oral Cavity | 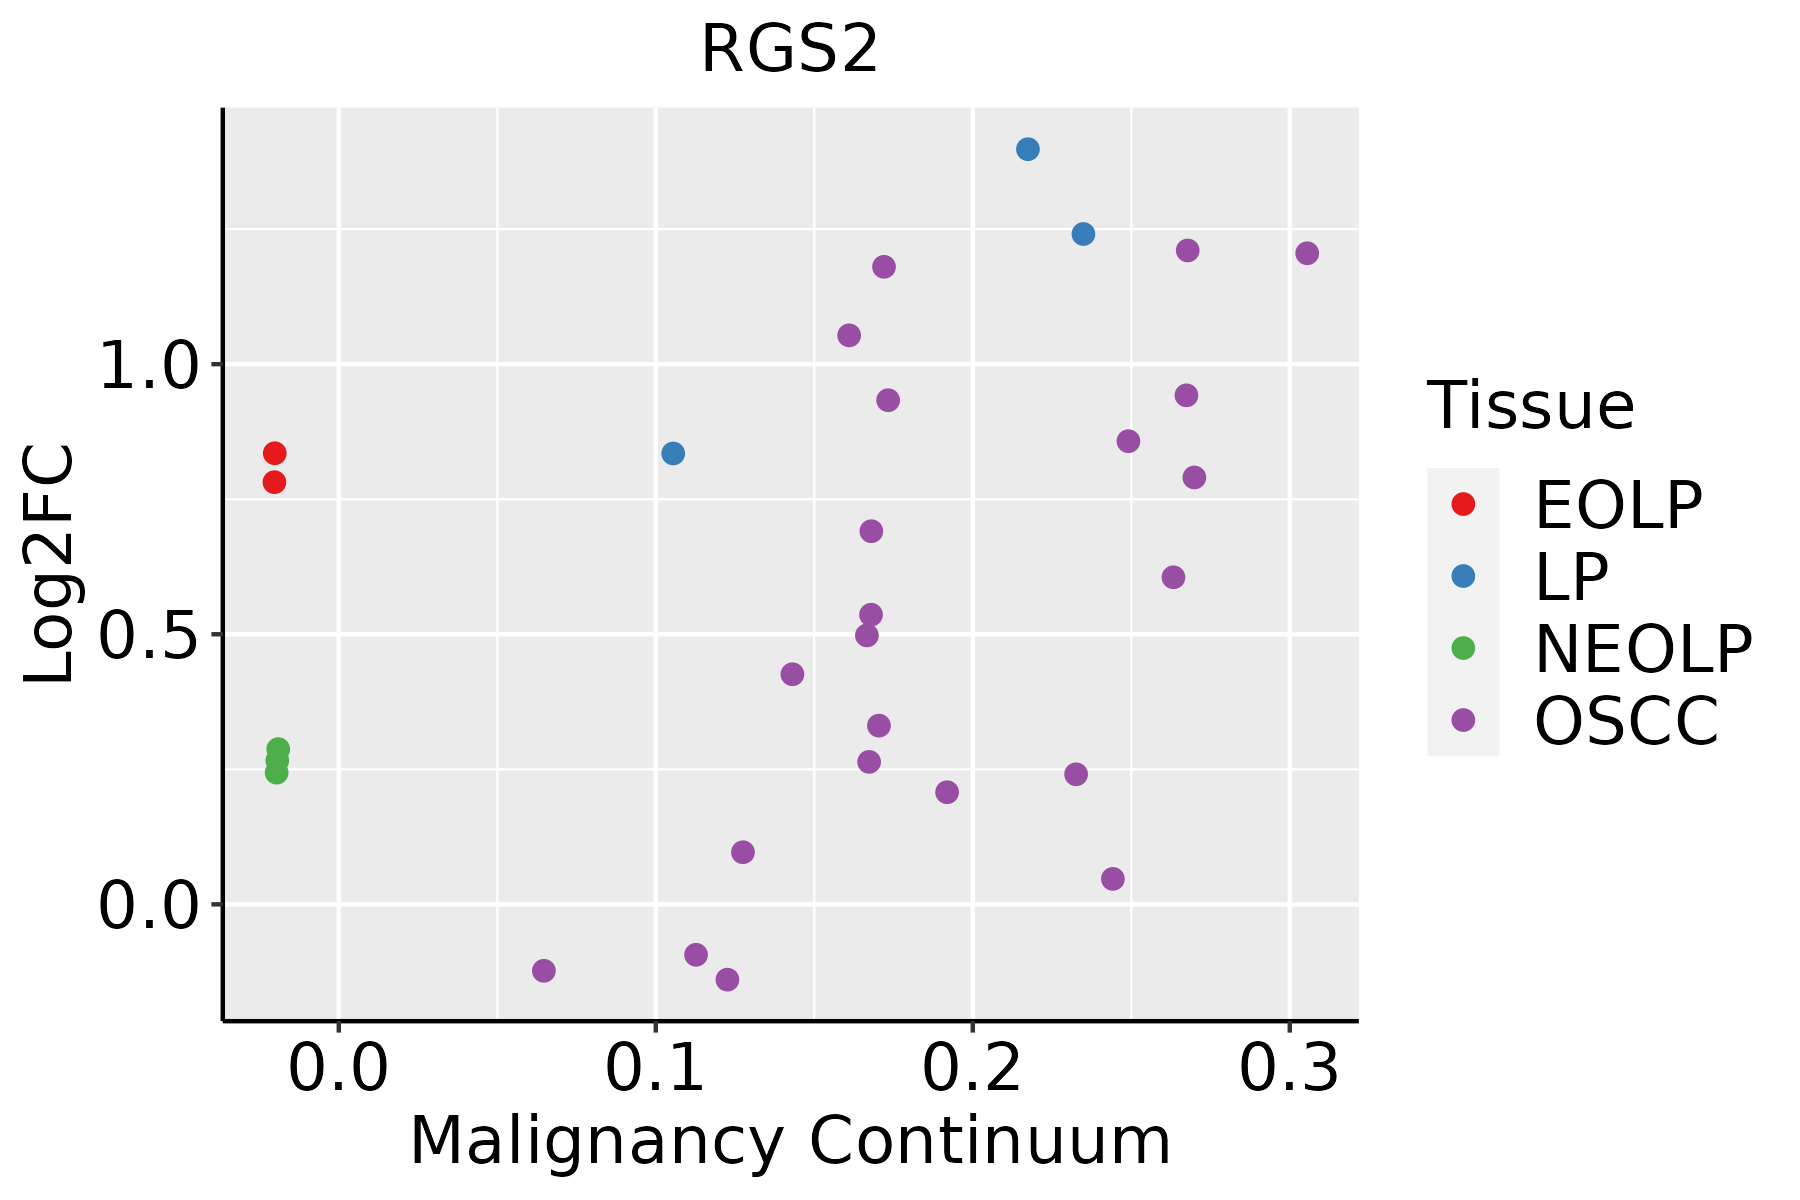 | EOLP: Erosive Oral lichen planus |
| LP: leukoplakia | ||
| NEOLP: Non-erosive oral lichen planus | ||
| OSCC: Oral squamous cell carcinoma | ||
| Prostate | 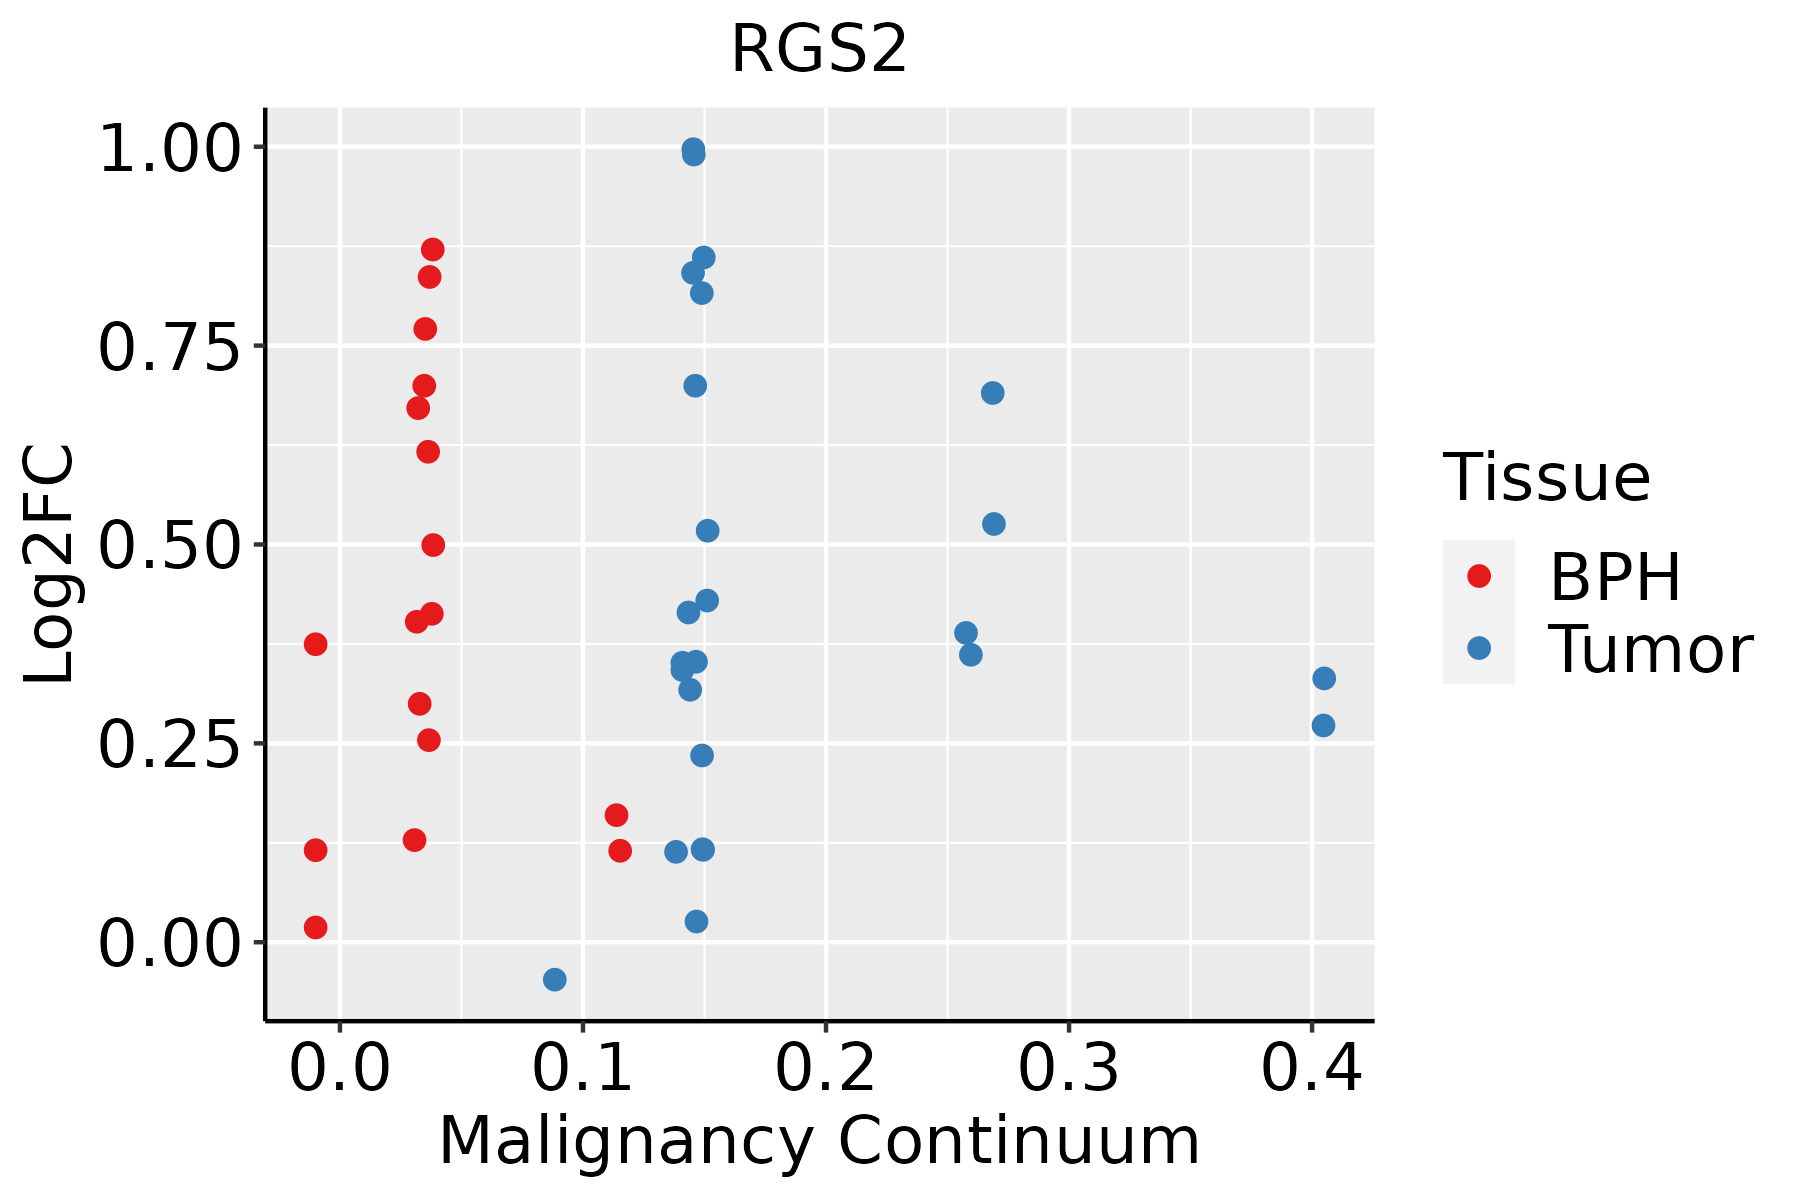 | BPH: Benign Prostatic Hyperplasia |
| Skin | 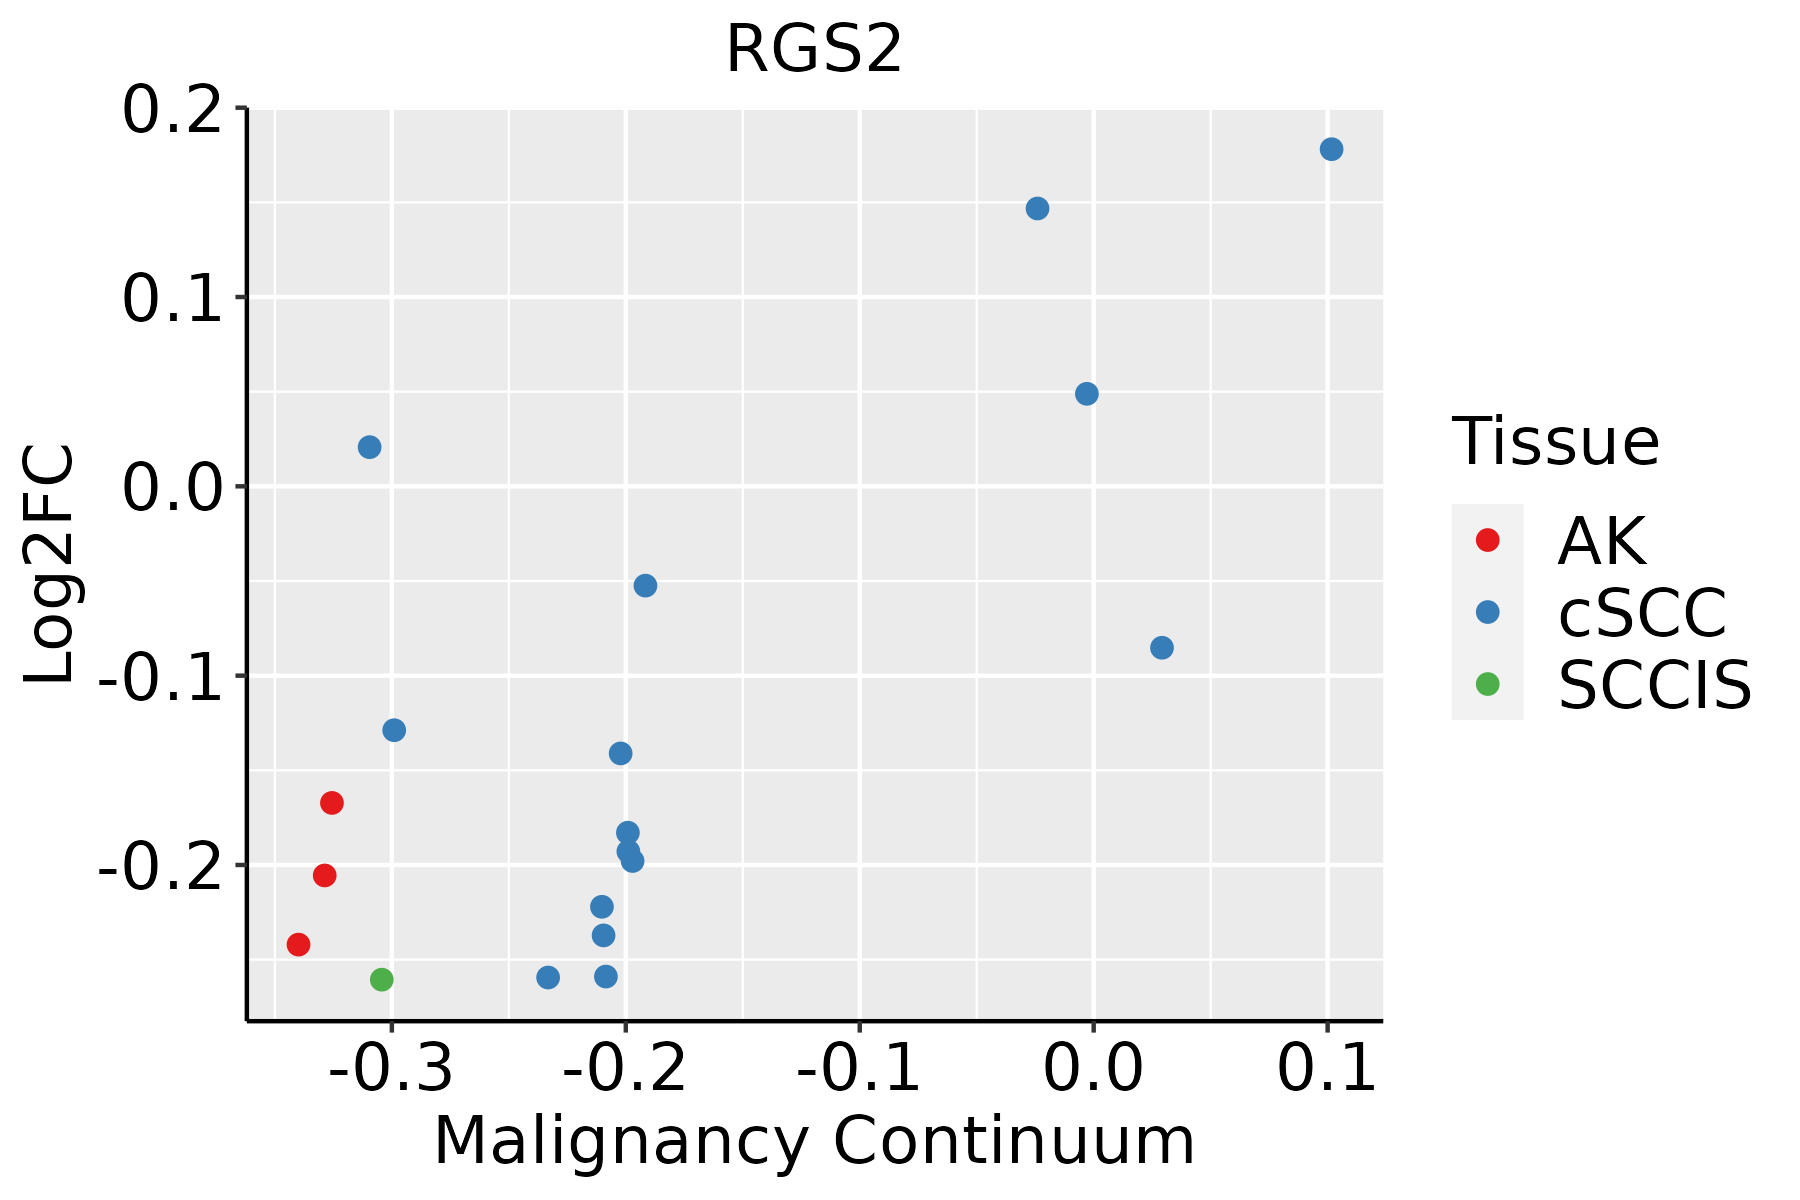 | AK: Actinic keratosis |
| cSCC: Cutaneous squamous cell carcinoma | ||
| SCCIS:squamous cell carcinoma in situ | ||
| Thyroid | 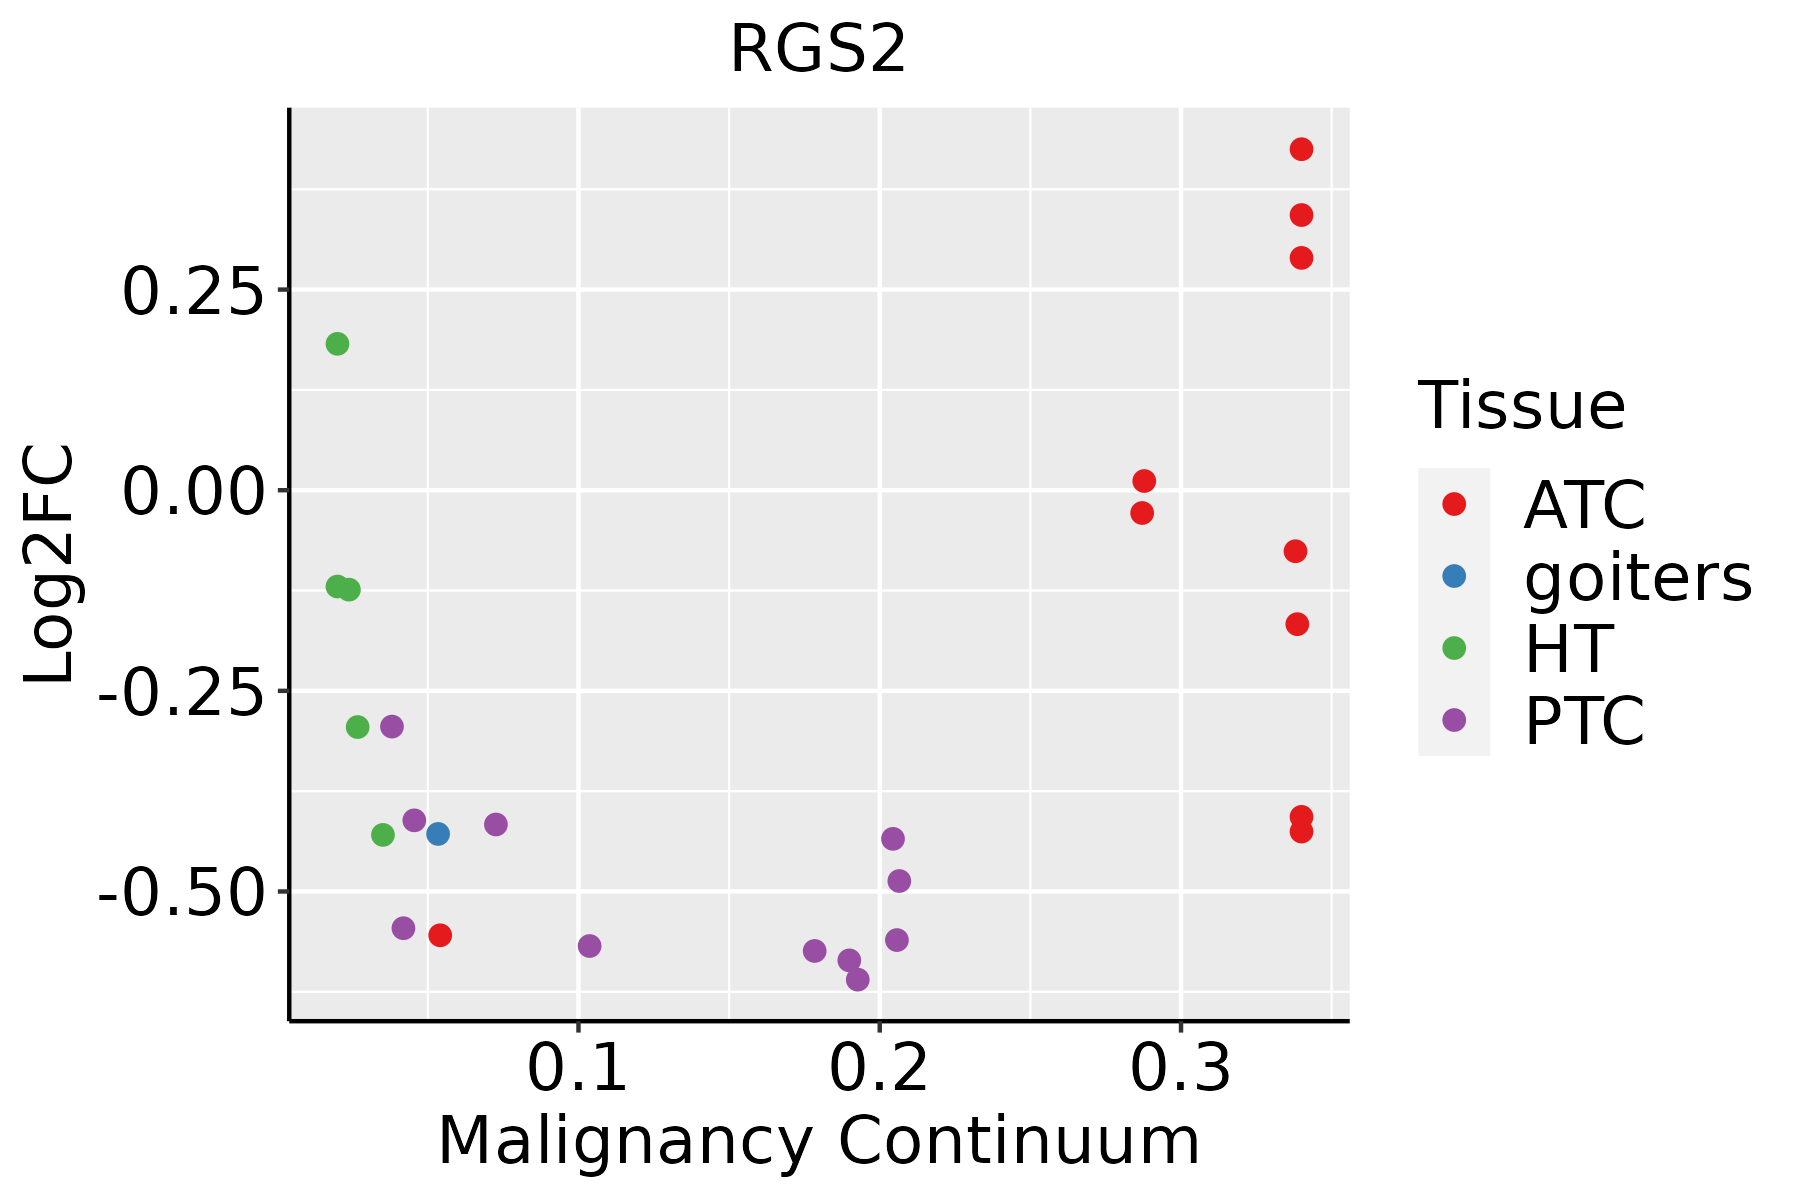 | ATC: Anaplastic thyroid cancer |
| HT: Hashimoto's thyroiditis | ||
| PTC: Papillary thyroid cancer |
| ∗log2FC in expression of this searched gene in stem-like cells from each diseased tissue sample relative to stem-like cells in normal samples in each tissue plotted against the malignancy continuum. Samples are colored based on if they are from different disease stage. |
Top |
Malignant transformation related pathway analysis |
| Find out the enriched GO biological processes and KEGG pathways involved in transition from healthy to precancer to cancer |
| Tissue | Disease Stage | Enriched GO biological Processes |
| Colorectum | AD |  |
| Colorectum | SER |  |
| Colorectum | MSS |  |
| Colorectum | MSI-H |  |
| Colorectum | FAP |  |
| ∗Top 15 enriched GO BP terms are showed in the bar plot of each disease state in each tissue. Each row represents a significant GO biological process which is colored according to the -log10(p.adjust). |
| Page: 1 2 3 4 5 6 7 8 9 |
| GO ID | Tissue | Disease Stage | Description | Gene Ratio | Bg Ratio | pvalue | p.adjust | Count |
| GO:003134615 | Oral cavity | LP | positive regulation of cell projection organization | 109/4623 | 353/18723 | 4.59e-03 | 2.93e-02 | 109 |
| GO:006013515 | Oral cavity | LP | maternal process involved in female pregnancy | 25/4623 | 62/18723 | 4.74e-03 | 3.00e-02 | 25 |
| GO:001097612 | Oral cavity | LP | positive regulation of neuron projection development | 55/4623 | 163/18723 | 5.74e-03 | 3.44e-02 | 55 |
| GO:0097305110 | Oral cavity | LP | response to alcohol | 80/4623 | 253/18723 | 7.24e-03 | 4.05e-02 | 80 |
| GO:007190111 | Oral cavity | LP | negative regulation of protein serine/threonine kinase activity | 42/4623 | 120/18723 | 7.27e-03 | 4.06e-02 | 42 |
| GO:000756515 | Oral cavity | LP | female pregnancy | 63/4623 | 193/18723 | 7.56e-03 | 4.17e-02 | 63 |
| GO:005134826 | Oral cavity | EOLP | negative regulation of transferase activity | 75/2218 | 268/18723 | 4.48e-13 | 1.22e-10 | 75 |
| GO:004593625 | Oral cavity | EOLP | negative regulation of phosphate metabolic process | 105/2218 | 441/18723 | 1.05e-12 | 2.46e-10 | 105 |
| GO:001056325 | Oral cavity | EOLP | negative regulation of phosphorus metabolic process | 105/2218 | 442/18723 | 1.22e-12 | 2.60e-10 | 105 |
| GO:004232624 | Oral cavity | EOLP | negative regulation of phosphorylation | 94/2218 | 385/18723 | 3.58e-12 | 7.15e-10 | 94 |
| GO:000641726 | Oral cavity | EOLP | regulation of translation | 108/2218 | 468/18723 | 4.04e-12 | 7.34e-10 | 108 |
| GO:000193324 | Oral cavity | EOLP | negative regulation of protein phosphorylation | 82/2218 | 342/18723 | 2.24e-10 | 2.20e-08 | 82 |
| GO:003367323 | Oral cavity | EOLP | negative regulation of kinase activity | 62/2218 | 237/18723 | 9.46e-10 | 6.75e-08 | 62 |
| GO:000646922 | Oral cavity | EOLP | negative regulation of protein kinase activity | 56/2218 | 212/18723 | 4.15e-09 | 2.41e-07 | 56 |
| GO:001604924 | Oral cavity | EOLP | cell growth | 97/2218 | 482/18723 | 9.06e-08 | 3.15e-06 | 97 |
| GO:007190023 | Oral cavity | EOLP | regulation of protein serine/threonine kinase activity | 75/2218 | 359/18723 | 5.81e-07 | 1.53e-05 | 75 |
| GO:003134621 | Oral cavity | EOLP | positive regulation of cell projection organization | 74/2218 | 353/18723 | 6.00e-07 | 1.56e-05 | 74 |
| GO:004269214 | Oral cavity | EOLP | muscle cell differentiation | 77/2218 | 384/18723 | 2.18e-06 | 4.91e-05 | 77 |
| GO:001097515 | Oral cavity | EOLP | regulation of neuron projection development | 86/2218 | 445/18723 | 2.75e-06 | 6.05e-05 | 86 |
| GO:001714813 | Oral cavity | EOLP | negative regulation of translation | 54/2218 | 245/18723 | 4.15e-06 | 8.72e-05 | 54 |
| Page: 1 2 3 4 5 6 7 8 9 10 11 12 13 14 15 16 17 18 19 20 21 22 23 |
| Pathway ID | Tissue | Disease Stage | Description | Gene Ratio | Bg Ratio | pvalue | p.adjust | qvalue | Count |
| hsa049218 | Cervix | CC | Oxytocin signaling pathway | 34/1267 | 154/8465 | 1.12e-02 | 3.42e-02 | 2.02e-02 | 34 |
| hsa0492111 | Cervix | CC | Oxytocin signaling pathway | 34/1267 | 154/8465 | 1.12e-02 | 3.42e-02 | 2.02e-02 | 34 |
| hsa049219 | Oral cavity | EOLP | Oxytocin signaling pathway | 36/1218 | 154/8465 | 1.79e-03 | 6.08e-03 | 3.58e-03 | 36 |
| hsa040224 | Oral cavity | EOLP | cGMP-PKG signaling pathway | 36/1218 | 167/8465 | 7.34e-03 | 2.12e-02 | 1.25e-02 | 36 |
| hsa0492112 | Oral cavity | EOLP | Oxytocin signaling pathway | 36/1218 | 154/8465 | 1.79e-03 | 6.08e-03 | 3.58e-03 | 36 |
| hsa0402211 | Oral cavity | EOLP | cGMP-PKG signaling pathway | 36/1218 | 167/8465 | 7.34e-03 | 2.12e-02 | 1.25e-02 | 36 |
| Page: 1 |
Top |
Cell-cell communication analysis |
| Identification of potential cell-cell interactions between two cell types and their ligand-receptor pairs for different disease states |
| Ligand | Receptor | LRpair | Pathway | Tissue | Disease Stage |
| Page: 1 |
Top |
Single-cell gene regulatory network inference analysis |
| Find out the significant the regulons (TFs) and the target genes of each regulon across cell types for different disease states |
| TF | Cell Type | Tissue | Disease Stage | Target Gene | RSS | Regulon Activity |
| ∗The dot plots of a searched regulon are shown for all cell subpopulations in each disease state of each tissue based on the regulon specific score inferred using pySCENIC and by calculating the average expression. |
| Page: 1 |
Top |
Somatic mutation of malignant transformation related genes |
| Annotation of somatic variants for genes involved in malignant transformation |
| Hugo Symbol | Variant Class | Variant Classification | dbSNP RS | HGVSc | HGVSp | HGVSp Short | SWISSPROT | BIOTYPE | SIFT | PolyPhen | Tumor Sample Barcode | Tissue | Histology | Sex | Age | Stage | Therapy Types | Drugs | Outcome |
| RGS2 | SNV | Missense_Mutation | rs759895235 | c.518C>T | p.Ala173Val | p.A173V | P41220 | protein_coding | deleterious(0) | probably_damaging(1) | TCGA-2W-A8YY-01 | Cervix | cervical & endocervical cancer | Female | <65 | I/II | Chemotherapy | cisplatin | CR |
| RGS2 | SNV | Missense_Mutation | c.93A>C | p.Glu31Asp | p.E31D | P41220 | protein_coding | tolerated(0.45) | benign(0.099) | TCGA-FU-A3HZ-01 | Cervix | cervical & endocervical cancer | Female | <65 | I/II | Chemotherapy | cisplatin | CR | |
| RGS2 | SNV | Missense_Mutation | c.349G>A | p.Glu117Lys | p.E117K | P41220 | protein_coding | deleterious(0.01) | probably_damaging(0.999) | TCGA-VS-A958-01 | Cervix | cervical & endocervical cancer | Female | <65 | I/II | Chemotherapy | cisplatin | CR | |
| RGS2 | SNV | Missense_Mutation | c.300N>G | p.Phe100Leu | p.F100L | P41220 | protein_coding | deleterious(0) | probably_damaging(0.98) | TCGA-A6-6141-01 | Colorectum | colon adenocarcinoma | Male | <65 | I/II | Chemotherapy | 5-fu | SD | |
| RGS2 | SNV | Missense_Mutation | c.595T>A | p.Cys199Ser | p.C199S | P41220 | protein_coding | deleterious(0) | possibly_damaging(0.447) | TCGA-AD-6964-01 | Colorectum | colon adenocarcinoma | Male | <65 | III/IV | Chemotherapy | folfox | PD | |
| RGS2 | SNV | Missense_Mutation | rs149228054 | c.315C>A | p.Phe105Leu | p.F105L | P41220 | protein_coding | deleterious(0) | probably_damaging(0.927) | TCGA-AG-3892-01 | Colorectum | rectum adenocarcinoma | Female | <65 | I/II | Unknown | Unknown | SD |
| RGS2 | SNV | Missense_Mutation | novel | c.247G>T | p.Ala83Ser | p.A83S | P41220 | protein_coding | tolerated(1) | benign(0.013) | TCGA-F5-6814-01 | Colorectum | rectum adenocarcinoma | Male | <65 | I/II | Unknown | Unknown | SD |
| RGS2 | insertion | Frame_Shift_Ins | rs775439827 | c.183_184insA | p.Ser64LysfsTer12 | p.S64Kfs*12 | P41220 | protein_coding | TCGA-G4-6320-01 | Colorectum | colon adenocarcinoma | Male | >=65 | III/IV | Chemotherapy | oxaliplatin | SD | ||
| RGS2 | SNV | Missense_Mutation | novel | c.445N>G | p.Asn149Asp | p.N149D | P41220 | protein_coding | deleterious(0) | probably_damaging(0.998) | TCGA-AP-A059-01 | Endometrium | uterine corpus endometrioid carcinoma | Female | >=65 | I/II | Unknown | Unknown | SD |
| RGS2 | SNV | Missense_Mutation | rs149228054 | c.315N>A | p.Phe105Leu | p.F105L | P41220 | protein_coding | deleterious(0) | probably_damaging(0.927) | TCGA-AP-A0LM-01 | Endometrium | uterine corpus endometrioid carcinoma | Female | <65 | III/IV | Chemotherapy | cisplatin | SD |
| Page: 1 2 3 |
Top |
Related drugs of malignant transformation related genes |
| Identification of chemicals and drugs interact with genes involved in malignant transfromation |
| (DGIdb 4.0) |
| Entrez ID | Symbol | Category | Interaction Types | Drug Claim Name | Drug Name | PMIDs |
| 5997 | RGS2 | NA | haloperidol | HALOPERIDOL | 27023437 | |
| 5997 | RGS2 | NA | antipsychotics | 18347610 |
| Page: 1 |

Copyright 2023-Present -The University of Texas Health Science Center at Houston |