| Tissue | Expression Dynamics | Abbreviation |
| Cervix | 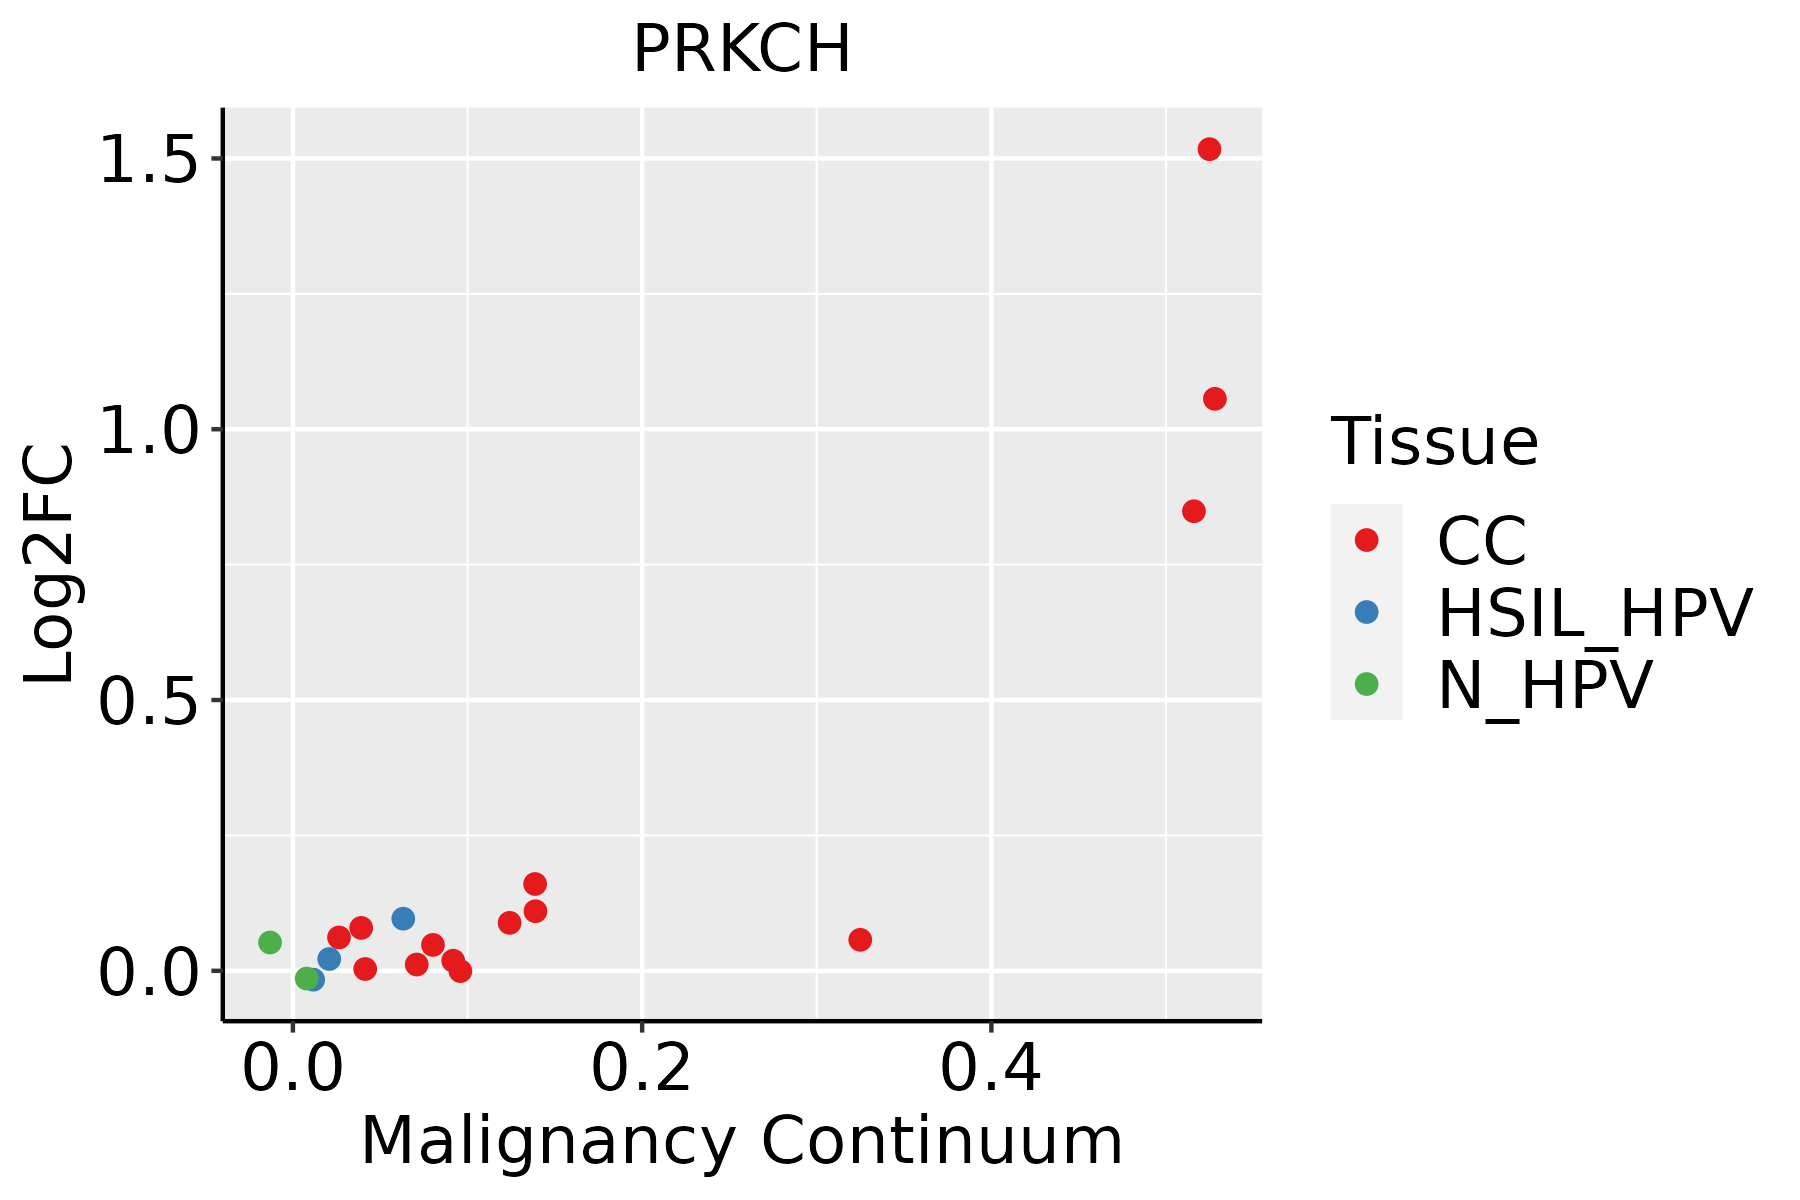 | CC: Cervix cancer |
| HSIL_HPV: HPV-infected high-grade squamous intraepithelial lesions |
| N_HPV: HPV-infected normal cervix |
| Endometrium |  | AEH: Atypical endometrial hyperplasia |
| EEC: Endometrioid Cancer |
| Esophagus | 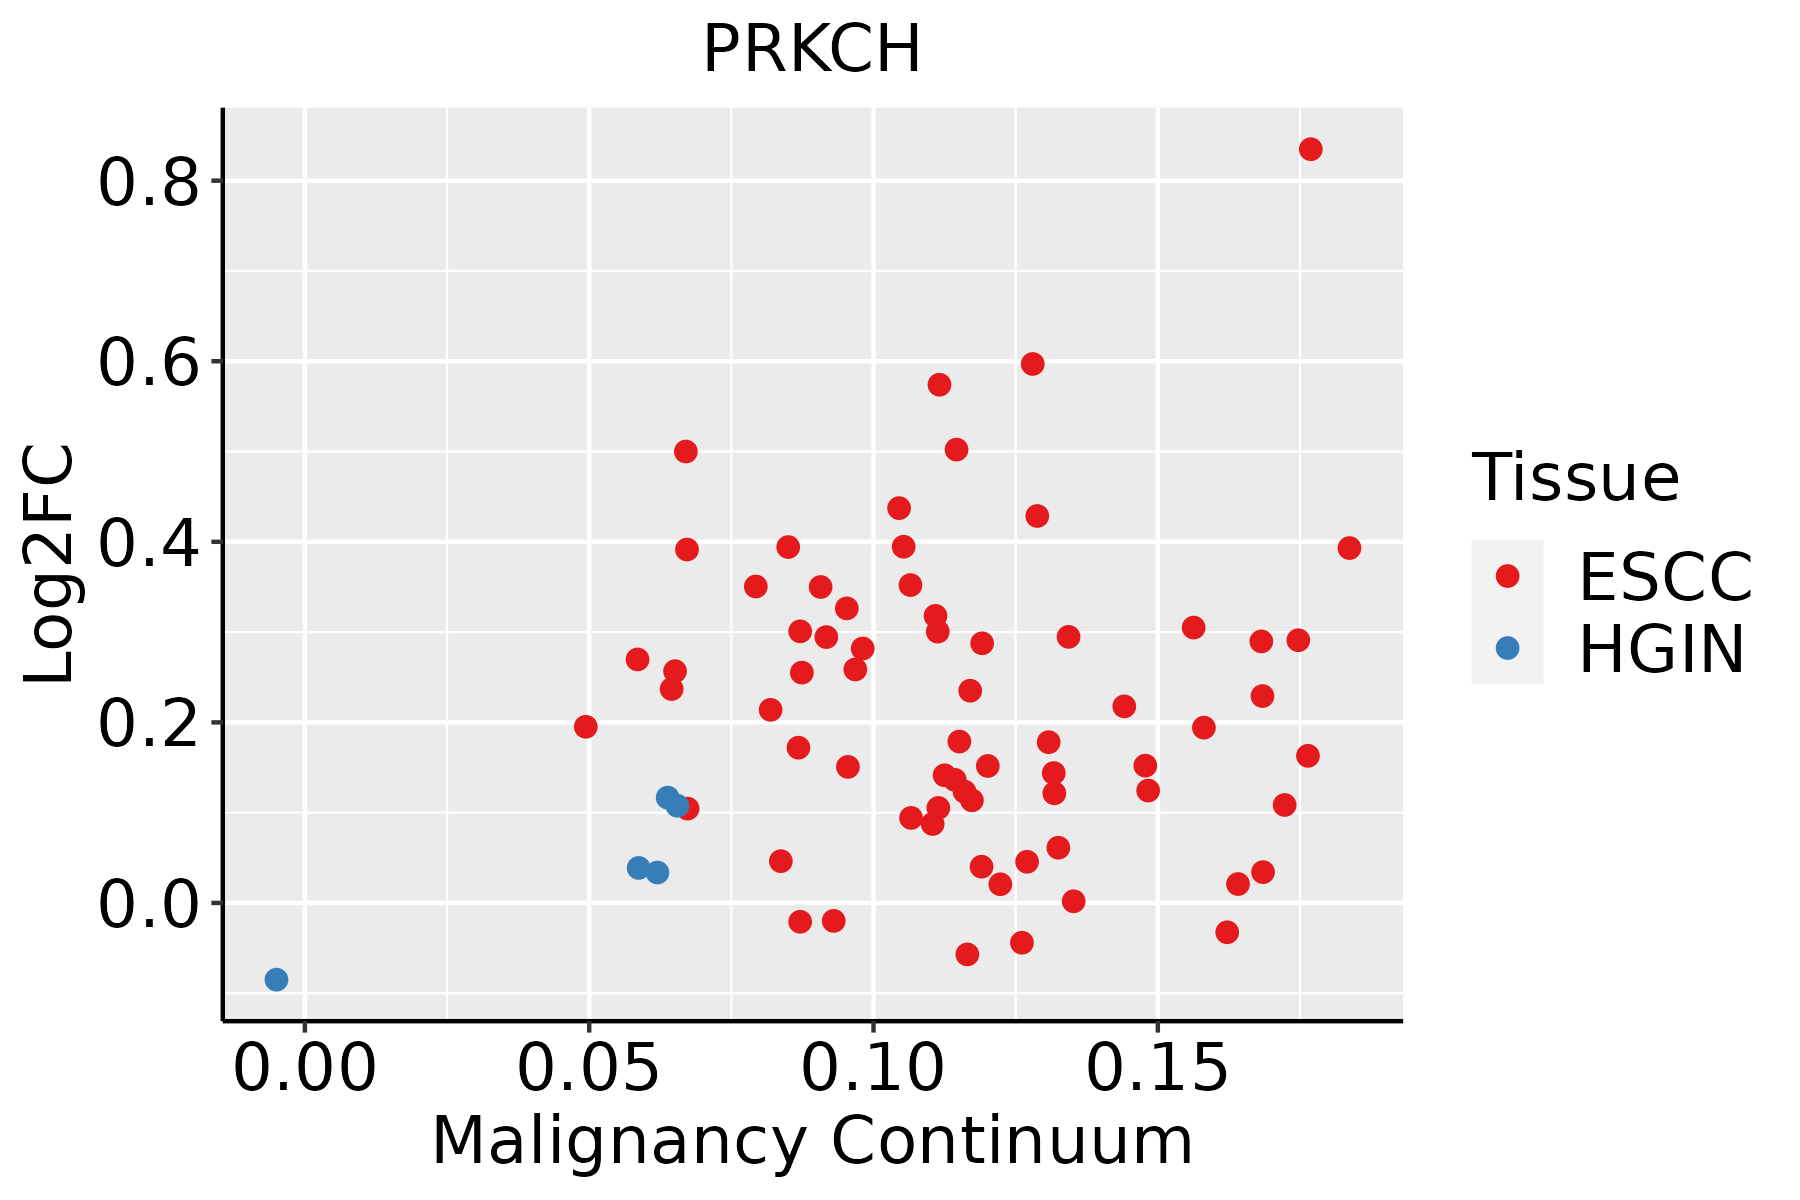 | ESCC: Esophageal squamous cell carcinoma |
| HGIN: High-grade intraepithelial neoplasias |
| LGIN: Low-grade intraepithelial neoplasias |
| Lung | 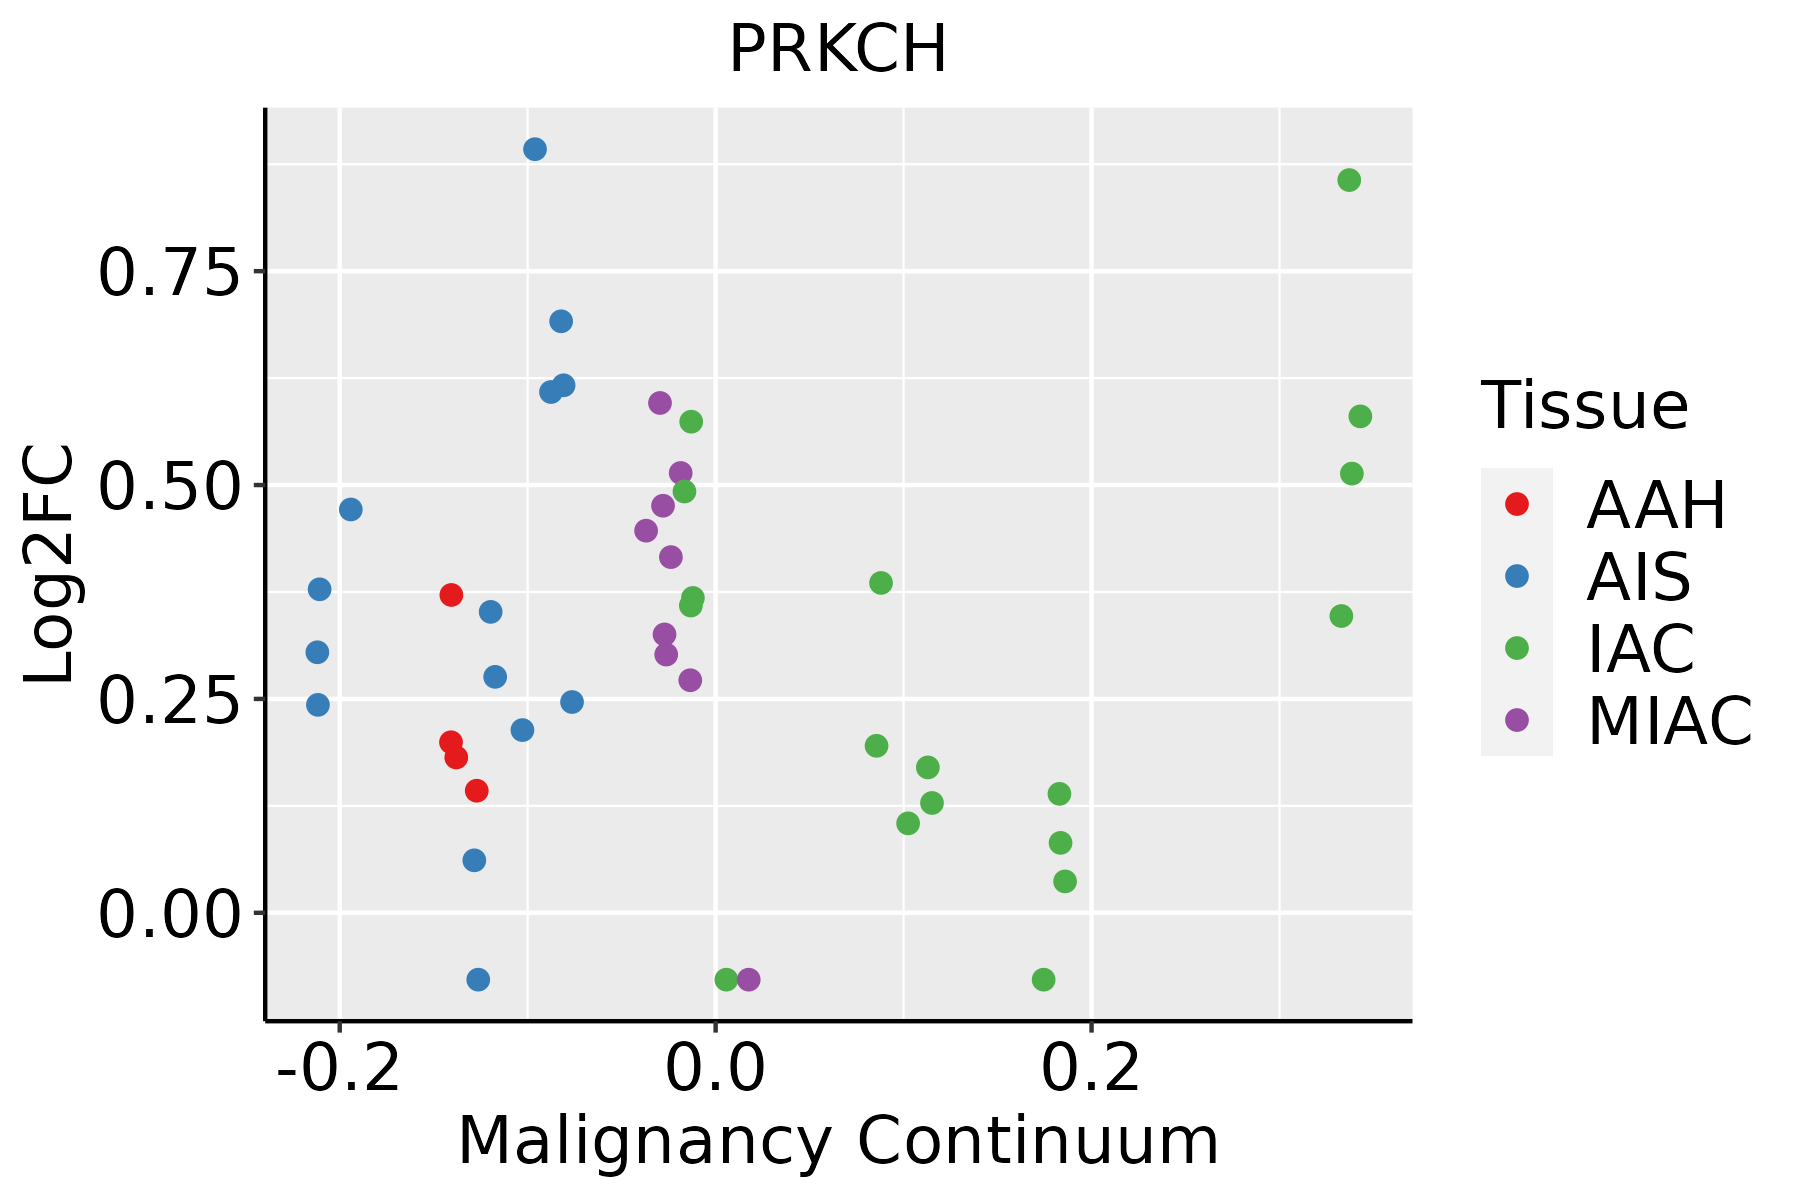 | AAH: Atypical adenomatous hyperplasia |
| AIS: Adenocarcinoma in situ |
| IAC: Invasive lung adenocarcinoma |
| MIA: Minimally invasive adenocarcinoma |
| Oral Cavity | 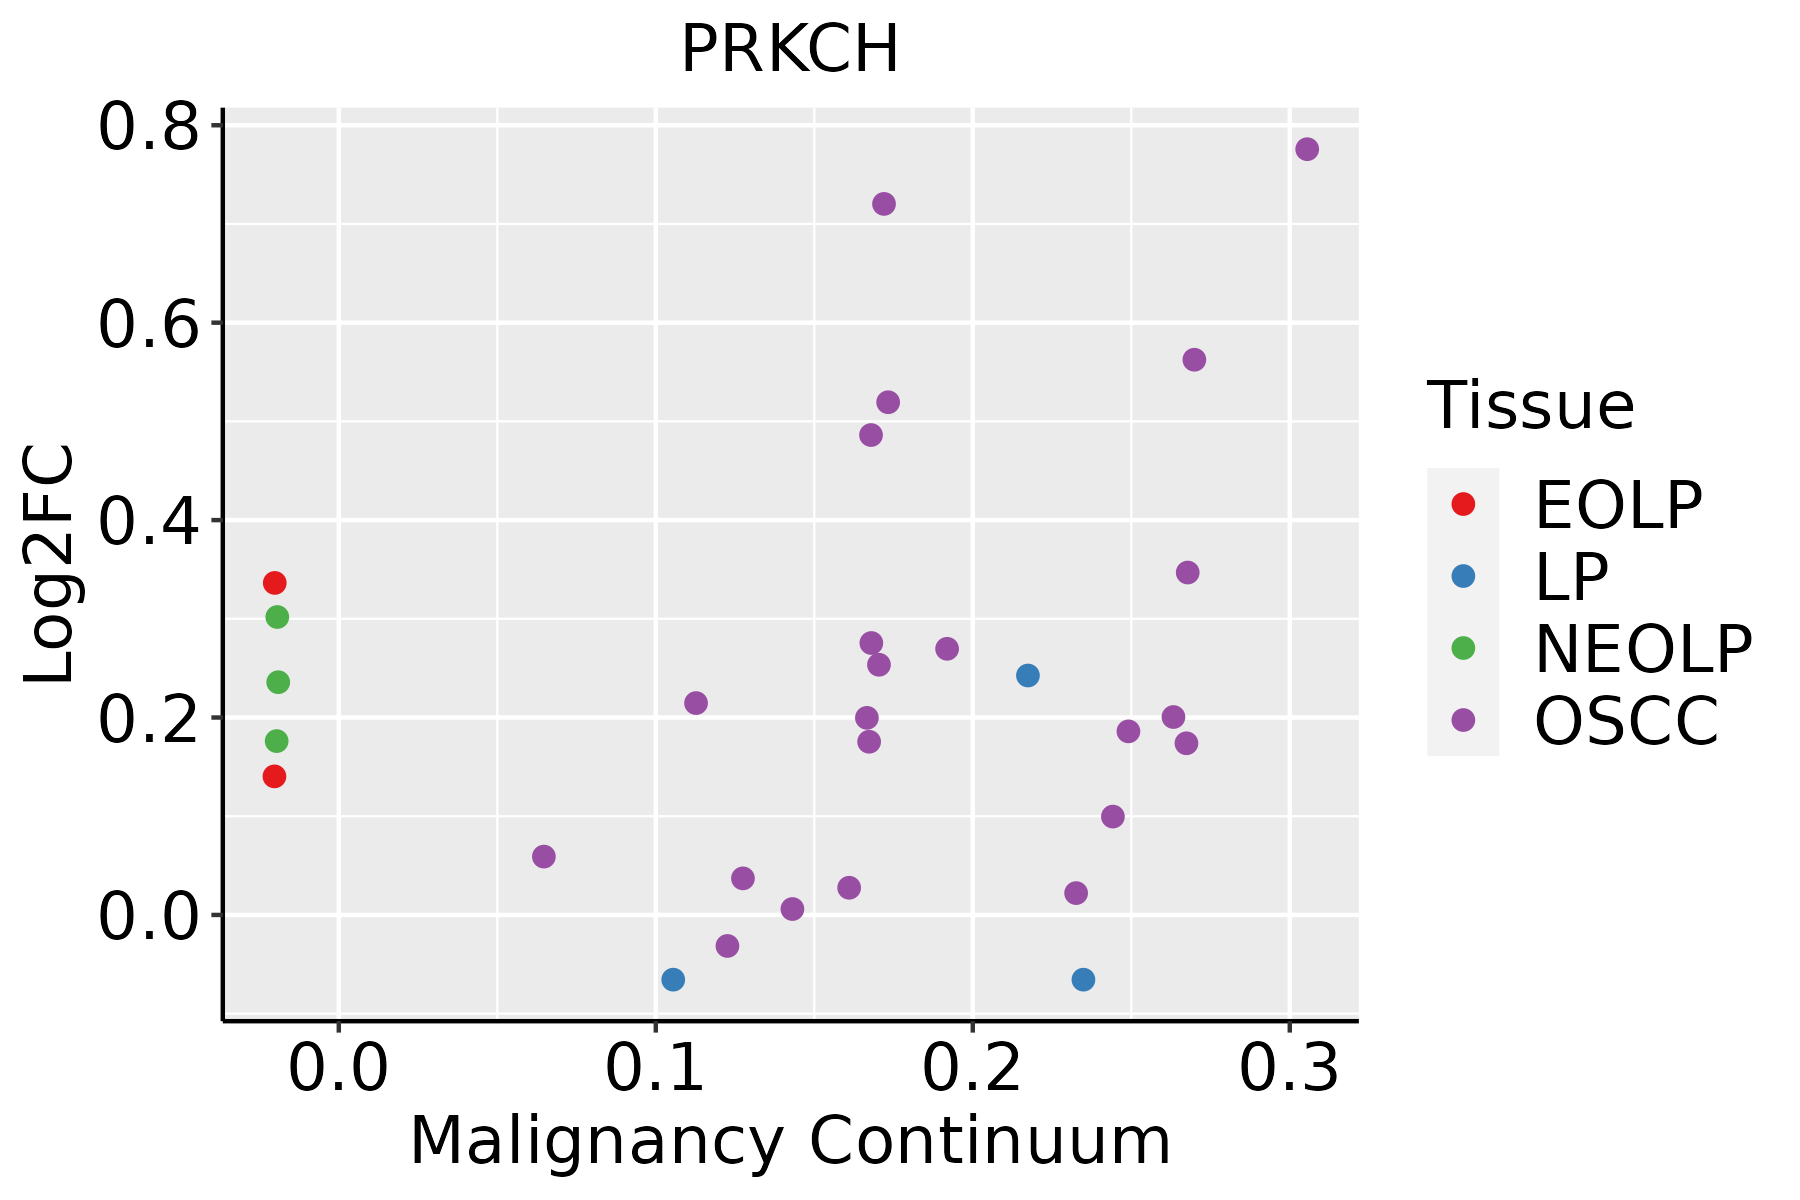 | EOLP: Erosive Oral lichen planus |
| LP: leukoplakia |
| NEOLP: Non-erosive oral lichen planus |
| OSCC: Oral squamous cell carcinoma |
| GO ID | Tissue | Disease Stage | Description | Gene Ratio | Bg Ratio | pvalue | p.adjust | Count |
| GO:00302166 | Oral cavity | OSCC | keratinocyte differentiation | 81/7305 | 139/18723 | 3.16e-06 | 3.81e-05 | 81 |
| GO:00507696 | Oral cavity | OSCC | positive regulation of neurogenesis | 120/7305 | 225/18723 | 8.45e-06 | 9.02e-05 | 120 |
| GO:00099139 | Oral cavity | OSCC | epidermal cell differentiation | 109/7305 | 202/18723 | 1.08e-05 | 1.14e-04 | 109 |
| GO:00420635 | Oral cavity | OSCC | gliogenesis | 154/7305 | 301/18723 | 1.10e-05 | 1.14e-04 | 154 |
| GO:00510917 | Oral cavity | OSCC | positive regulation of DNA-binding transcription factor activity | 134/7305 | 260/18723 | 2.52e-05 | 2.35e-04 | 134 |
| GO:0034350 | Oral cavity | OSCC | regulation of glial cell apoptotic process | 11/7305 | 11/18723 | 3.17e-05 | 2.87e-04 | 11 |
| GO:00507679 | Oral cavity | OSCC | regulation of neurogenesis | 179/7305 | 364/18723 | 4.49e-05 | 3.84e-04 | 179 |
| GO:0014009 | Oral cavity | OSCC | glial cell proliferation | 34/7305 | 51/18723 | 5.83e-05 | 4.80e-04 | 34 |
| GO:00456825 | Oral cavity | OSCC | regulation of epidermis development | 41/7305 | 65/18723 | 7.29e-05 | 5.73e-04 | 41 |
| GO:190437716 | Oral cavity | OSCC | positive regulation of protein localization to cell periphery | 43/7305 | 69/18723 | 7.43e-05 | 5.81e-04 | 43 |
| GO:190307815 | Oral cavity | OSCC | positive regulation of protein localization to plasma membrane | 39/7305 | 62/18723 | 1.19e-04 | 8.54e-04 | 39 |
| GO:00510925 | Oral cavity | OSCC | positive regulation of NF-kappaB transcription factor activity | 82/7305 | 152/18723 | 1.28e-04 | 9.13e-04 | 82 |
| GO:00519624 | Oral cavity | OSCC | positive regulation of nervous system development | 135/7305 | 272/18723 | 2.20e-04 | 1.44e-03 | 135 |
| GO:00456045 | Oral cavity | OSCC | regulation of epidermal cell differentiation | 36/7305 | 58/18723 | 3.15e-04 | 1.96e-03 | 36 |
| GO:0014015 | Oral cavity | OSCC | positive regulation of gliogenesis | 39/7305 | 66/18723 | 7.46e-04 | 4.07e-03 | 39 |
| GO:00519605 | Oral cavity | OSCC | regulation of nervous system development | 205/7305 | 443/18723 | 9.80e-04 | 5.11e-03 | 205 |
| GO:0060251 | Oral cavity | OSCC | regulation of glial cell proliferation | 23/7305 | 36/18723 | 2.19e-03 | 9.95e-03 | 23 |
| GO:00027646 | Oral cavity | OSCC | immune response-regulating signaling pathway | 212/7305 | 468/18723 | 2.93e-03 | 1.27e-02 | 212 |
| GO:00456166 | Oral cavity | OSCC | regulation of keratinocyte differentiation | 23/7305 | 37/18723 | 3.66e-03 | 1.51e-02 | 23 |
| GO:004521618 | Oral cavity | OSCC | cell-cell junction organization | 97/7305 | 200/18723 | 3.83e-03 | 1.57e-02 | 97 |
| Hugo Symbol | Variant Class | Variant Classification | dbSNP RS | HGVSc | HGVSp | HGVSp Short | SWISSPROT | BIOTYPE | SIFT | PolyPhen | Tumor Sample Barcode | Tissue | Histology | Sex | Age | Stage | Therapy Types | Drugs | Outcome |
| PRKCH | SNV | Missense_Mutation | novel | c.1532N>A | p.Thr511Lys | p.T511K | P24723 | protein_coding | deleterious(0) | probably_damaging(0.984) | TCGA-A2-A1G1-01 | Breast | breast invasive carcinoma | Female | >=65 | I/II | Unknown | Unknown | SD |
| PRKCH | SNV | Missense_Mutation | novel | c.208N>A | p.Glu70Lys | p.E70K | P24723 | protein_coding | tolerated(0.06) | probably_damaging(0.941) | TCGA-AR-A2LE-01 | Breast | breast invasive carcinoma | Female | >=65 | I/II | Hormone Therapy | tamoxiphen | PD |
| PRKCH | SNV | Missense_Mutation | | c.1771N>G | p.Lys591Glu | p.K591E | P24723 | protein_coding | deleterious(0) | probably_damaging(0.974) | TCGA-BH-A0BZ-01 | Breast | breast invasive carcinoma | Female | <65 | III/IV | Chemotherapy | doxorubicin | CR |
| PRKCH | SNV | Missense_Mutation | novel | c.1511G>C | p.Gly504Ala | p.G504A | P24723 | protein_coding | deleterious(0) | possibly_damaging(0.607) | TCGA-BH-A0DS-01 | Breast | breast invasive carcinoma | Female | >=65 | III/IV | Chemotherapy | cyclophosphamide | SD |
| PRKCH | SNV | Missense_Mutation | | c.291N>A | p.Phe97Leu | p.F97L | P24723 | protein_coding | tolerated(0.12) | probably_damaging(1) | TCGA-E2-A152-01 | Breast | breast invasive carcinoma | Female | <65 | I/II | Targeted Molecular therapy | trastuzumab | PD |
| PRKCH | SNV | Missense_Mutation | novel | c.1738G>T | p.Asp580Tyr | p.D580Y | P24723 | protein_coding | deleterious(0) | probably_damaging(0.969) | TCGA-E9-A1N9-01 | Breast | breast invasive carcinoma | Female | <65 | I/II | Chemotherapy | doxorubicin | SD |
| PRKCH | insertion | Frame_Shift_Ins | novel | c.1247_1248insAAACCCAGGATCCTGGGTTATGCTTTTGTCTGGGGACCAGGCAGGA | p.Thr417AsnfsTer39 | p.T417Nfs*39 | P24723 | protein_coding | | | TCGA-BH-A0B1-01 | Breast | breast invasive carcinoma | Female | >=65 | I/II | Chemotherapy | adriamycin | SD |
| PRKCH | insertion | Nonsense_Mutation | novel | c.1982_1983insGCTCCAGCCTGGGCAACTGAGTTAGACTTTGTCTCAAAAA | p.His662LeufsTer8 | p.H662Lfs*8 | P24723 | protein_coding | | | TCGA-BH-A0HW-01 | Breast | breast invasive carcinoma | Female | <65 | I/II | Chemotherapy | doxorubicin | SD |
| PRKCH | SNV | Missense_Mutation | | c.291N>G | p.Phe97Leu | p.F97L | P24723 | protein_coding | tolerated(0.12) | probably_damaging(1) | TCGA-C5-A1BQ-01 | Cervix | cervical & endocervical cancer | Female | >=65 | III/IV | Chemotherapy | cisplatin | CR |
| PRKCH | SNV | Missense_Mutation | novel | c.671N>A | p.Cys224Tyr | p.C224Y | P24723 | protein_coding | tolerated(0.19) | possibly_damaging(0.793) | TCGA-MY-A5BF-01 | Cervix | cervical & endocervical cancer | Female | >=65 | I/II | Chemotherapy | cisplatin | CR |
| Entrez ID | Symbol | Category | Interaction Types | Drug Claim Name | Drug Name | PMIDs |
| 5583 | PRKCH | ENZYME, KINASE, DRUGGABLE GENOME, SERINE THREONINE KINASE | inhibitor | 249565629 | SOTRASTAURIN | |
| 5583 | PRKCH | ENZYME, KINASE, DRUGGABLE GENOME, SERINE THREONINE KINASE | inhibitor | CHEMBL3545332 | CEP-2563 | |
| 5583 | PRKCH | ENZYME, KINASE, DRUGGABLE GENOME, SERINE THREONINE KINASE | | BRYOSTATIN-1 | | |
| 5583 | PRKCH | ENZYME, KINASE, DRUGGABLE GENOME, SERINE THREONINE KINASE | | BRYOSTATIN | BRYOSTATIN | |
| 5583 | PRKCH | ENZYME, KINASE, DRUGGABLE GENOME, SERINE THREONINE KINASE | inhibitor | CHEMBL494089 | GSK-690693 | |
| 5583 | PRKCH | ENZYME, KINASE, DRUGGABLE GENOME, SERINE THREONINE KINASE | inhibitor | CHEMBL565612 | SOTRASTAURIN | |
| 5583 | PRKCH | ENZYME, KINASE, DRUGGABLE GENOME, SERINE THREONINE KINASE | | INGENOL MEBUTATE | | |
| 5583 | PRKCH | ENZYME, KINASE, DRUGGABLE GENOME, SERINE THREONINE KINASE | inhibitor | CHEMBL608533 | MIDOSTAURIN | |
| 5583 | PRKCH | ENZYME, KINASE, DRUGGABLE GENOME, SERINE THREONINE KINASE | inhibitor | 249565822 | BALANOL | |
| 5583 | PRKCH | ENZYME, KINASE, DRUGGABLE GENOME, SERINE THREONINE KINASE | inhibitor | SOPHORETIN | QUERCETIN | |


