Schematic overview of the cellular and molecular mechanisms involved in the cancer progression, including the proposed cellular and molecular mechanisms in cancer cells trajectory. AT1: alveolar type 1 cells; AT2: alveolar type 2 cells; AAH: atypical adenomatous hyperplasia; AIS: adenocarcinoma in situ; MIA: minimally invasive adenocarcinoma; IA: invasive adenocarcinoma; EMT: epithelial-mesenchymal transition

Home

Download

Statistics

Help

Contact

Center for Computational Systems Medicine
leaf

Gene summary

leaf

Malignant transformation analysis

leaf

Malignant transformation related pathway analysis

leaf

Cell-cell communication analysis

leaf

Single-cell gene regulatory network inference analysis

leaf

Somatic mutation of malignant transformation related genes

leaf

Related drugs of malignant transformation related genes

Gene: PPFIA1

Gene summary for PPFIA1

check button Gene summary.

Gene informationSpeciesHuman
Gene symbol

PPFIA1

Gene ID

8500

Gene namePTPRF interacting protein alpha 1
Gene AliasLIP.1
Cytomap11q13.3
Gene Typeprotein-coding
GO ID

GO:0006996

UniProtAcc

B3KVS8


Top

Malignant transformation analysis

check button Identification of the aberrant gene expression in precancerous and cancerous lesions by comparing the gene expression of stem-like cells in diseased tissues with normal stem cells
check button Malignant transformation involving gene list.
Entrez IDSymbolReplicatesSpeciesOrganTissueAdj P-valueLog2FCMalignancy
8500PPFIA1HTA11_3410_2000001011HumanColorectumAD1.13e-20-6.63e-010.0155
8500PPFIA1HTA11_2487_2000001011HumanColorectumSER1.01e-08-6.04e-01-0.1808
8500PPFIA1HTA11_1938_2000001011HumanColorectumAD2.08e-04-5.31e-01-0.0811
8500PPFIA1HTA11_78_2000001011HumanColorectumAD2.24e-06-5.39e-01-0.1088
8500PPFIA1HTA11_347_2000001011HumanColorectumAD2.13e-05-4.17e-01-0.1954
8500PPFIA1HTA11_3361_2000001011HumanColorectumAD1.56e-04-5.49e-01-0.1207
8500PPFIA1HTA11_83_2000001011HumanColorectumSER3.67e-04-5.80e-01-0.1526
8500PPFIA1HTA11_696_2000001011HumanColorectumAD2.69e-19-5.82e-01-0.1464
8500PPFIA1HTA11_866_2000001011HumanColorectumAD2.96e-21-6.02e-01-0.1001
8500PPFIA1HTA11_1391_2000001011HumanColorectumAD1.05e-03-4.55e-01-0.059
8500PPFIA1HTA11_546_2000001011HumanColorectumAD6.84e-03-5.61e-01-0.0842
8500PPFIA1HTA11_866_3004761011HumanColorectumAD1.64e-14-6.05e-010.096
8500PPFIA1HTA11_8622_2000001021HumanColorectumSER2.12e-02-6.12e-010.0528
8500PPFIA1HTA11_7663_2000001011HumanColorectumSER3.12e-02-6.68e-010.0131
8500PPFIA1HTA11_10623_2000001011HumanColorectumAD1.00e-03-6.43e-01-0.0177
8500PPFIA1HTA11_10711_2000001011HumanColorectumAD6.37e-10-6.45e-010.0338
8500PPFIA1HTA11_7696_3000711011HumanColorectumAD1.50e-20-6.22e-010.0674
8500PPFIA1HTA11_6818_2000001021HumanColorectumAD7.57e-05-5.72e-010.0588
8500PPFIA1HTA11_99999970781_79442HumanColorectumMSS6.32e-15-5.19e-010.294
8500PPFIA1HTA11_99999965104_69814HumanColorectumMSS1.25e-02-4.62e-010.281
Page: 1 2 3 4 5 6 7 8 9 10 

check button Transcriptomic changes along malignancy continuum.
TissueExpression DynamicsAbbreviation
Colorectum (GSE201348)The image shows the transcriptomic changes along malignancy continuum.log2FC in expression of this searched gene in stem-like cells from each diseased tissue sample relative to stem-like cells in normal samples in each tissue plotted against the malignancy continuum. Samples are colored based on if they are from different disease stage.
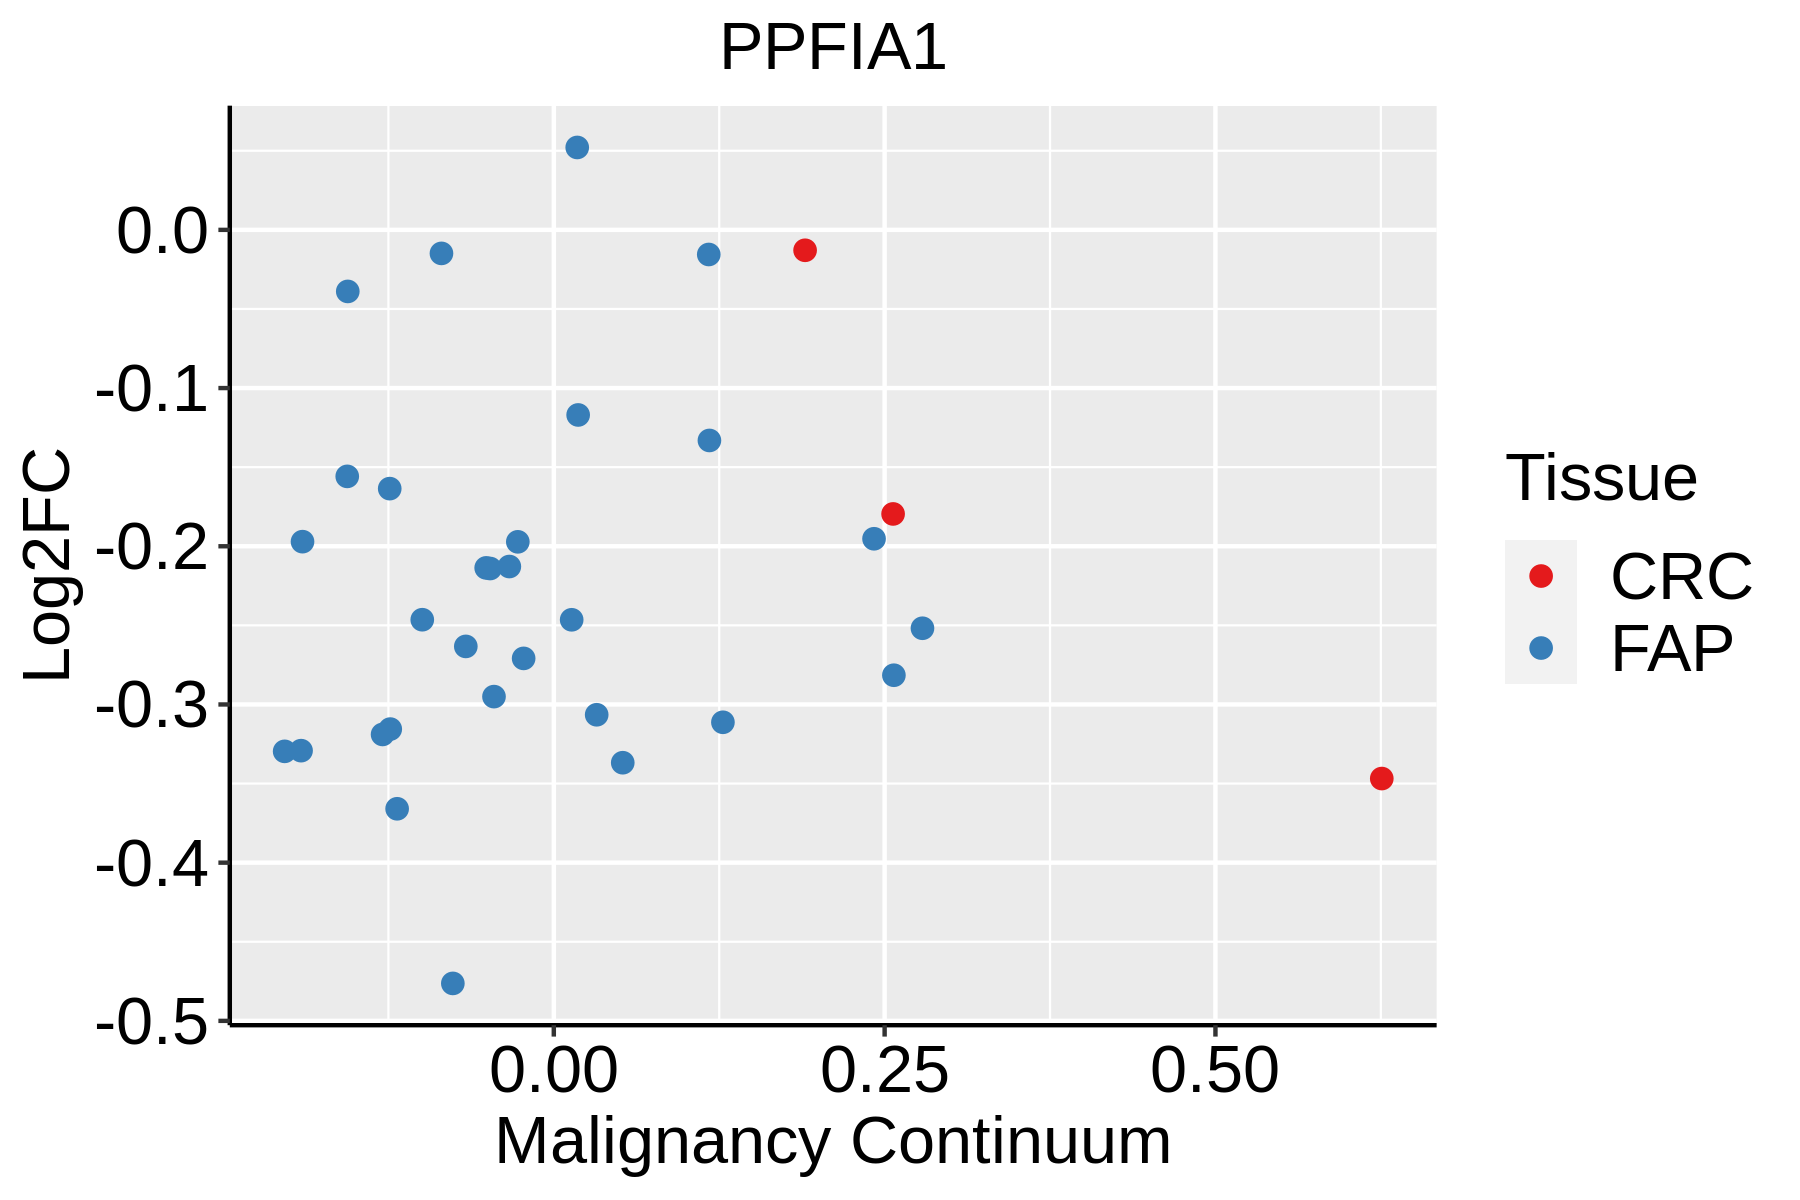
FAP: Familial adenomatous polyposis
CRC: Colorectal cancer
Colorectum (HTA11)The image shows the transcriptomic changes along malignancy continuum.log2FC in expression of this searched gene in stem-like cells from each diseased tissue sample relative to stem-like cells in normal samples in each tissue plotted against the malignancy continuum. Samples are colored based on if they are from different disease stage.AD: Adenomas
SER: Sessile serrated lesions
MSI-H: Microsatellite-high colorectal cancer
MSS: Microsatellite stable colorectal cancer
EsophagusThe image shows the transcriptomic changes along malignancy continuum.log2FC in expression of this searched gene in stem-like cells from each diseased tissue sample relative to stem-like cells in normal samples in each tissue plotted against the malignancy continuum. Samples are colored based on if they are from different disease stage.
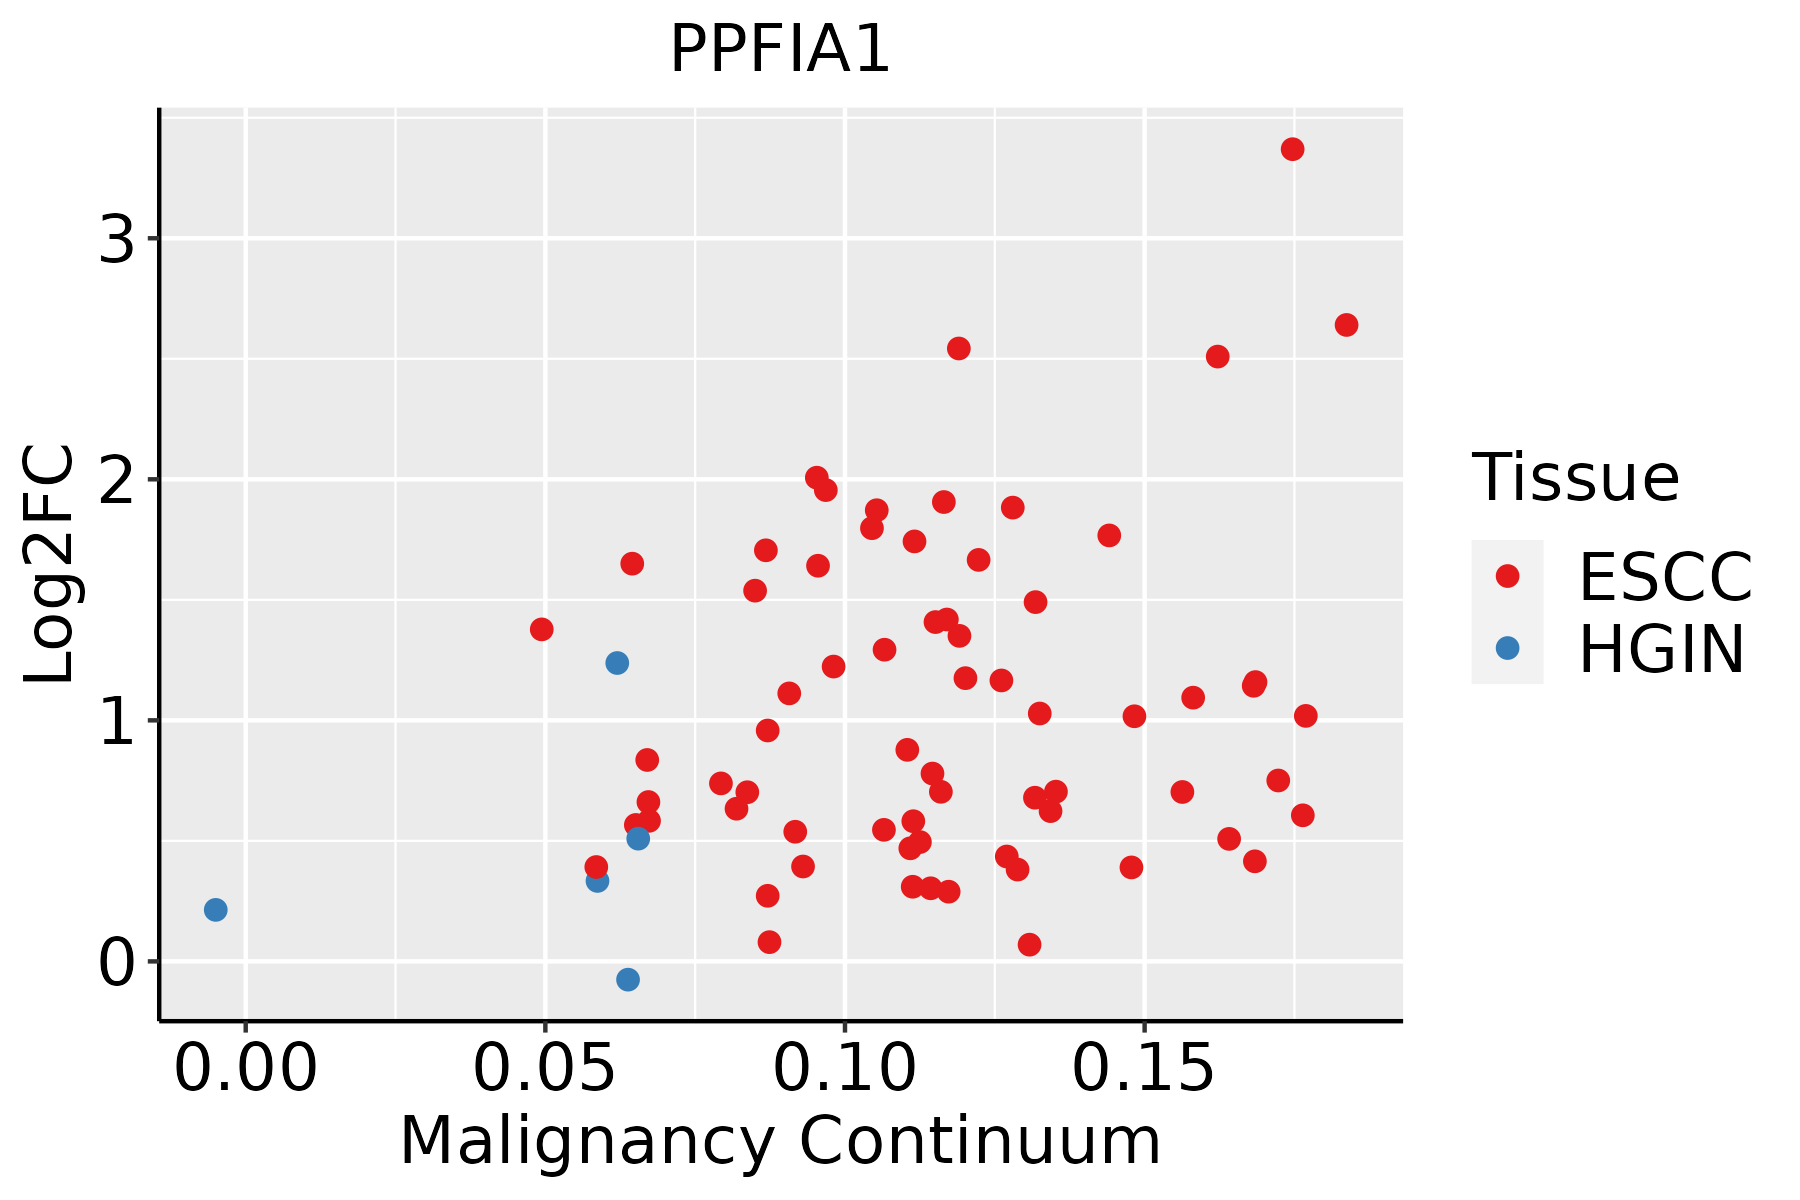
ESCC: Esophageal squamous cell carcinoma
HGIN: High-grade intraepithelial neoplasias
LGIN: Low-grade intraepithelial neoplasias
LiverThe image shows the transcriptomic changes along malignancy continuum.log2FC in expression of this searched gene in stem-like cells from each diseased tissue sample relative to stem-like cells in normal samples in each tissue plotted against the malignancy continuum. Samples are colored based on if they are from different disease stage.
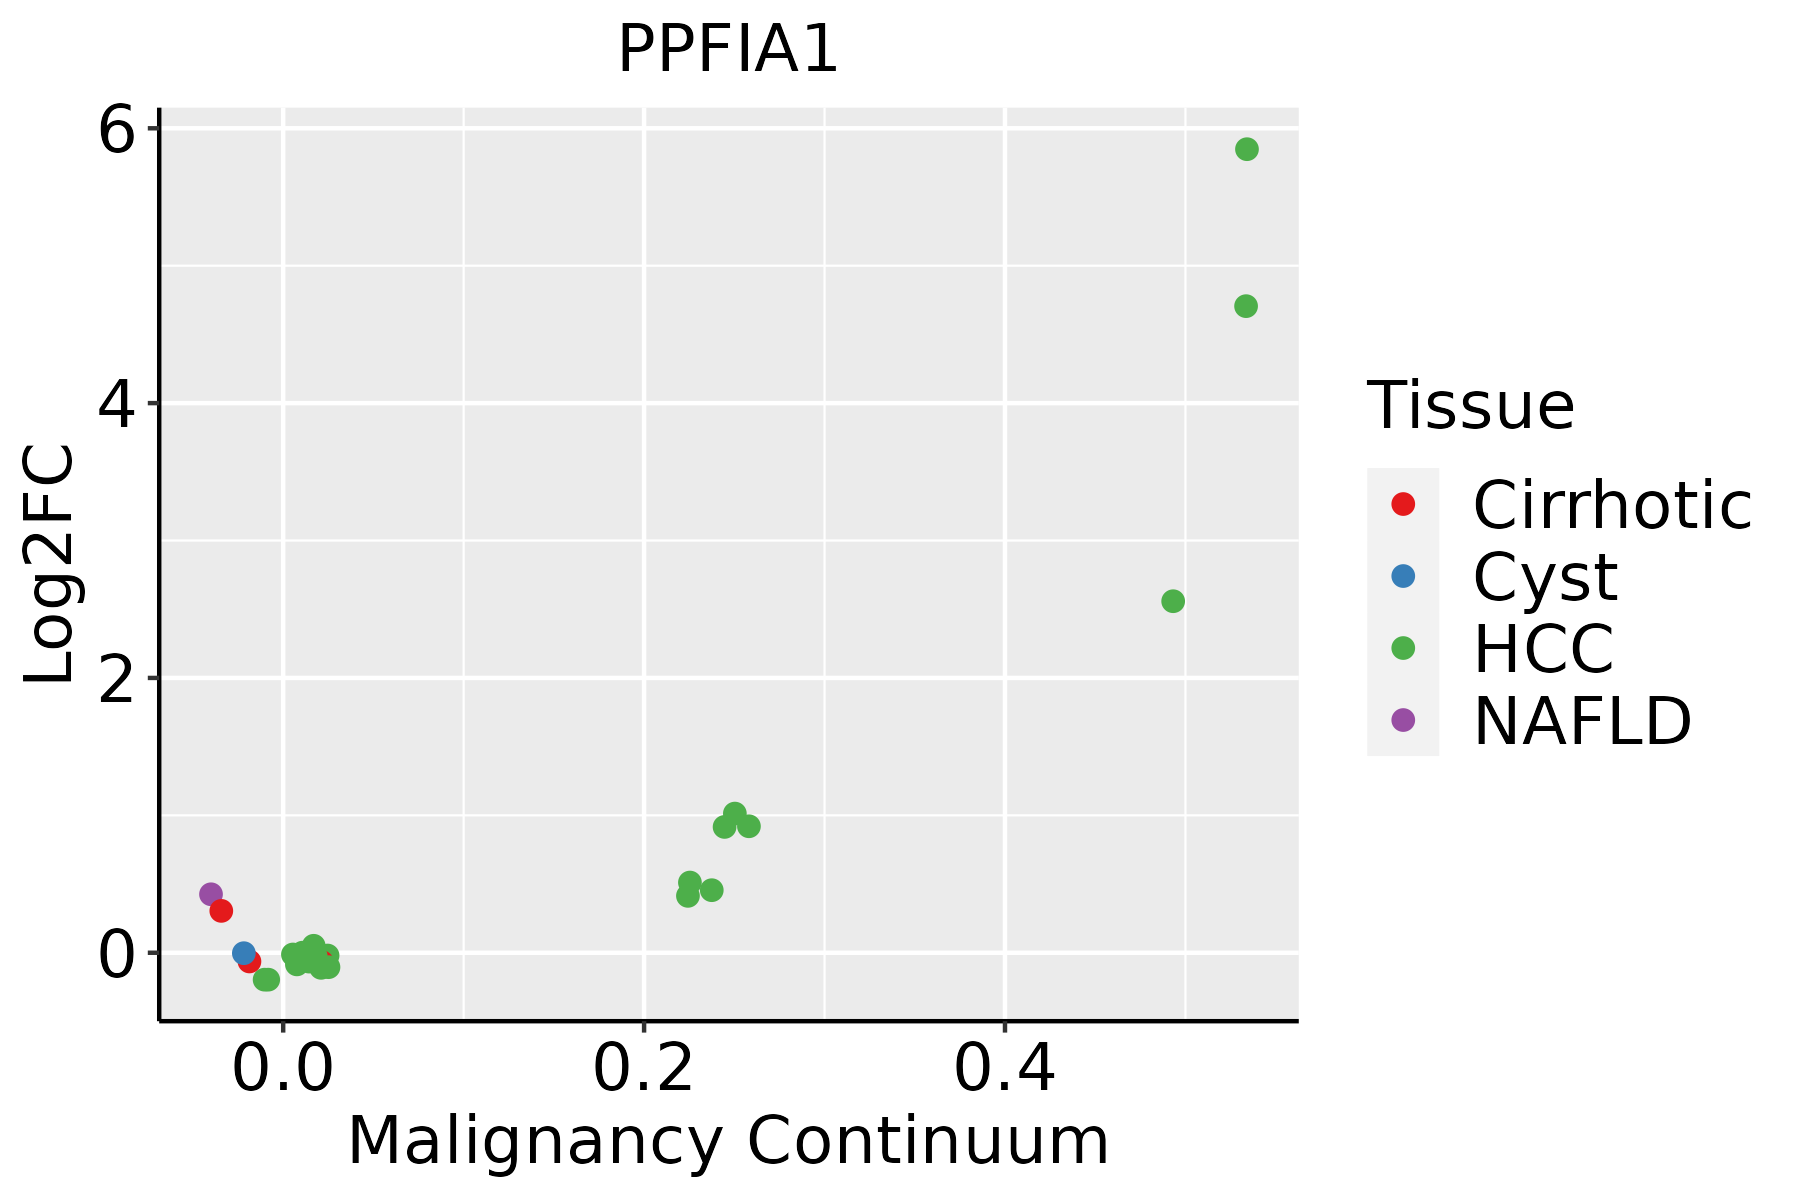
HCC: Hepatocellular carcinoma
NAFLD: Non-alcoholic fatty liver disease
LungThe image shows the transcriptomic changes along malignancy continuum.log2FC in expression of this searched gene in stem-like cells from each diseased tissue sample relative to stem-like cells in normal samples in each tissue plotted against the malignancy continuum. Samples are colored based on if they are from different disease stage.AAH: Atypical adenomatous hyperplasia
AIS: Adenocarcinoma in situ
IAC: Invasive lung adenocarcinoma
MIA: Minimally invasive adenocarcinoma
Oral CavityThe image shows the transcriptomic changes along malignancy continuum.log2FC in expression of this searched gene in stem-like cells from each diseased tissue sample relative to stem-like cells in normal samples in each tissue plotted against the malignancy continuum. Samples are colored based on if they are from different disease stage.
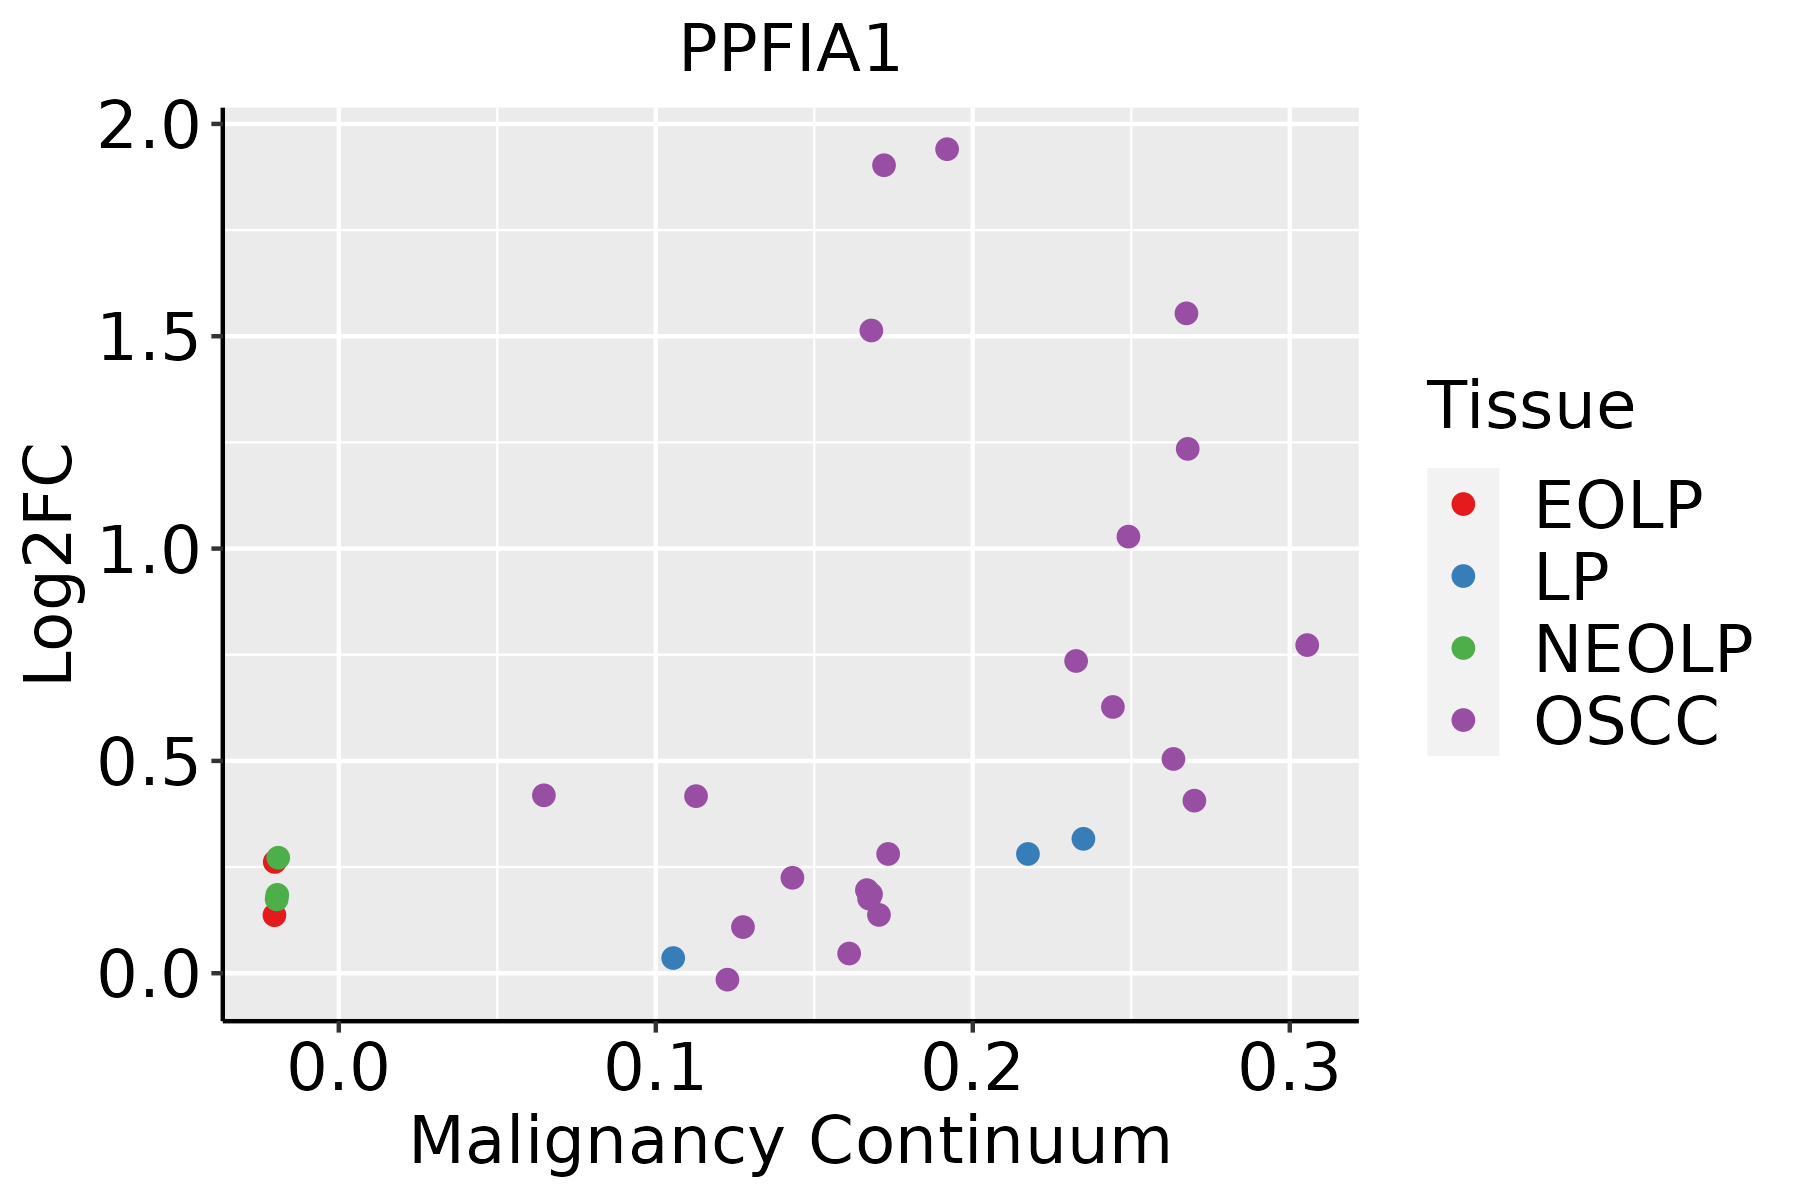
EOLP: Erosive Oral lichen planus
LP: leukoplakia
NEOLP: Non-erosive oral lichen planus
OSCC: Oral squamous cell carcinoma
ProstateThe image shows the transcriptomic changes along malignancy continuum.log2FC in expression of this searched gene in stem-like cells from each diseased tissue sample relative to stem-like cells in normal samples in each tissue plotted against the malignancy continuum. Samples are colored based on if they are from different disease stage.
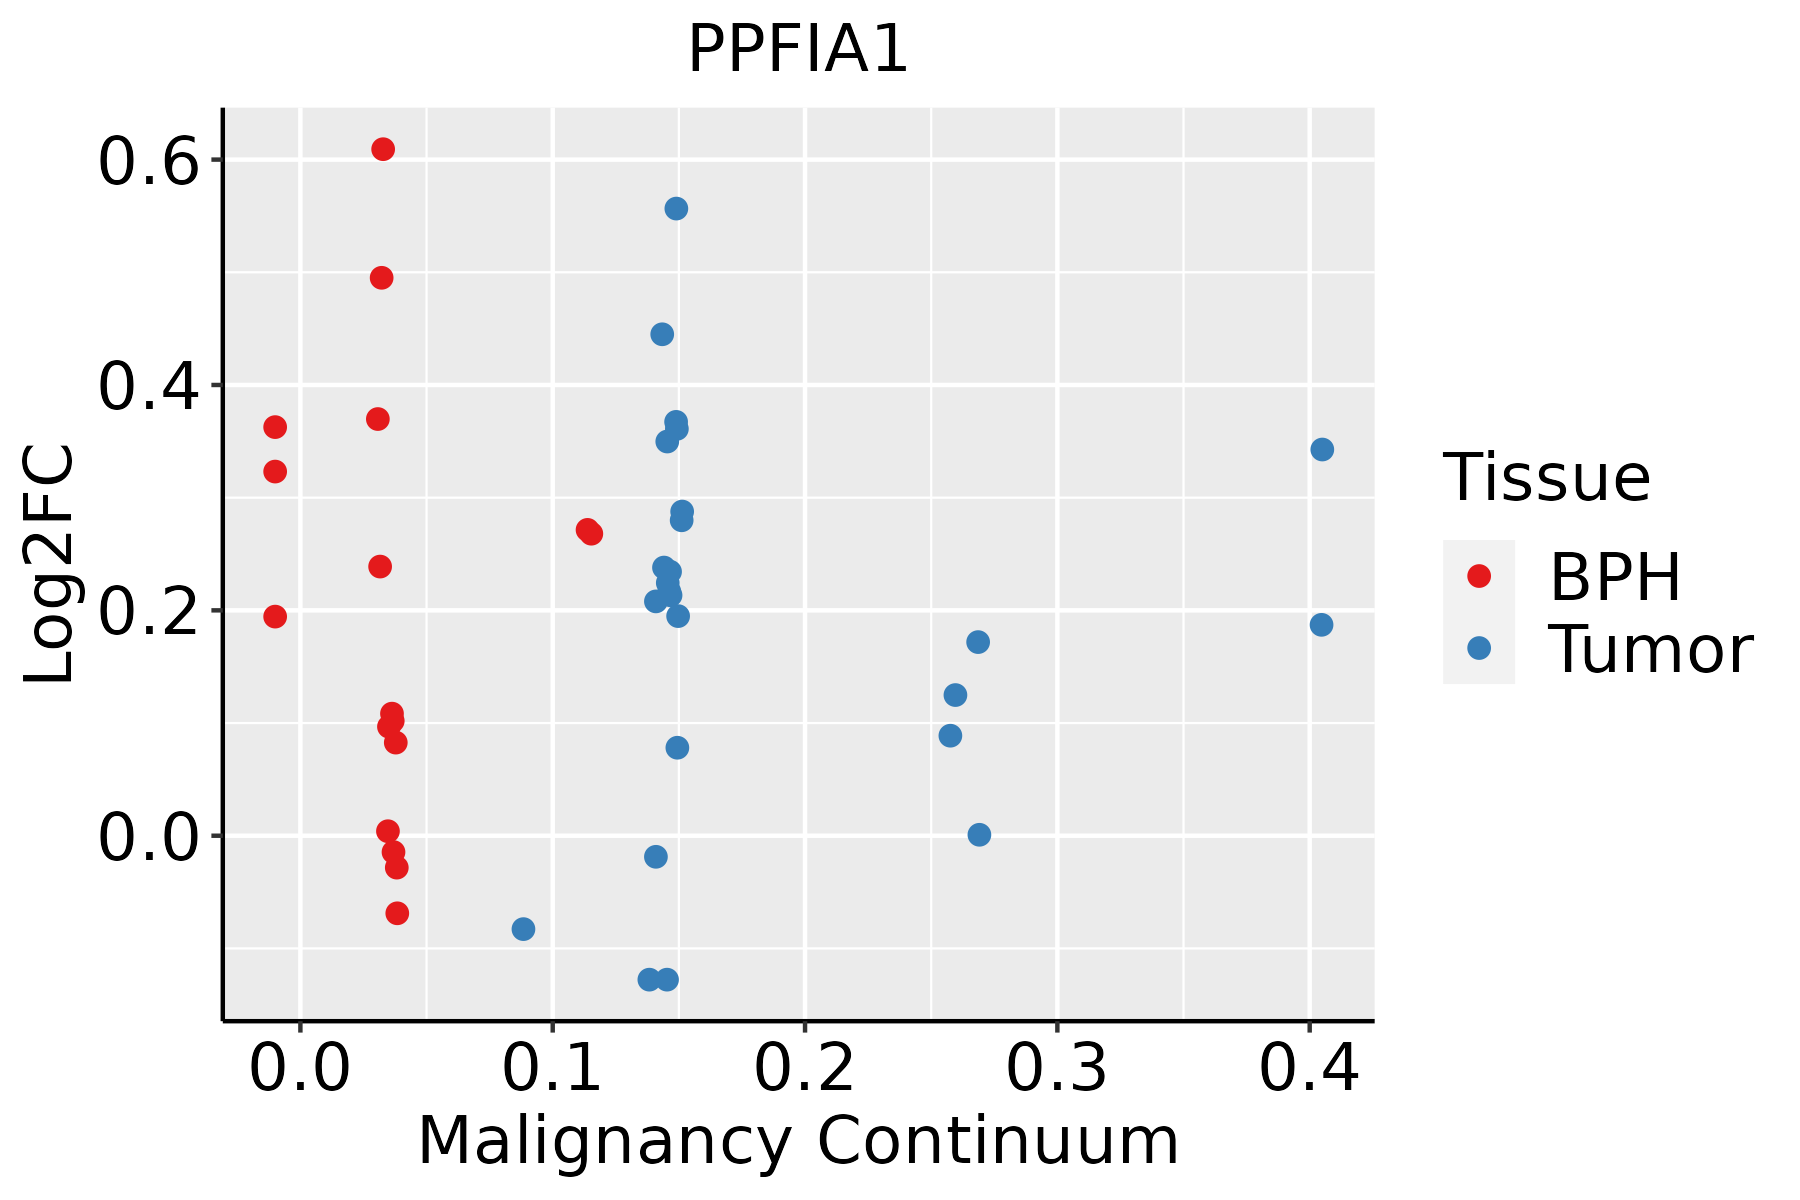
BPH: Benign Prostatic Hyperplasia
SkinThe image shows the transcriptomic changes along malignancy continuum.log2FC in expression of this searched gene in stem-like cells from each diseased tissue sample relative to stem-like cells in normal samples in each tissue plotted against the malignancy continuum. Samples are colored based on if they are from different disease stage.
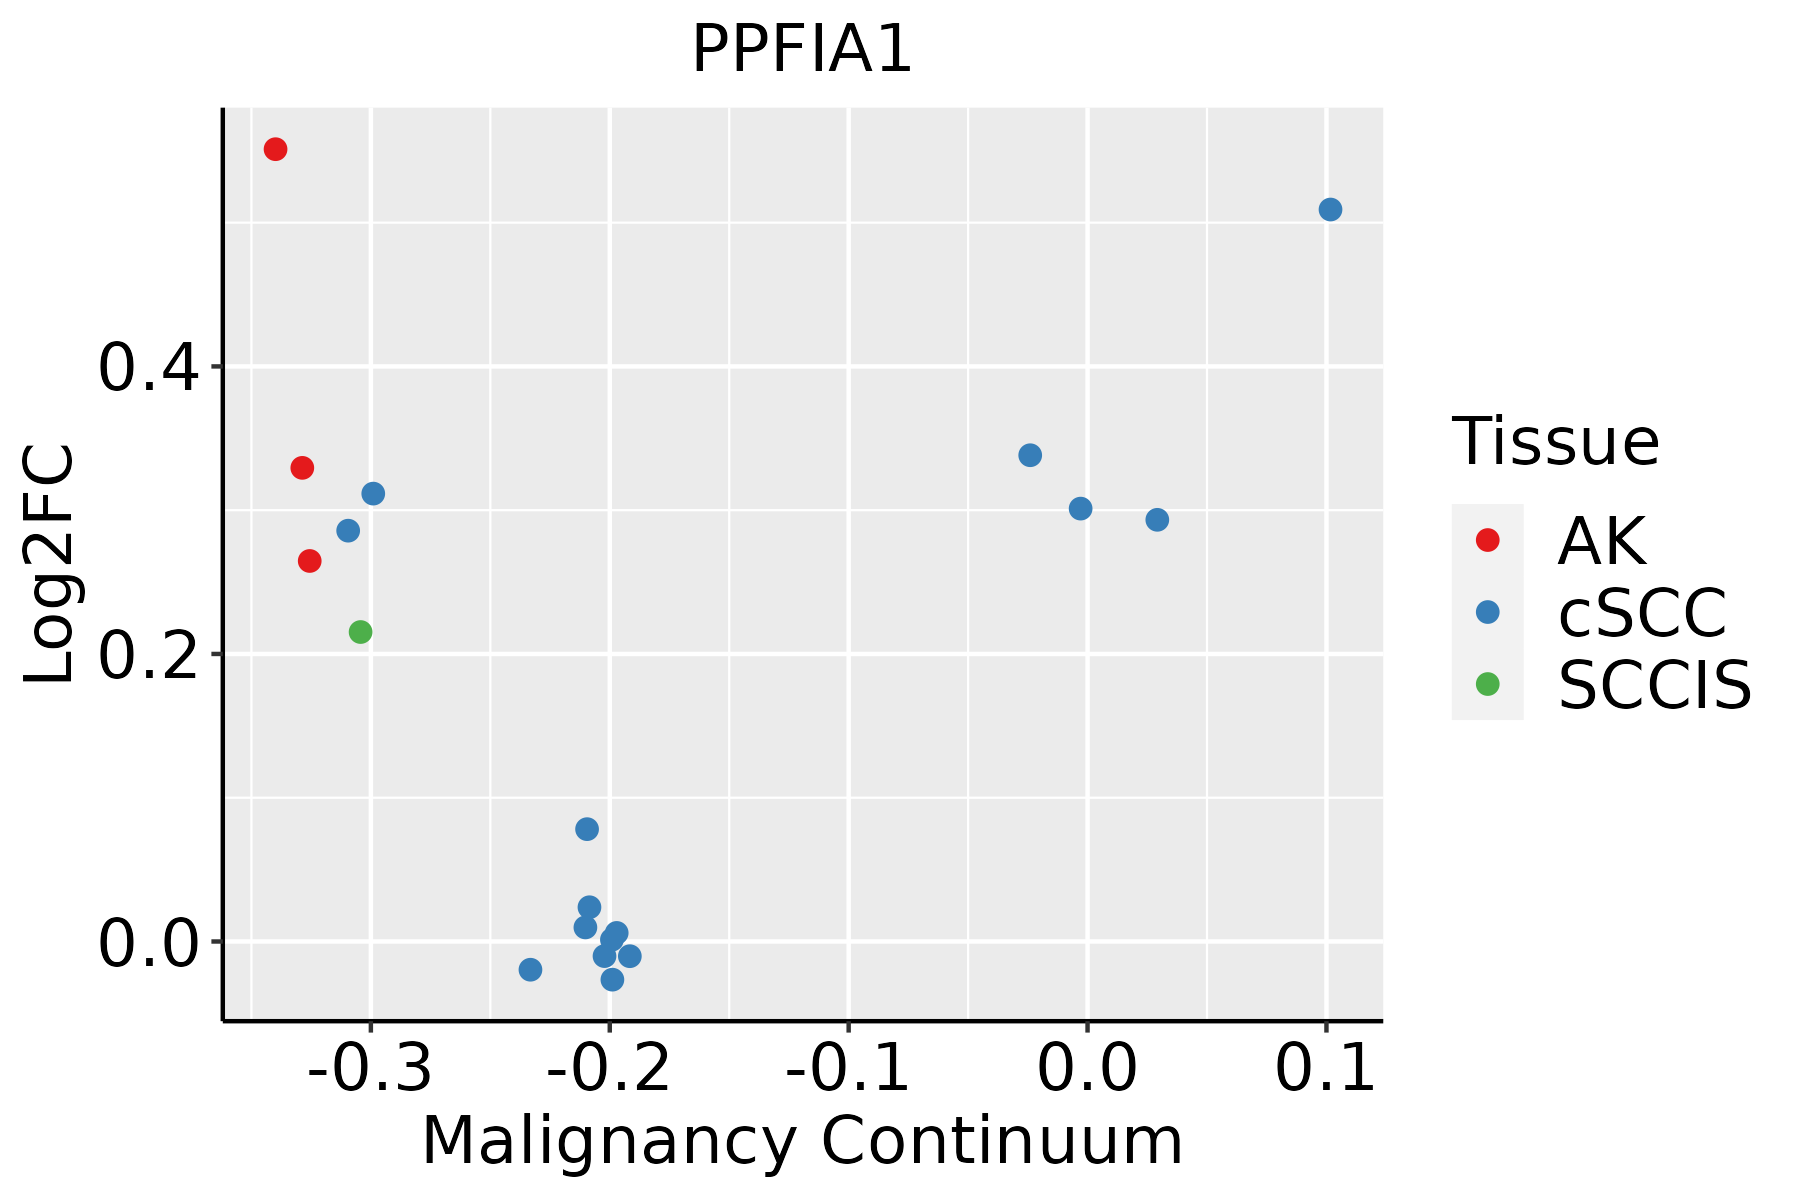
AK: Actinic keratosis
cSCC: Cutaneous squamous cell carcinoma
SCCIS:squamous cell carcinoma in situ
ThyroidThe image shows the transcriptomic changes along malignancy continuum.log2FC in expression of this searched gene in stem-like cells from each diseased tissue sample relative to stem-like cells in normal samples in each tissue plotted against the malignancy continuum. Samples are colored based on if they are from different disease stage.
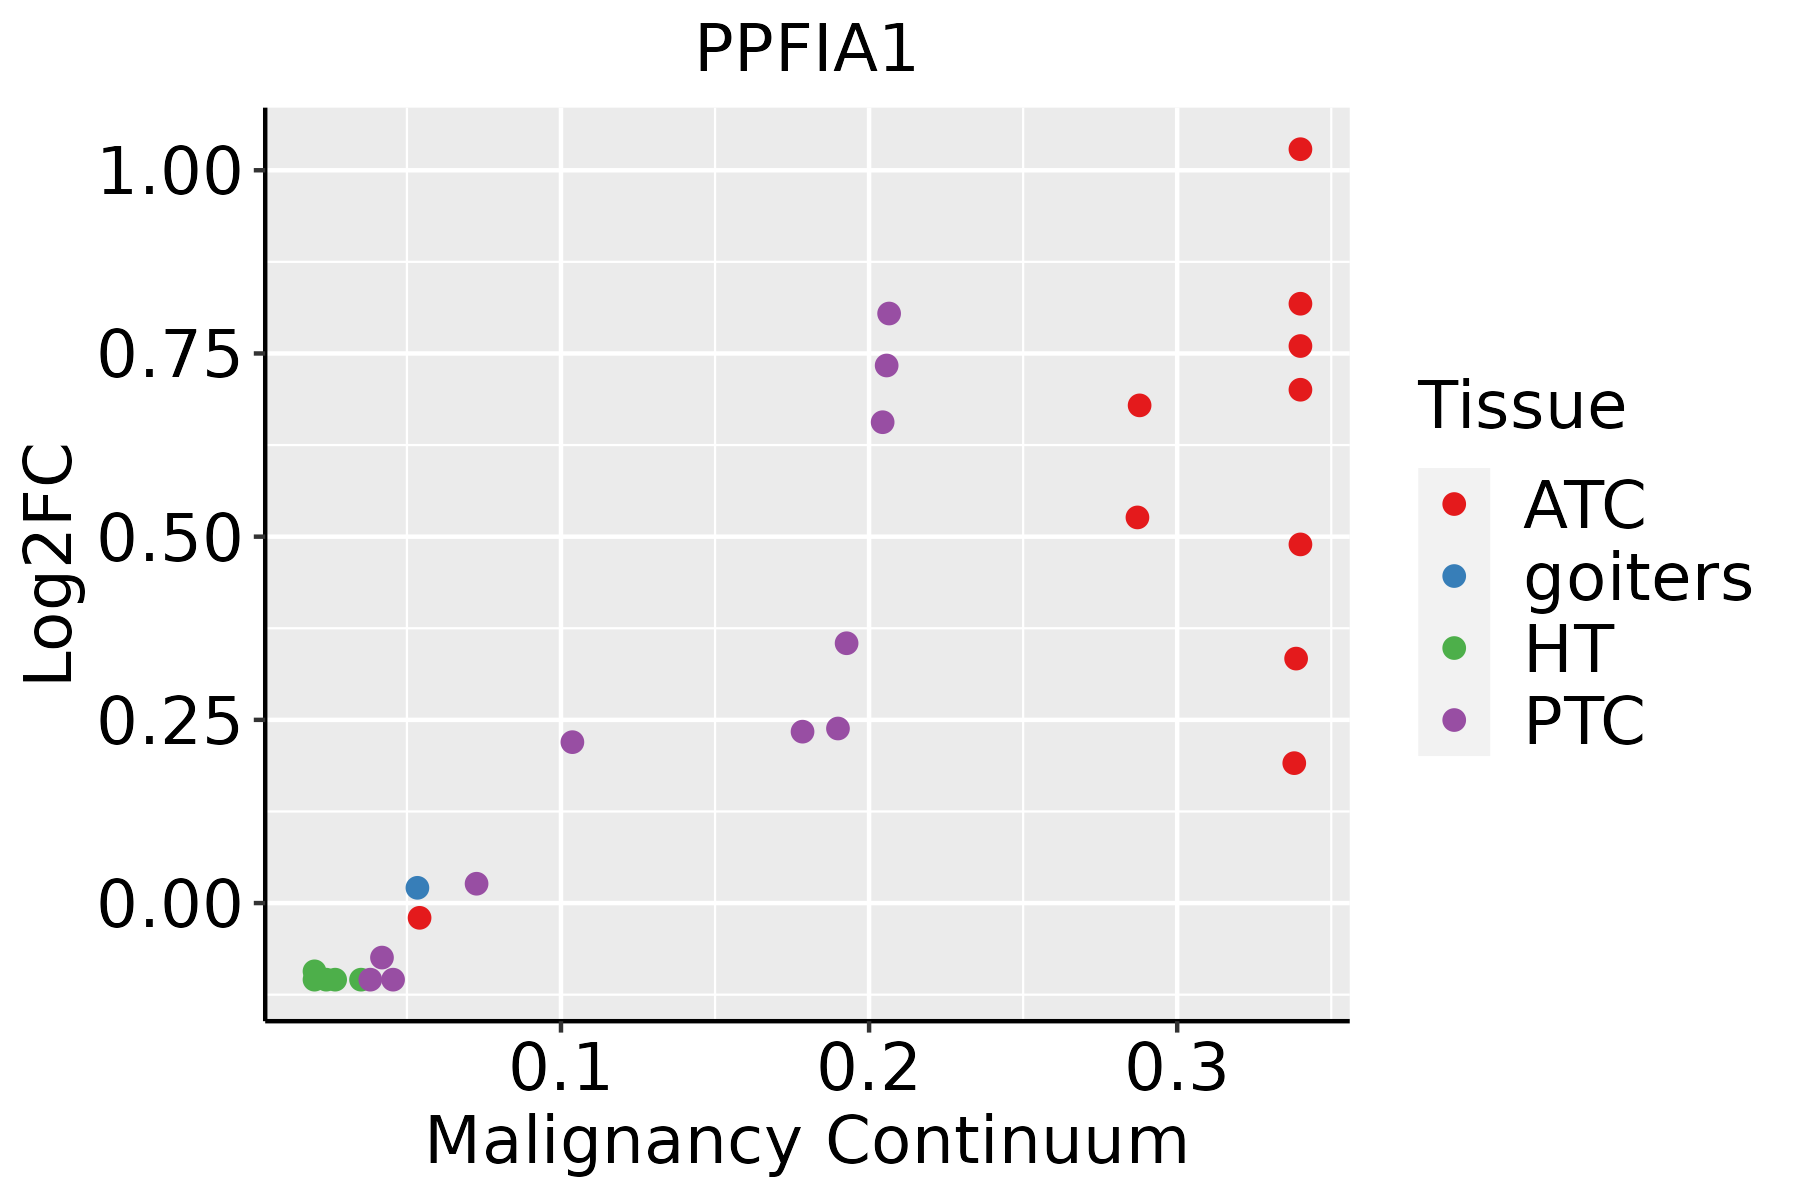
ATC: Anaplastic thyroid cancer
HT: Hashimoto's thyroiditis
PTC: Papillary thyroid cancer
∗log2FC in expression of this searched gene in stem-like cells from each diseased tissue sample relative to stem-like cells in normal samples in each tissue plotted against the malignancy continuum. Samples are colored based on if they are from different disease stage.

Top

Malignant transformation related pathway analysis

check buttonFind out the enriched GO biological processes and KEGG pathways involved in transition from healthy to precancer to cancer
check button Figure of enriched GO biological processes.
TissueDisease StageEnriched GO biological Processes
ColorectumADGO analysis - Figure of enriched GO biological processes: Top 15 enriched GO BP terms are showed in the bar plot of each disease state in each tissue. Each row represents a significant GO biological process which is colored according to the -log10(p.adjust).
ColorectumSERGO analysis - Figure of enriched GO biological processes: Top 15 enriched GO BP terms are showed in the bar plot of each disease state in each tissue. Each row represents a significant GO biological process which is colored according to the -log10(p.adjust).
ColorectumMSSGO analysis - Figure of enriched GO biological processes: Top 15 enriched GO BP terms are showed in the bar plot of each disease state in each tissue. Each row represents a significant GO biological process which is colored according to the -log10(p.adjust).
ColorectumMSI-HGO analysis - Figure of enriched GO biological processes: Top 15 enriched GO BP terms are showed in the bar plot of each disease state in each tissue. Each row represents a significant GO biological process which is colored according to the -log10(p.adjust).
ColorectumFAPGO analysis - Figure of enriched GO biological processes: Top 15 enriched GO BP terms are showed in the bar plot of each disease state in each tissue. Each row represents a significant GO biological process which is colored according to the -log10(p.adjust).
∗Top 15 enriched GO BP terms are showed in the bar plot of each disease state in each tissue. Each row represents a significant GO biological process which is colored according to the -log10(p.adjust).
Page: 1 2 3 4 5 6 7 8 9 

check button Enriched GO biological processes.
GO IDTissueDisease StageDescriptionGene RatioBg Ratiopvaluep.adjustCount
GO:005101722LiverHCCactin filament bundle assembly96/7958157/187231.81e-062.52e-0596
GO:006157222LiverHCCactin filament bundle organization97/7958161/187234.04e-065.22e-0597
GO:190382811LiverHCCnegative regulation of cellular protein localization71/7958117/187235.44e-055.12e-0471
GO:003103222LiverHCCactomyosin structure organization109/7958196/187231.39e-041.13e-03109
GO:003158922LiverHCCcell-substrate adhesion188/7958363/187232.00e-041.55e-03188
GO:000716021LiverHCCcell-matrix adhesion123/7958233/187239.34e-045.47e-03123
GO:190307711LiverHCCnegative regulation of protein localization to plasma membrane18/795824/187231.27e-036.92e-0318
GO:190290412LiverHCCnegative regulation of supramolecular fiber organization90/7958167/187231.90e-039.69e-0390
GO:003003822LiverHCCcontractile actin filament bundle assembly60/7958106/187232.34e-031.16e-0260
GO:004314922LiverHCCstress fiber assembly60/7958106/187232.34e-031.16e-0260
GO:190437611LiverHCCnegative regulation of protein localization to cell periphery18/795826/187235.37e-032.24e-0218
GO:190547611LiverHCCnegative regulation of protein localization to membrane21/795832/187237.02e-032.80e-0221
GO:003223122LiverHCCregulation of actin filament bundle assembly57/7958105/187239.73e-033.66e-0257
GO:00514946LiverHCCnegative regulation of cytoskeleton organization84/7958163/187231.22e-024.43e-0284
GO:011002022LiverHCCregulation of actomyosin structure organization54/7958100/187231.33e-024.76e-0254
GO:00071607LungIACcell-matrix adhesion63/2061233/187237.08e-124.27e-0963
GO:00315897LungIACcell-substrate adhesion85/2061363/187238.57e-124.27e-0985
GO:00070158LungIACactin filament organization92/2061442/187231.01e-091.93e-0792
GO:00510178LungIACactin filament bundle assembly40/2061157/187232.66e-072.14e-0540
GO:00310327LungIACactomyosin structure organization46/2061196/187234.70e-073.10e-0546
Page: 1 2 3 4 5 6 7 8 9 10 11 12 13 14 15 16 17 18 19 20 21 22 23 24 25 

check button Enriched KEGG pathways.
Pathway IDTissueDisease StageDescriptionGene RatioBg Ratiopvaluep.adjustqvalueCount
Page: 1 

Top

Cell-cell communication analysis

check buttonIdentification of potential cell-cell interactions between two cell types and their ligand-receptor pairs for different disease states
LigandReceptorLRpairPathwayTissueDisease Stage
Page: 1 

Top

Single-cell gene regulatory network inference analysis

check buttonFind out the significant the regulons (TFs) and the target genes of each regulon across cell types for different disease states
TFCell TypeTissueDisease StageTarget GeneRSSRegulon Activity
∗The dot plots of a searched regulon are shown for all cell subpopulations in each disease state of each tissue based on the regulon specific score inferred using pySCENIC and by calculating the average expression.
Page: 1 

Top

Somatic mutation of malignant transformation related genes

check buttonAnnotation of somatic variants for genes involved in malignant transformation
Hugo SymbolVariant ClassVariant ClassificationdbSNP RSHGVScHGVSpHGVSp ShortSWISSPROTBIOTYPESIFTPolyPhenTumor Sample BarcodeTissueHistologySexAgeStageTherapy TypesDrugsOutcome
PPFIA1SNVMissense_Mutationc.113N>Cp.Gln38Prop.Q38PQ13136protein_codingdeleterious(0)possibly_damaging(0.824)TCGA-A1-A0SO-01Breastbreast invasive carcinomaFemale>=65I/IIChemotherapySD
PPFIA1SNVMissense_Mutationnovelc.632N>Tp.Asn211Ilep.N211IQ13136protein_codingtolerated(0.06)benign(0.017)TCGA-A7-A6VX-01Breastbreast invasive carcinomaFemale>=65I/IIChemotherapydocetaxelCR
PPFIA1SNVMissense_Mutationrs767442340c.1912N>Ap.Ala638Thrp.A638TQ13136protein_codingdeleterious(0)probably_damaging(0.935)TCGA-A8-A091-01Breastbreast invasive carcinomaFemale<65I/IIChemotherapy5-fluorouracilPD
PPFIA1SNVMissense_Mutationnovelc.217N>Tp.His73Tyrp.H73YQ13136protein_codingtolerated(0.11)possibly_damaging(0.709)TCGA-A8-A097-01Breastbreast invasive carcinomaFemale>=65I/IIHormone TherapytamoxiphenSD
PPFIA1SNVMissense_Mutationc.136G>Ap.Glu46Lysp.E46KQ13136protein_codingdeleterious(0)probably_damaging(0.994)TCGA-AC-A23H-01Breastbreast invasive carcinomaFemale>=65I/IIUnknownUnknownPD
PPFIA1SNVMissense_Mutationc.2240G>Cp.Arg747Thrp.R747TQ13136protein_codingdeleterious(0.02)possibly_damaging(0.703)TCGA-AC-A23H-01Breastbreast invasive carcinomaFemale>=65I/IIUnknownUnknownPD
PPFIA1SNVMissense_Mutationnovelc.2920N>Cp.Ser974Argp.S974RQ13136protein_codingdeleterious(0.01)possibly_damaging(0.905)TCGA-AO-A1KT-01Breastbreast invasive carcinomaFemale>=65I/IIChemotherapyfluorouracilSD
PPFIA1SNVMissense_Mutationc.2567N>Ap.Arg856Hisp.R856HQ13136protein_codingdeleterious(0.02)possibly_damaging(0.475)TCGA-AQ-A04H-01Breastbreast invasive carcinomaFemale<65III/IVChemotherapytaxotereSD
PPFIA1SNVMissense_Mutationnovelc.2071A>Gp.Ser691Glyp.S691GQ13136protein_codingtolerated(0.38)benign(0)TCGA-BH-A0HY-01Breastbreast invasive carcinomaFemale<65I/IIHormone TherapytaxotereCR
PPFIA1SNVMissense_Mutationc.2513N>Tp.Ser838Leup.S838LQ13136protein_codingtolerated(0.27)benign(0.013)TCGA-C8-A274-01Breastbreast invasive carcinomaFemale<65I/IIHormone TherapytamoxiphenSD
Page: 1 2 3 4 5 6 7 8 9 10 11 12 13 14 

Top

Related drugs of malignant transformation related genes

check buttonIdentification of chemicals and drugs interact with genes involved in malignant transfromation
(DGIdb 4.0)
Entrez IDSymbolCategoryInteraction TypesDrug Claim NameDrug NamePMIDs
Page: 1