| Tissue | Expression Dynamics | Abbreviation |
| Esophagus |  | ESCC: Esophageal squamous cell carcinoma |
| HGIN: High-grade intraepithelial neoplasias |
| LGIN: Low-grade intraepithelial neoplasias |
| GC | 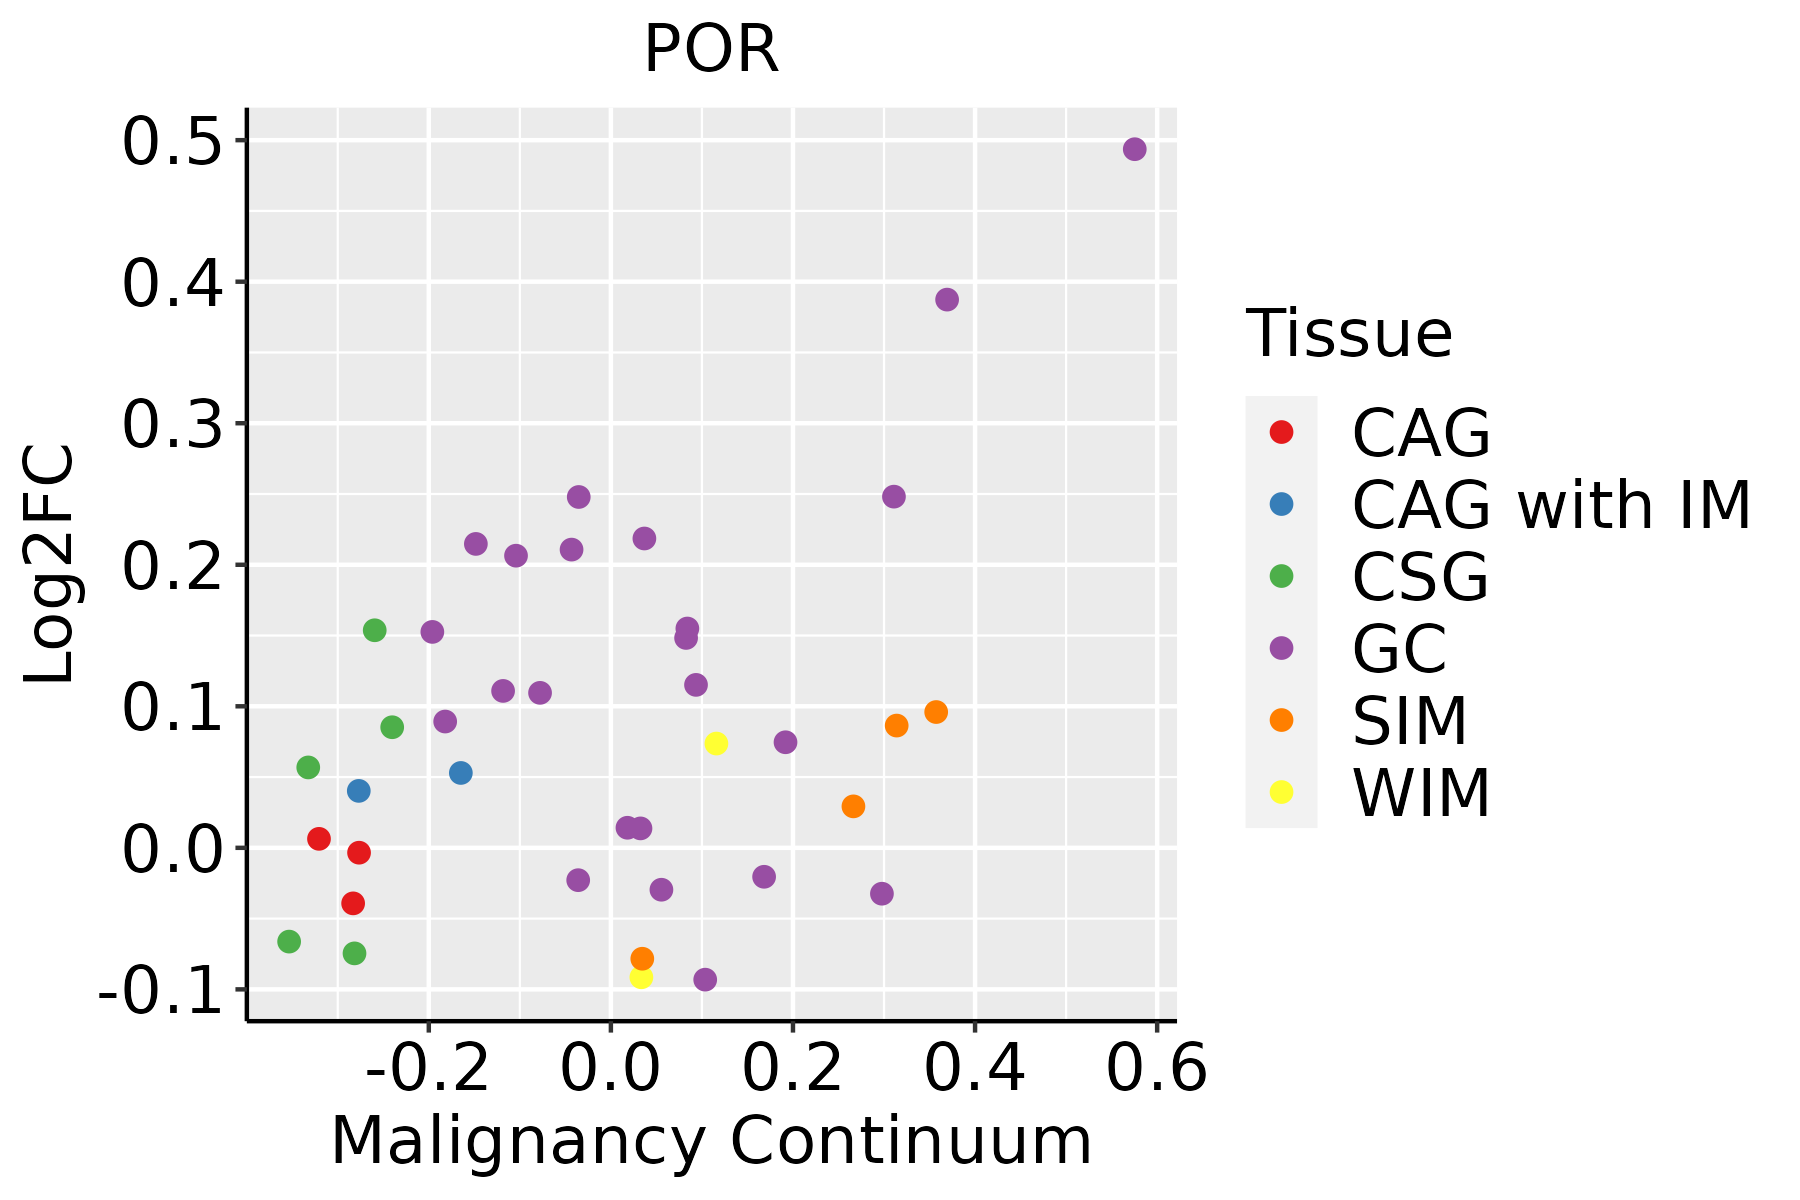 | CAG: Chronic atrophic gastritis |
| CAG with IM: Chronic atrophic gastritis with intestinal metaplasia |
| CSG: Chronic superficial gastritis |
| GC: Gastric cancer |
| SIM: Severe intestinal metaplasia |
| WIM: Wild intestinal metaplasia |
| Liver |  | HCC: Hepatocellular carcinoma |
| NAFLD: Non-alcoholic fatty liver disease |
| Oral Cavity |  | EOLP: Erosive Oral lichen planus |
| LP: leukoplakia |
| NEOLP: Non-erosive oral lichen planus |
| OSCC: Oral squamous cell carcinoma |
| Skin | 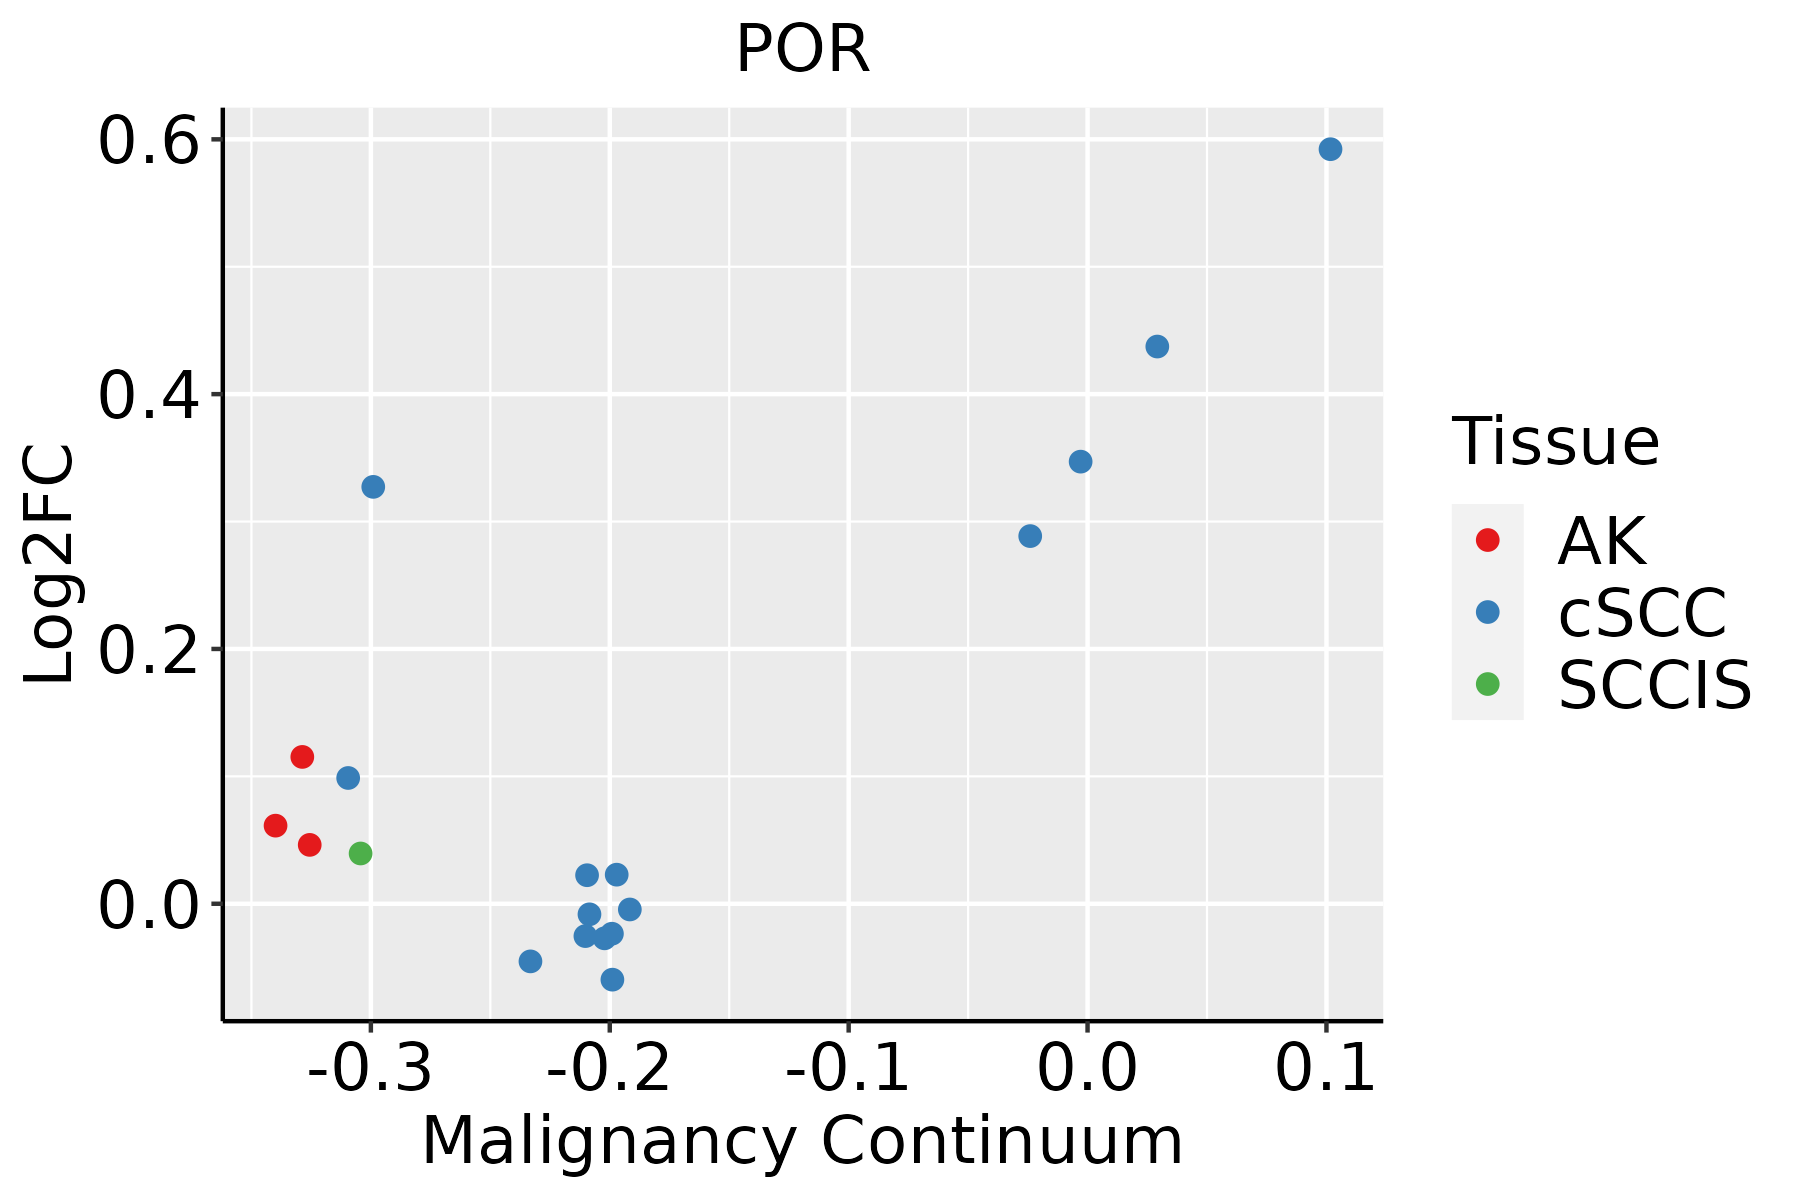 | AK: Actinic keratosis |
| cSCC: Cutaneous squamous cell carcinoma |
| SCCIS:squamous cell carcinoma in situ |
| Thyroid |  | ATC: Anaplastic thyroid cancer |
| HT: Hashimoto's thyroiditis |
| PTC: Papillary thyroid cancer |
| GO ID | Tissue | Disease Stage | Description | Gene Ratio | Bg Ratio | pvalue | p.adjust | Count |
| GO:200011626 | Esophagus | HGIN | regulation of cysteine-type endopeptidase activity | 63/2587 | 235/18723 | 9.71e-08 | 5.02e-06 | 63 |
| GO:004427018 | Esophagus | HGIN | cellular nitrogen compound catabolic process | 103/2587 | 451/18723 | 1.10e-07 | 5.56e-06 | 103 |
| GO:00182057 | Esophagus | HGIN | peptidyl-lysine modification | 88/2587 | 376/18723 | 2.99e-07 | 1.39e-05 | 88 |
| GO:005254726 | Esophagus | HGIN | regulation of peptidase activity | 102/2587 | 461/18723 | 6.29e-07 | 2.72e-05 | 102 |
| GO:005254826 | Esophagus | HGIN | regulation of endopeptidase activity | 96/2587 | 432/18723 | 1.09e-06 | 4.30e-05 | 96 |
| GO:00064735 | Esophagus | HGIN | protein acetylation | 45/2587 | 201/18723 | 6.17e-04 | 8.58e-03 | 45 |
| GO:00183945 | Esophagus | HGIN | peptidyl-lysine acetylation | 39/2587 | 169/18723 | 7.46e-04 | 9.90e-03 | 39 |
| GO:200011720 | Esophagus | HGIN | negative regulation of cysteine-type endopeptidase activity | 23/2587 | 86/18723 | 1.12e-03 | 1.37e-02 | 23 |
| GO:00435435 | Esophagus | HGIN | protein acylation | 51/2587 | 243/18723 | 1.33e-03 | 1.57e-02 | 51 |
| GO:003166726 | Esophagus | HGIN | response to nutrient levels | 89/2587 | 474/18723 | 1.41e-03 | 1.64e-02 | 89 |
| GO:004343420 | Esophagus | HGIN | response to peptide hormone | 79/2587 | 414/18723 | 1.60e-03 | 1.79e-02 | 79 |
| GO:004315419 | Esophagus | HGIN | negative regulation of cysteine-type endopeptidase activity involved in apoptotic process | 21/2587 | 78/18723 | 1.65e-03 | 1.82e-02 | 21 |
| GO:00064755 | Esophagus | HGIN | internal protein amino acid acetylation | 36/2587 | 160/18723 | 1.87e-03 | 2.01e-02 | 36 |
| GO:004586126 | Esophagus | HGIN | negative regulation of proteolysis | 68/2587 | 351/18723 | 2.21e-03 | 2.28e-02 | 68 |
| GO:005134620 | Esophagus | HGIN | negative regulation of hydrolase activity | 72/2587 | 379/18723 | 2.81e-03 | 2.75e-02 | 72 |
| GO:00183935 | Esophagus | HGIN | internal peptidyl-lysine acetylation | 35/2587 | 158/18723 | 2.82e-03 | 2.75e-02 | 35 |
| GO:190165318 | Esophagus | HGIN | cellular response to peptide | 68/2587 | 359/18723 | 3.88e-03 | 3.54e-02 | 68 |
| GO:0010498111 | Esophagus | ESCC | proteasomal protein catabolic process | 369/8552 | 490/18723 | 1.13e-41 | 1.80e-38 | 369 |
| GO:0043161111 | Esophagus | ESCC | proteasome-mediated ubiquitin-dependent protein catabolic process | 312/8552 | 412/18723 | 3.53e-36 | 4.48e-33 | 312 |
| GO:0097193111 | Esophagus | ESCC | intrinsic apoptotic signaling pathway | 222/8552 | 288/18723 | 5.87e-28 | 2.02e-25 | 222 |
| Hugo Symbol | Variant Class | Variant Classification | dbSNP RS | HGVSc | HGVSp | HGVSp Short | SWISSPROT | BIOTYPE | SIFT | PolyPhen | Tumor Sample Barcode | Tissue | Histology | Sex | Age | Stage | Therapy Types | Drugs | Outcome |
| POR | SNV | Missense_Mutation | | c.1987G>A | p.Asp663Asn | p.D663N | P16435 | protein_coding | tolerated(0.23) | benign(0.009) | TCGA-A2-A0CL-01 | Breast | breast invasive carcinoma | Female | <65 | III/IV | Chemotherapy | cytoxan | SD |
| POR | SNV | Missense_Mutation | rs781866008 | c.838N>A | p.Asp280Asn | p.D280N | P16435 | protein_coding | deleterious(0.03) | benign(0.41) | TCGA-AN-A0FS-01 | Breast | breast invasive carcinoma | Female | <65 | I/II | Unknown | Unknown | SD |
| POR | SNV | Missense_Mutation | rs782053091 | c.709N>A | p.Glu237Lys | p.E237K | P16435 | protein_coding | deleterious(0.05) | benign(0.182) | TCGA-BH-A0AU-01 | Breast | breast invasive carcinoma | Female | <65 | I/II | Unknown | Unknown | SD |
| POR | SNV | Missense_Mutation | novel | c.893N>A | p.Gly298Glu | p.G298E | P16435 | protein_coding | deleterious(0.01) | benign(0.376) | TCGA-GM-A3NY-01 | Breast | breast invasive carcinoma | Female | >=65 | I/II | Hormone Therapy | arimidex | SD |
| POR | insertion | Frame_Shift_Ins | novel | c.937_938insG | p.Ser313CysfsTer6 | p.S313Cfs*6 | P16435 | protein_coding | | | TCGA-A8-A0A4-01 | Breast | breast invasive carcinoma | Female | >=65 | I/II | Hormone Therapy | tamoxiphen | CR |
| POR | insertion | Nonsense_Mutation | novel | c.938_939insTTGAACCTGGGAGG | p.Lys314Ter | p.K314* | P16435 | protein_coding | | | TCGA-A8-A0A4-01 | Breast | breast invasive carcinoma | Female | >=65 | I/II | Hormone Therapy | tamoxiphen | CR |
| POR | deletion | Frame_Shift_Del | novel | c.1514_1524delAGAACGGCGGC | p.Glu505AlafsTer66 | p.E505Afs*66 | P16435 | protein_coding | | | TCGA-AC-A8OQ-01 | Breast | breast invasive carcinoma | Female | >=65 | I/II | Unknown | Unknown | SD |
| POR | deletion | In_Frame_Del | | c.443_445delNNN | p.Thr149del | p.T149del | P16435 | protein_coding | | | TCGA-C8-A1HM-01 | Breast | breast invasive carcinoma | Female | >=65 | I/II | Chemotherapy | doxorubicin | CR |
| POR | SNV | Missense_Mutation | rs367782552 | c.773C>T | p.Ala258Val | p.A258V | P16435 | protein_coding | tolerated(0.29) | benign(0) | TCGA-2W-A8YY-01 | Cervix | cervical & endocervical cancer | Female | <65 | I/II | Chemotherapy | cisplatin | CR |
| POR | SNV | Missense_Mutation | novel | c.1897N>T | p.Gly633Trp | p.G633W | P16435 | protein_coding | deleterious(0) | probably_damaging(1) | TCGA-VS-A9U6-01 | Cervix | cervical & endocervical cancer | Female | <65 | I/II | Chemotherapy | cisplatin | PD |
| Entrez ID | Symbol | Category | Interaction Types | Drug Claim Name | Drug Name | PMIDs |
| 5447 | POR | ENZYME, DRUGGABLE GENOME | | sirolimus | SIROLIMUS | 23974086 |
| 5447 | POR | ENZYME, DRUGGABLE GENOME | | midazolam | MIDAZOLAM | 23324807,19801957 |
| 5447 | POR | ENZYME, DRUGGABLE GENOME | | cyclosporine | CYCLOSPORINE | 29135906,24658827,24061445 |
| 5447 | POR | ENZYME, DRUGGABLE GENOME | | zidovudine | ZIDOVUDINE | 22960662 |
| 5447 | POR | ENZYME, DRUGGABLE GENOME | | atorvastatin | ATORVASTATIN | 25521355 |
| 5447 | POR | ENZYME, DRUGGABLE GENOME | | nicotine | NICOTINE | |
| 5447 | POR | ENZYME, DRUGGABLE GENOME | | tacrolimus | TACROLIMUS | 23097010,25322286,26829596,30323313,24113216,26227094,21770725,24921414,24739669,25271728,24061445,28094348,29878980,29399716 |
| 5447 | POR | ENZYME, DRUGGABLE GENOME | | sunitinib | SUNITINIB | 28117434 |


