
|
|||||
|
 | |
| |
| |
| |
| |
| |
|
Gene: POLR2D |
Gene summary for POLR2D |
| Gene information | Species | Human | Gene symbol | POLR2D | Gene ID | 5433 |
| Gene name | RNA polymerase II subunit D | |
| Gene Alias | HSRBP4 | |
| Cytomap | 2q14.3 | |
| Gene Type | protein-coding | GO ID | GO:0000288 | UniProtAcc | A0A024RAJ4 |
Top |
Malignant transformation analysis |
| Identification of the aberrant gene expression in precancerous and cancerous lesions by comparing the gene expression of stem-like cells in diseased tissues with normal stem cells |
| Entrez ID | Symbol | Replicates | Species | Organ | Tissue | Adj P-value | Log2FC | Malignancy |
| 5433 | POLR2D | LZE2T | Human | Esophagus | ESCC | 4.13e-05 | 6.99e-01 | 0.082 |
| 5433 | POLR2D | LZE4T | Human | Esophagus | ESCC | 9.08e-17 | 3.51e-01 | 0.0811 |
| 5433 | POLR2D | LZE5T | Human | Esophagus | ESCC | 1.79e-02 | 2.42e-01 | 0.0514 |
| 5433 | POLR2D | LZE7T | Human | Esophagus | ESCC | 9.71e-12 | 7.24e-01 | 0.0667 |
| 5433 | POLR2D | LZE8T | Human | Esophagus | ESCC | 1.05e-07 | 2.37e-01 | 0.067 |
| 5433 | POLR2D | LZE20T | Human | Esophagus | ESCC | 1.13e-04 | 2.43e-01 | 0.0662 |
| 5433 | POLR2D | LZE22D1 | Human | Esophagus | HGIN | 3.67e-03 | 1.62e-01 | 0.0595 |
| 5433 | POLR2D | LZE22T | Human | Esophagus | ESCC | 1.43e-10 | 5.24e-01 | 0.068 |
| 5433 | POLR2D | LZE24T | Human | Esophagus | ESCC | 2.82e-15 | 3.77e-01 | 0.0596 |
| 5433 | POLR2D | LZE21T | Human | Esophagus | ESCC | 1.54e-02 | 3.06e-01 | 0.0655 |
| 5433 | POLR2D | LZE6T | Human | Esophagus | ESCC | 2.02e-03 | 2.28e-01 | 0.0845 |
| 5433 | POLR2D | P1T-E | Human | Esophagus | ESCC | 4.43e-06 | 2.75e-01 | 0.0875 |
| 5433 | POLR2D | P2T-E | Human | Esophagus | ESCC | 4.24e-24 | 5.17e-01 | 0.1177 |
| 5433 | POLR2D | P4T-E | Human | Esophagus | ESCC | 1.31e-26 | 6.76e-01 | 0.1323 |
| 5433 | POLR2D | P5T-E | Human | Esophagus | ESCC | 1.38e-13 | 3.97e-01 | 0.1327 |
| 5433 | POLR2D | P8T-E | Human | Esophagus | ESCC | 1.06e-14 | 2.87e-01 | 0.0889 |
| 5433 | POLR2D | P9T-E | Human | Esophagus | ESCC | 8.63e-08 | 2.33e-01 | 0.1131 |
| 5433 | POLR2D | P10T-E | Human | Esophagus | ESCC | 7.54e-34 | 6.76e-01 | 0.116 |
| 5433 | POLR2D | P11T-E | Human | Esophagus | ESCC | 8.79e-13 | 6.57e-01 | 0.1426 |
| 5433 | POLR2D | P12T-E | Human | Esophagus | ESCC | 1.19e-27 | 6.33e-01 | 0.1122 |
| Page: 1 2 3 4 5 6 |
| Tissue | Expression Dynamics | Abbreviation |
| Esophagus |  | ESCC: Esophageal squamous cell carcinoma |
| HGIN: High-grade intraepithelial neoplasias | ||
| LGIN: Low-grade intraepithelial neoplasias | ||
| Liver |  | HCC: Hepatocellular carcinoma |
| NAFLD: Non-alcoholic fatty liver disease | ||
| Oral Cavity | 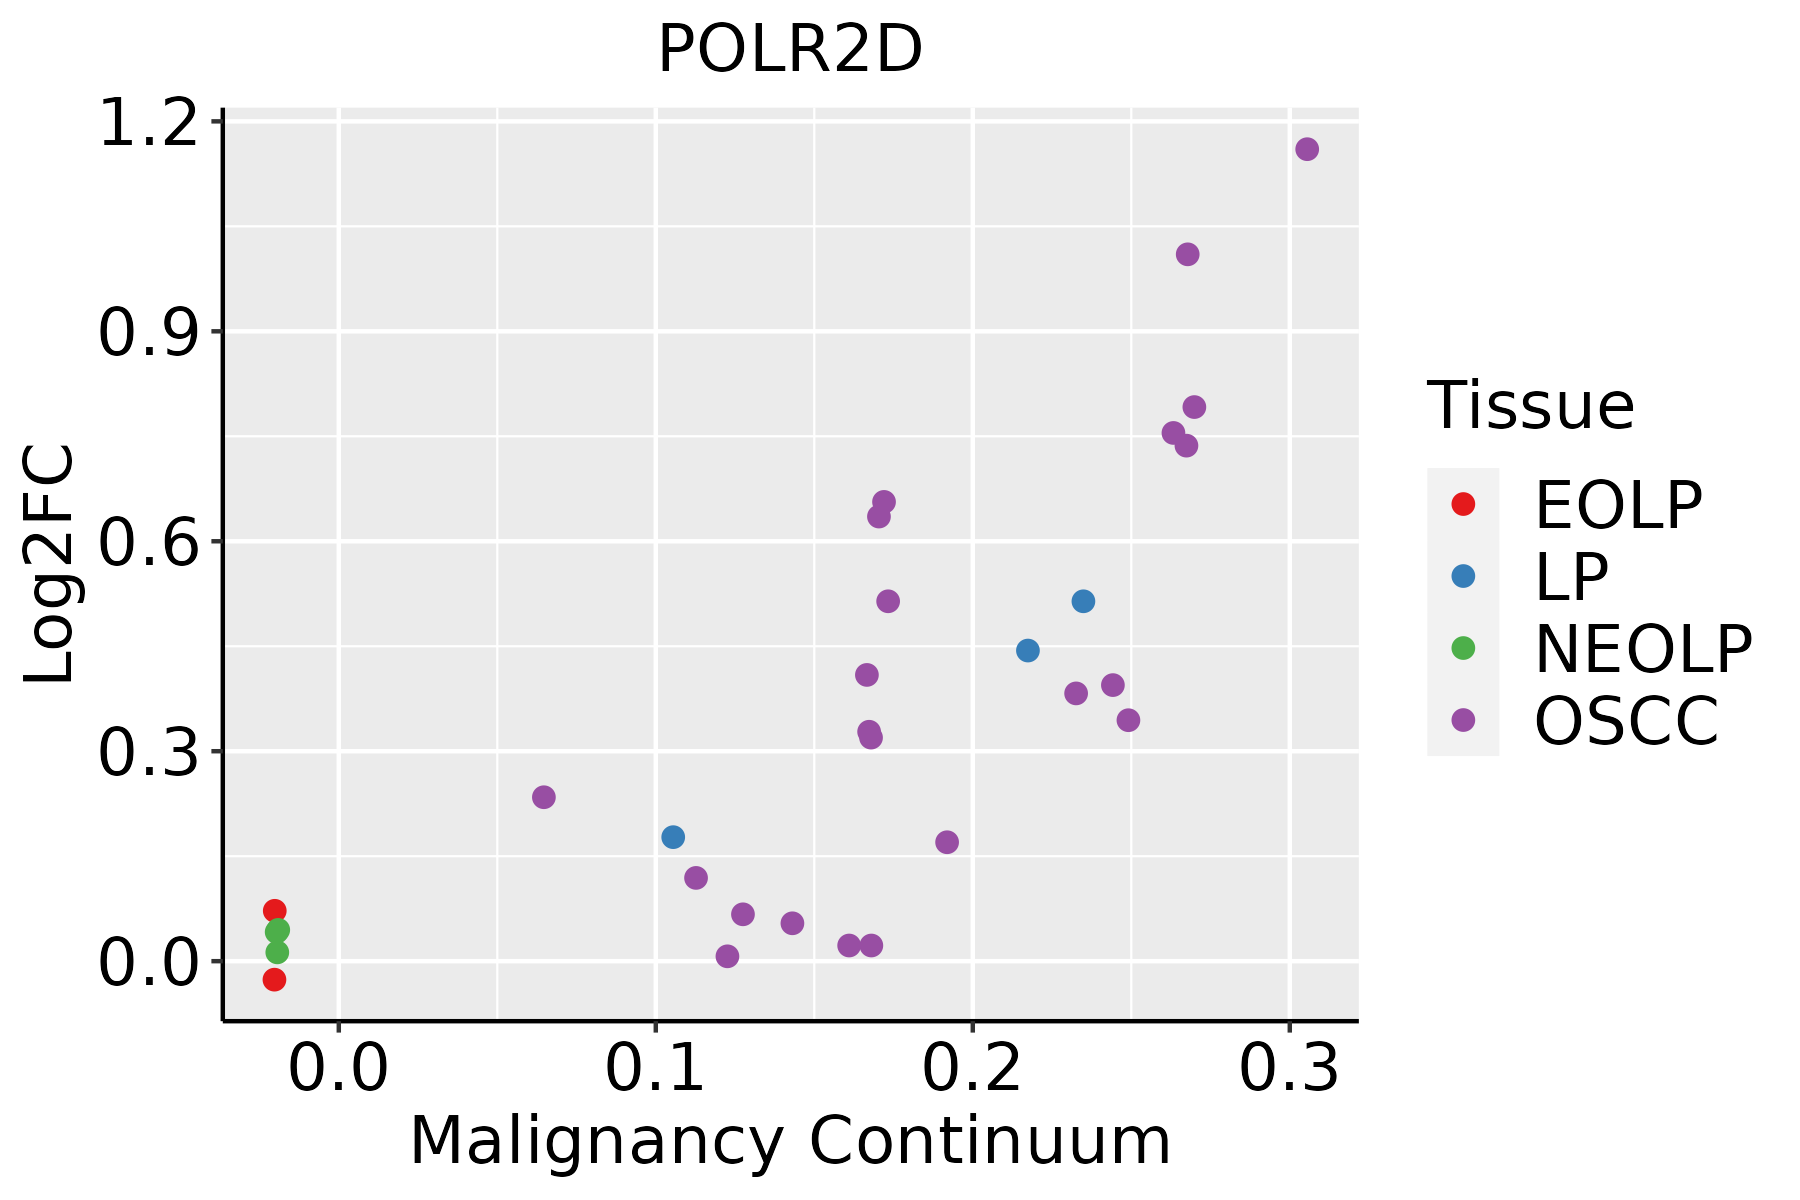 | EOLP: Erosive Oral lichen planus |
| LP: leukoplakia | ||
| NEOLP: Non-erosive oral lichen planus | ||
| OSCC: Oral squamous cell carcinoma | ||
| Skin | 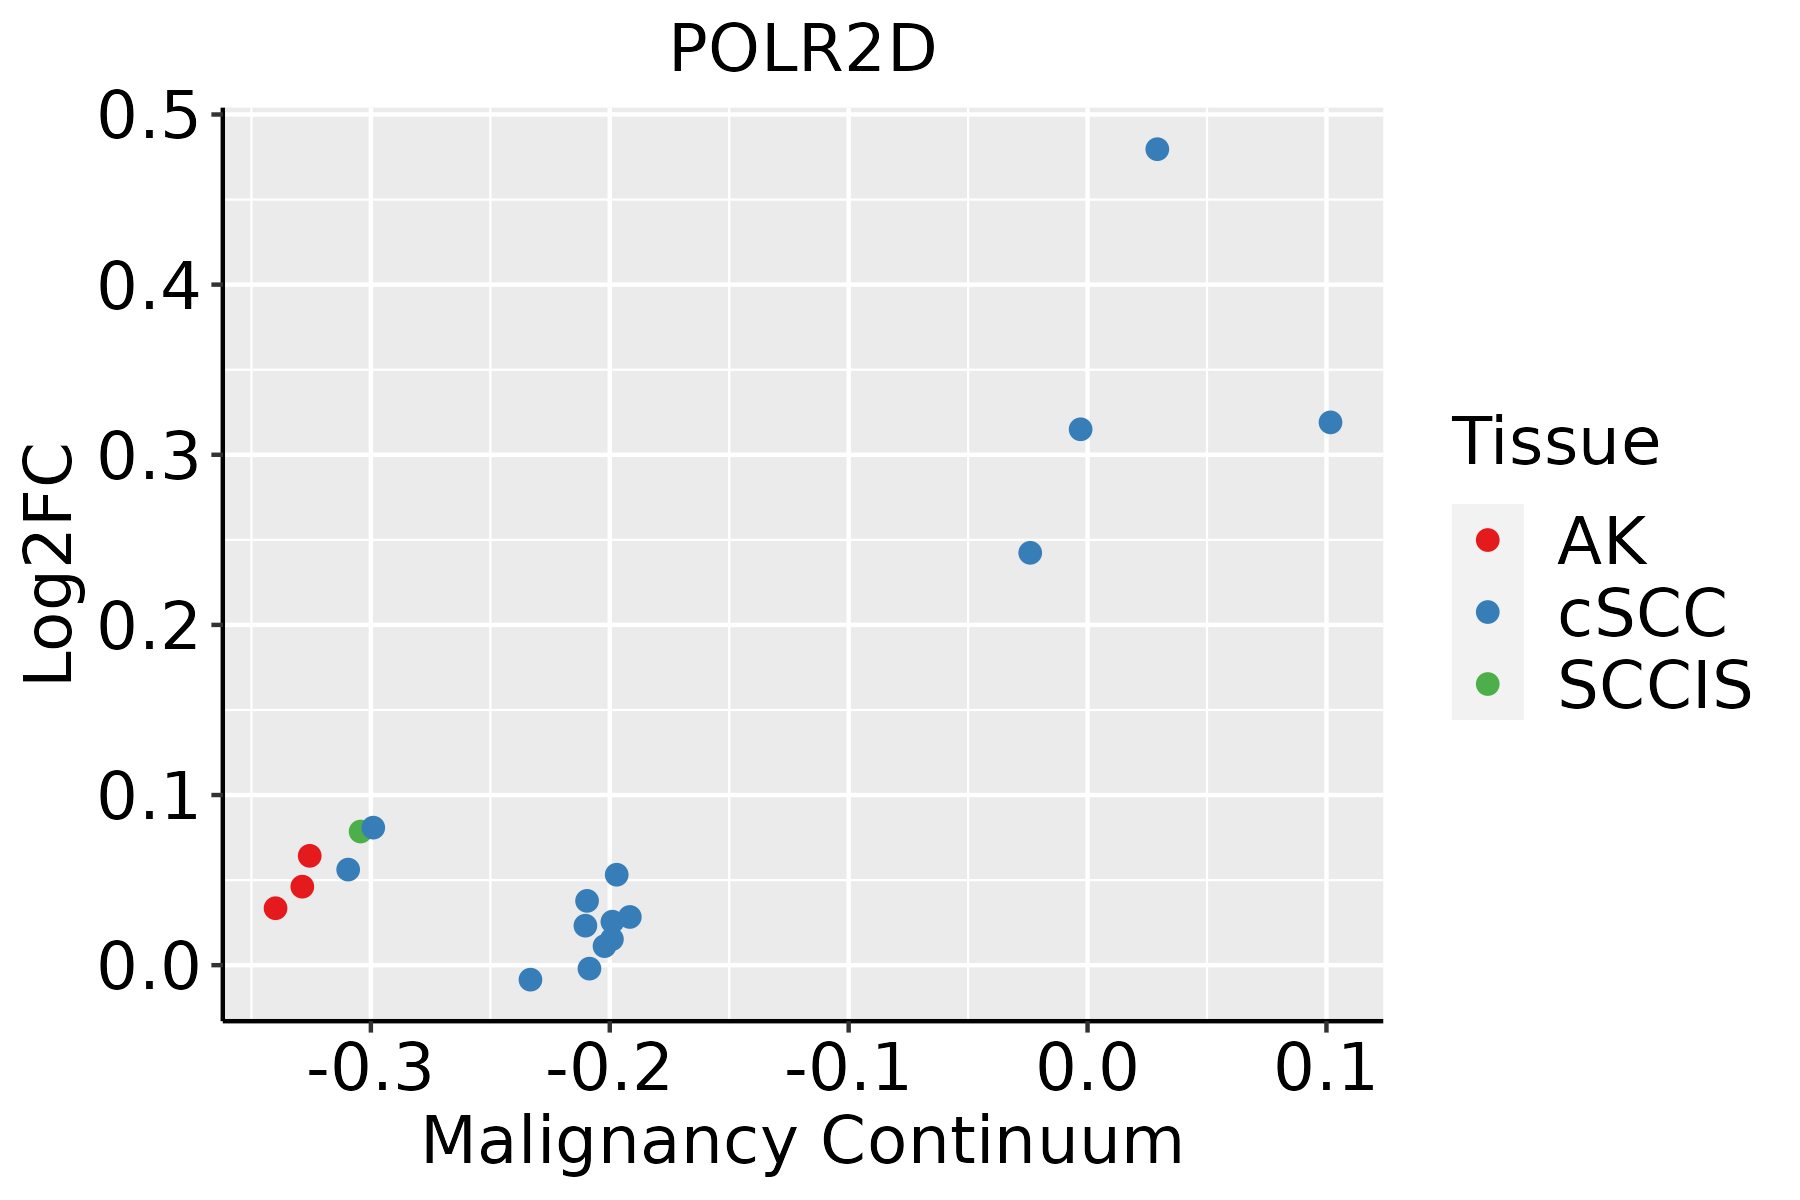 | AK: Actinic keratosis |
| cSCC: Cutaneous squamous cell carcinoma | ||
| SCCIS:squamous cell carcinoma in situ | ||
| Thyroid | 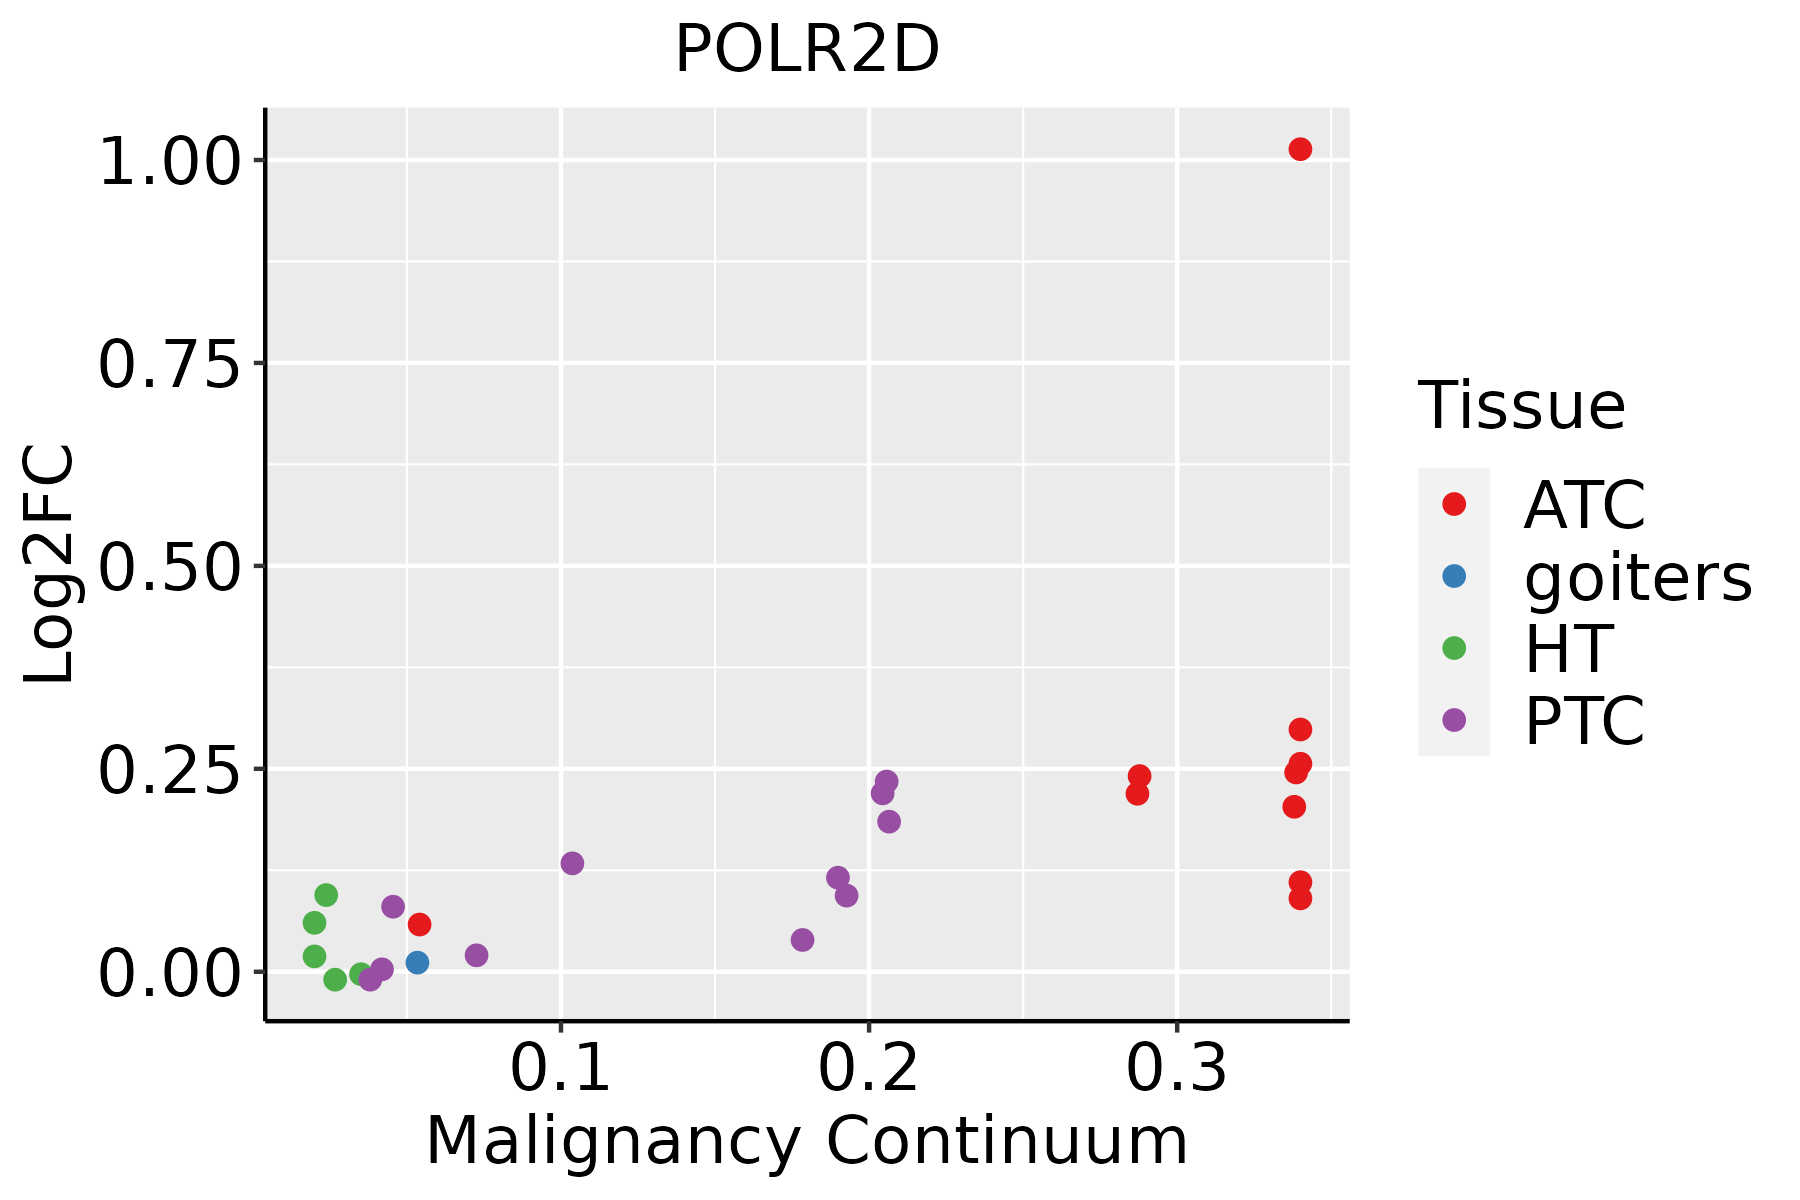 | ATC: Anaplastic thyroid cancer |
| HT: Hashimoto's thyroiditis | ||
| PTC: Papillary thyroid cancer |
| ∗log2FC in expression of this searched gene in stem-like cells from each diseased tissue sample relative to stem-like cells in normal samples in each tissue plotted against the malignancy continuum. Samples are colored based on if they are from different disease stage. |
Top |
Malignant transformation related pathway analysis |
| Find out the enriched GO biological processes and KEGG pathways involved in transition from healthy to precancer to cancer |
| Tissue | Disease Stage | Enriched GO biological Processes |
| Colorectum | AD |  |
| Colorectum | SER |  |
| Colorectum | MSS |  |
| Colorectum | MSI-H |  |
| Colorectum | FAP |  |
| ∗Top 15 enriched GO BP terms are showed in the bar plot of each disease state in each tissue. Each row represents a significant GO biological process which is colored according to the -log10(p.adjust). |
| Page: 1 2 3 4 5 6 7 8 9 |
| GO ID | Tissue | Disease Stage | Description | Gene Ratio | Bg Ratio | pvalue | p.adjust | Count |
| GO:00342495 | Oral cavity | OSCC | negative regulation of cellular amide metabolic process | 130/7305 | 273/18723 | 2.20e-03 | 1.00e-02 | 130 |
| GO:00171485 | Oral cavity | OSCC | negative regulation of translation | 113/7305 | 245/18723 | 1.34e-02 | 4.45e-02 | 113 |
| GO:002261329 | Skin | cSCC | ribonucleoprotein complex biogenesis | 302/4864 | 463/18723 | 5.13e-72 | 3.22e-68 | 302 |
| GO:007182629 | Skin | cSCC | ribonucleoprotein complex subunit organization | 140/4864 | 227/18723 | 5.54e-30 | 3.16e-27 | 140 |
| GO:002261829 | Skin | cSCC | ribonucleoprotein complex assembly | 136/4864 | 220/18723 | 2.60e-29 | 1.25e-26 | 136 |
| GO:190331126 | Skin | cSCC | regulation of mRNA metabolic process | 162/4864 | 288/18723 | 5.90e-28 | 2.46e-25 | 162 |
| GO:000641729 | Skin | cSCC | regulation of translation | 226/4864 | 468/18723 | 8.78e-26 | 2.62e-23 | 226 |
| GO:000691324 | Skin | cSCC | nucleocytoplasmic transport | 162/4864 | 301/18723 | 4.20e-25 | 1.10e-22 | 162 |
| GO:005116924 | Skin | cSCC | nuclear transport | 162/4864 | 301/18723 | 4.20e-25 | 1.10e-22 | 162 |
| GO:0006413111 | Skin | cSCC | translational initiation | 84/4864 | 118/18723 | 9.12e-25 | 2.29e-22 | 84 |
| GO:0006403111 | Skin | cSCC | RNA localization | 120/4864 | 201/18723 | 4.17e-24 | 1.01e-21 | 120 |
| GO:0051168111 | Skin | cSCC | nuclear export | 91/4864 | 154/18723 | 3.33e-18 | 4.18e-16 | 91 |
| GO:005065719 | Skin | cSCC | nucleic acid transport | 92/4864 | 163/18723 | 1.35e-16 | 1.33e-14 | 92 |
| GO:005065819 | Skin | cSCC | RNA transport | 92/4864 | 163/18723 | 1.35e-16 | 1.33e-14 | 92 |
| GO:005123619 | Skin | cSCC | establishment of RNA localization | 93/4864 | 166/18723 | 1.78e-16 | 1.69e-14 | 93 |
| GO:005102816 | Skin | cSCC | mRNA transport | 77/4864 | 130/18723 | 1.06e-15 | 8.95e-14 | 77 |
| GO:0045727112 | Skin | cSCC | positive regulation of translation | 79/4864 | 136/18723 | 2.09e-15 | 1.75e-13 | 79 |
| GO:0006401111 | Skin | cSCC | RNA catabolic process | 133/4864 | 278/18723 | 2.71e-15 | 2.23e-13 | 133 |
| GO:000644619 | Skin | cSCC | regulation of translational initiation | 54/4864 | 79/18723 | 3.38e-15 | 2.72e-13 | 54 |
| GO:003425026 | Skin | cSCC | positive regulation of cellular amide metabolic process | 89/4864 | 162/18723 | 3.95e-15 | 3.06e-13 | 89 |
| Page: 1 2 3 4 5 6 7 8 9 10 11 12 13 14 15 16 17 18 |
| Pathway ID | Tissue | Disease Stage | Description | Gene Ratio | Bg Ratio | pvalue | p.adjust | qvalue | Count |
| hsa0501630 | Esophagus | HGIN | Huntington disease | 129/1383 | 306/8465 | 6.81e-28 | 7.41e-26 | 5.88e-26 | 129 |
| hsa034205 | Esophagus | HGIN | Nucleotide excision repair | 29/1383 | 63/8465 | 2.96e-08 | 5.36e-07 | 4.26e-07 | 29 |
| hsa030205 | Esophagus | HGIN | RNA polymerase | 12/1383 | 34/8465 | 5.62e-03 | 3.99e-02 | 3.17e-02 | 12 |
| hsa05016113 | Esophagus | HGIN | Huntington disease | 129/1383 | 306/8465 | 6.81e-28 | 7.41e-26 | 5.88e-26 | 129 |
| hsa0342012 | Esophagus | HGIN | Nucleotide excision repair | 29/1383 | 63/8465 | 2.96e-08 | 5.36e-07 | 4.26e-07 | 29 |
| hsa0302012 | Esophagus | HGIN | RNA polymerase | 12/1383 | 34/8465 | 5.62e-03 | 3.99e-02 | 3.17e-02 | 12 |
| hsa05016210 | Esophagus | ESCC | Huntington disease | 226/4205 | 306/8465 | 1.38e-18 | 8.72e-17 | 4.46e-17 | 226 |
| hsa0342022 | Esophagus | ESCC | Nucleotide excision repair | 54/4205 | 63/8465 | 2.01e-09 | 2.17e-08 | 1.11e-08 | 54 |
| hsa0302021 | Esophagus | ESCC | RNA polymerase | 28/4205 | 34/8465 | 8.19e-05 | 3.35e-04 | 1.71e-04 | 28 |
| hsa0501638 | Esophagus | ESCC | Huntington disease | 226/4205 | 306/8465 | 1.38e-18 | 8.72e-17 | 4.46e-17 | 226 |
| hsa0342032 | Esophagus | ESCC | Nucleotide excision repair | 54/4205 | 63/8465 | 2.01e-09 | 2.17e-08 | 1.11e-08 | 54 |
| hsa0302031 | Esophagus | ESCC | RNA polymerase | 28/4205 | 34/8465 | 8.19e-05 | 3.35e-04 | 1.71e-04 | 28 |
| hsa0501622 | Liver | HCC | Huntington disease | 219/4020 | 306/8465 | 3.06e-18 | 3.42e-16 | 1.90e-16 | 219 |
| hsa034202 | Liver | HCC | Nucleotide excision repair | 41/4020 | 63/8465 | 3.59e-03 | 1.12e-02 | 6.22e-03 | 41 |
| hsa03020 | Liver | HCC | RNA polymerase | 24/4020 | 34/8465 | 5.40e-03 | 1.57e-02 | 8.75e-03 | 24 |
| hsa0501632 | Liver | HCC | Huntington disease | 219/4020 | 306/8465 | 3.06e-18 | 3.42e-16 | 1.90e-16 | 219 |
| hsa034203 | Liver | HCC | Nucleotide excision repair | 41/4020 | 63/8465 | 3.59e-03 | 1.12e-02 | 6.22e-03 | 41 |
| hsa030201 | Liver | HCC | RNA polymerase | 24/4020 | 34/8465 | 5.40e-03 | 1.57e-02 | 8.75e-03 | 24 |
| hsa0501628 | Oral cavity | OSCC | Huntington disease | 204/3704 | 306/8465 | 1.70e-16 | 7.13e-15 | 3.63e-15 | 204 |
| hsa034204 | Oral cavity | OSCC | Nucleotide excision repair | 49/3704 | 63/8465 | 3.48e-08 | 2.91e-07 | 1.48e-07 | 49 |
| Page: 1 2 |
Top |
Cell-cell communication analysis |
| Identification of potential cell-cell interactions between two cell types and their ligand-receptor pairs for different disease states |
| Ligand | Receptor | LRpair | Pathway | Tissue | Disease Stage |
| Page: 1 |
Top |
Single-cell gene regulatory network inference analysis |
| Find out the significant the regulons (TFs) and the target genes of each regulon across cell types for different disease states |
| TF | Cell Type | Tissue | Disease Stage | Target Gene | RSS | Regulon Activity |
| ∗The dot plots of a searched regulon are shown for all cell subpopulations in each disease state of each tissue based on the regulon specific score inferred using pySCENIC and by calculating the average expression. |
| Page: 1 |
Top |
Somatic mutation of malignant transformation related genes |
| Annotation of somatic variants for genes involved in malignant transformation |
| Hugo Symbol | Variant Class | Variant Classification | dbSNP RS | HGVSc | HGVSp | HGVSp Short | SWISSPROT | BIOTYPE | SIFT | PolyPhen | Tumor Sample Barcode | Tissue | Histology | Sex | Age | Stage | Therapy Types | Drugs | Outcome |
| POLR2D | SNV | Missense_Mutation | c.361N>T | p.Arg121Trp | p.R121W | O15514 | protein_coding | deleterious(0) | probably_damaging(0.993) | TCGA-AD-6889-01 | Colorectum | colon adenocarcinoma | Male | >=65 | I/II | Chemotherapy | xeloda | PD | |
| POLR2D | SNV | Missense_Mutation | novel | c.272A>G | p.Lys91Arg | p.K91R | O15514 | protein_coding | tolerated(0.16) | benign(0.03) | TCGA-CM-6171-01 | Colorectum | colon adenocarcinoma | Female | >=65 | I/II | Unknown | Unknown | SD |
| POLR2D | SNV | Missense_Mutation | novel | c.274N>T | p.Leu92Phe | p.L92F | O15514 | protein_coding | tolerated(0.13) | possibly_damaging(0.64) | TCGA-A5-A0G2-01 | Endometrium | uterine corpus endometrioid carcinoma | Female | <65 | III/IV | Unknown | Unknown | SD |
| POLR2D | SNV | Missense_Mutation | novel | c.413N>A | p.Arg138His | p.R138H | O15514 | protein_coding | deleterious(0.01) | probably_damaging(0.991) | TCGA-AX-A1CE-01 | Endometrium | uterine corpus endometrioid carcinoma | Female | <65 | I/II | Unspecific | Paclitaxel | SD |
| POLR2D | SNV | Missense_Mutation | c.245G>A | p.Ser82Asn | p.S82N | O15514 | protein_coding | tolerated(0.16) | benign(0.003) | TCGA-D1-A15X-01 | Endometrium | uterine corpus endometrioid carcinoma | Female | <65 | I/II | Unknown | Unknown | SD | |
| POLR2D | SNV | Missense_Mutation | c.325N>A | p.Glu109Lys | p.E109K | O15514 | protein_coding | deleterious(0) | benign(0.195) | TCGA-38-4625-01 | Lung | lung adenocarcinoma | Female | >=65 | I/II | Unknown | Unknown | SD | |
| POLR2D | SNV | Missense_Mutation | novel | c.145N>C | p.Glu49Gln | p.E49Q | O15514 | protein_coding | tolerated(0.21) | possibly_damaging(0.796) | TCGA-CN-4723-01 | Oral cavity | head & neck squamous cell carcinoma | Male | >=65 | I/II | Unknown | Unknown | SD |
| POLR2D | SNV | Missense_Mutation | novel | c.413N>A | p.Arg138His | p.R138H | O15514 | protein_coding | deleterious(0.01) | probably_damaging(0.991) | TCGA-VQ-A924-01 | Stomach | stomach adenocarcinoma | Male | >=65 | I/II | Unknown | Unknown | PD |
| POLR2D | insertion | Frame_Shift_Ins | novel | c.97_98insCTAACATTATTTTACT | p.Leu33ProfsTer22 | p.L33Pfs*22 | O15514 | protein_coding | TCGA-FY-A4B0-01 | Thyroid | thyroid carcinoma | Male | >=65 | I/II | Hormone Therapy | synthroid | SD |
| Page: 1 |
Top |
Related drugs of malignant transformation related genes |
| Identification of chemicals and drugs interact with genes involved in malignant transfromation |
| (DGIdb 4.0) |
| Entrez ID | Symbol | Category | Interaction Types | Drug Claim Name | Drug Name | PMIDs |
| Page: 1 |

Copyright 2023-Present -The University of Texas Health Science Center at Houston |