Schematic overview of the cellular and molecular mechanisms involved in the cancer progression, including the proposed cellular and molecular mechanisms in cancer cells trajectory. AT1: alveolar type 1 cells; AT2: alveolar type 2 cells; AAH: atypical adenomatous hyperplasia; AIS: adenocarcinoma in situ; MIA: minimally invasive adenocarcinoma; IA: invasive adenocarcinoma; EMT: epithelial-mesenchymal transition

Home

Download

Statistics

Help

Contact

Center for Computational Systems Medicine
leaf

Gene summary

leaf

Malignant transformation analysis

leaf

Malignant transformation related pathway analysis

leaf

Cell-cell communication analysis

leaf

Single-cell gene regulatory network inference analysis

leaf

Somatic mutation of malignant transformation related genes

leaf

Related drugs of malignant transformation related genes

Gene: NIN

Gene summary for NIN

check button Gene summary.

Gene informationSpeciesHuman
Gene symbol

NIN

Gene ID

51199

Gene nameninein
Gene AliasSCKL7
Cytomap14q22.1
Gene Typeprotein-coding
GO ID

GO:0000226

UniProtAcc

Q8N4C6


Top

Malignant transformation analysis

check button Identification of the aberrant gene expression in precancerous and cancerous lesions by comparing the gene expression of stem-like cells in diseased tissues with normal stem cells
check button Malignant transformation involving gene list.
Entrez IDSymbolReplicatesSpeciesOrganTissueAdj P-valueLog2FCMalignancy
51199NINLZE2THumanEsophagusESCC7.18e-044.14e-010.082
51199NINLZE4THumanEsophagusESCC1.59e-031.20e-010.0811
51199NINLZE7THumanEsophagusESCC1.44e-033.47e-010.0667
51199NINLZE22THumanEsophagusESCC2.04e-054.38e-010.068
51199NINLZE24THumanEsophagusESCC1.93e-092.07e-010.0596
51199NINP2T-EHumanEsophagusESCC3.68e-244.44e-010.1177
51199NINP4T-EHumanEsophagusESCC3.45e-143.17e-010.1323
51199NINP5T-EHumanEsophagusESCC1.54e-036.16e-020.1327
51199NINP8T-EHumanEsophagusESCC7.78e-101.61e-010.0889
51199NINP9T-EHumanEsophagusESCC1.63e-112.86e-010.1131
51199NINP10T-EHumanEsophagusESCC1.03e-255.06e-010.116
51199NINP11T-EHumanEsophagusESCC1.06e-052.84e-010.1426
51199NINP12T-EHumanEsophagusESCC3.79e-184.20e-010.1122
51199NINP15T-EHumanEsophagusESCC4.67e-296.14e-010.1149
51199NINP16T-EHumanEsophagusESCC2.73e-255.32e-010.1153
51199NINP17T-EHumanEsophagusESCC1.15e-082.92e-010.1278
51199NINP19T-EHumanEsophagusESCC3.03e-053.53e-010.1662
51199NINP20T-EHumanEsophagusESCC5.88e-123.06e-010.1124
51199NINP21T-EHumanEsophagusESCC7.53e-132.98e-010.1617
51199NINP22T-EHumanEsophagusESCC9.31e-172.98e-010.1236
Page: 1 2 3 4 5 6 

check button Transcriptomic changes along malignancy continuum.
TissueExpression DynamicsAbbreviation
EsophagusThe image shows the transcriptomic changes along malignancy continuum.log2FC in expression of this searched gene in stem-like cells from each diseased tissue sample relative to stem-like cells in normal samples in each tissue plotted against the malignancy continuum. Samples are colored based on if they are from different disease stage.
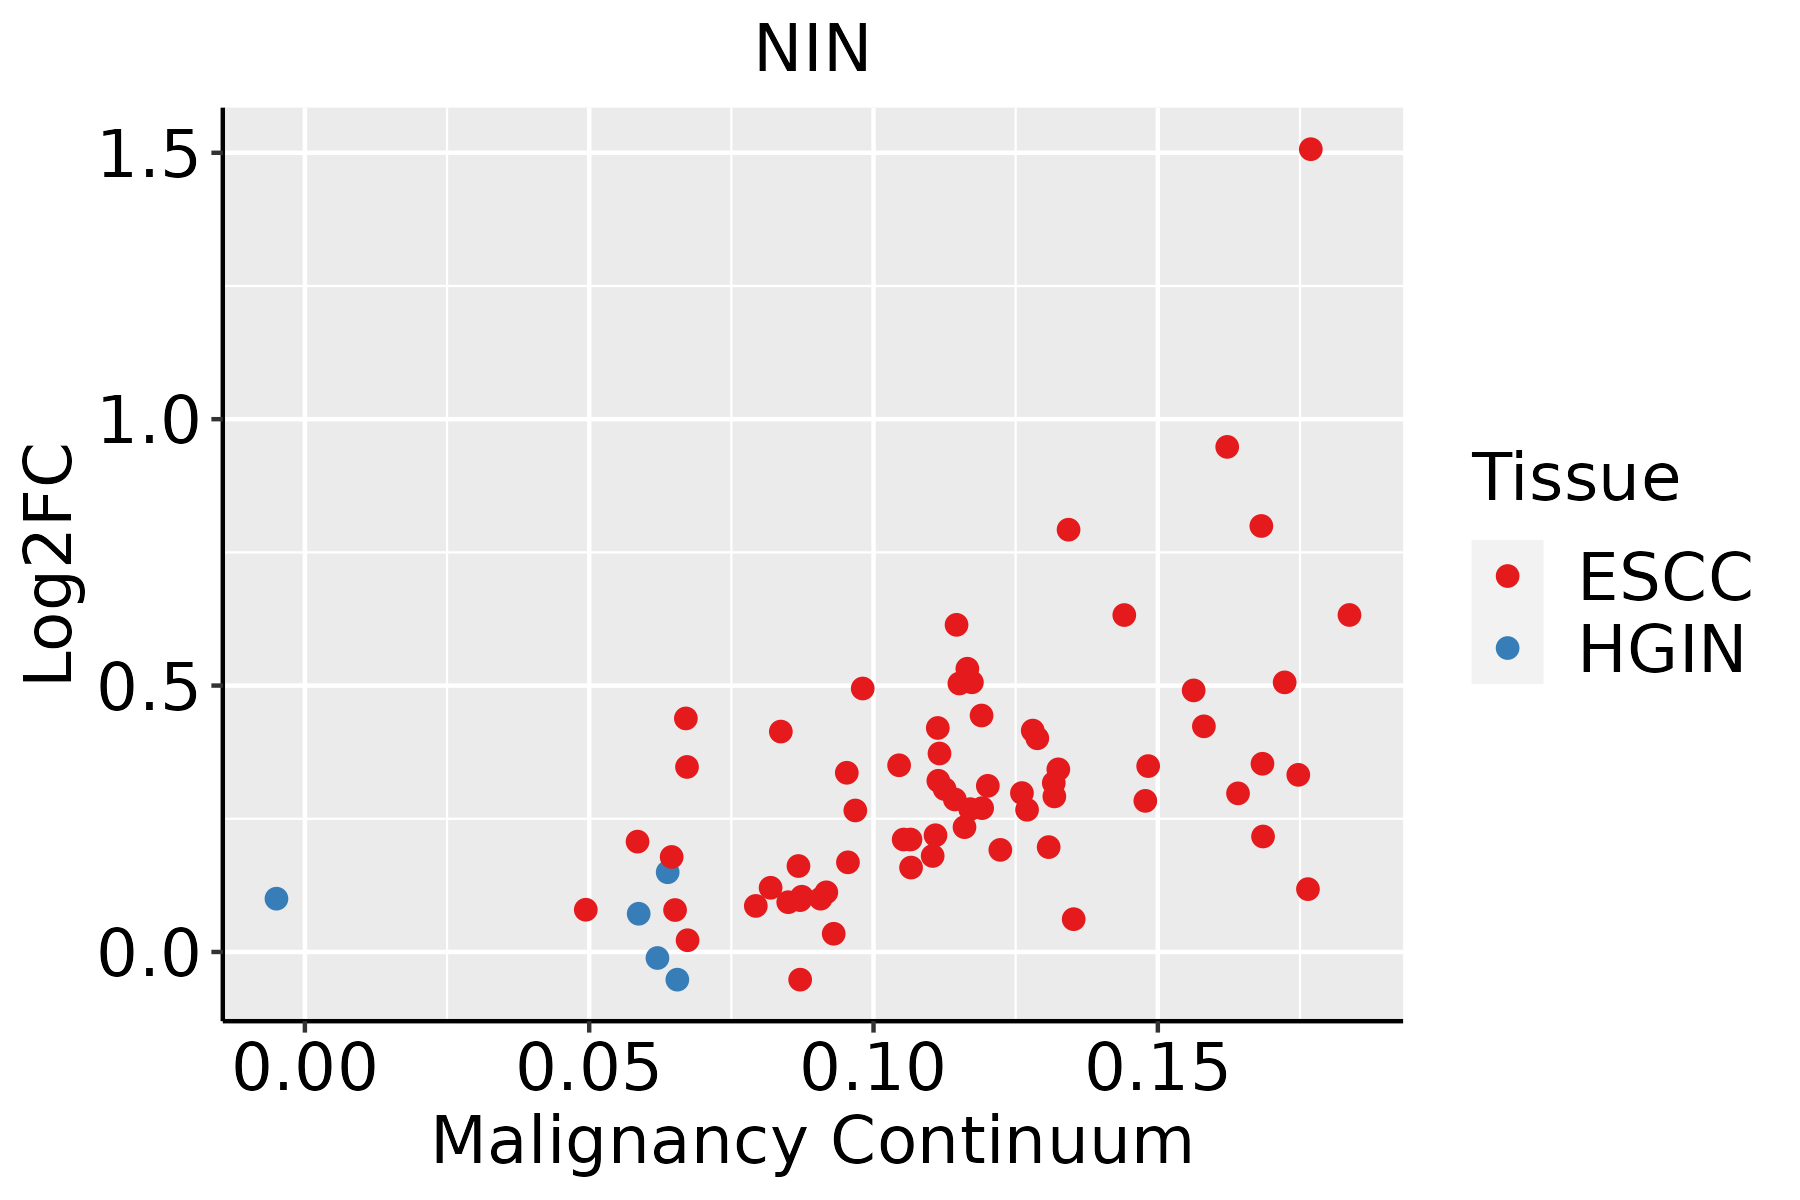
ESCC: Esophageal squamous cell carcinoma
HGIN: High-grade intraepithelial neoplasias
LGIN: Low-grade intraepithelial neoplasias
LiverThe image shows the transcriptomic changes along malignancy continuum.log2FC in expression of this searched gene in stem-like cells from each diseased tissue sample relative to stem-like cells in normal samples in each tissue plotted against the malignancy continuum. Samples are colored based on if they are from different disease stage.
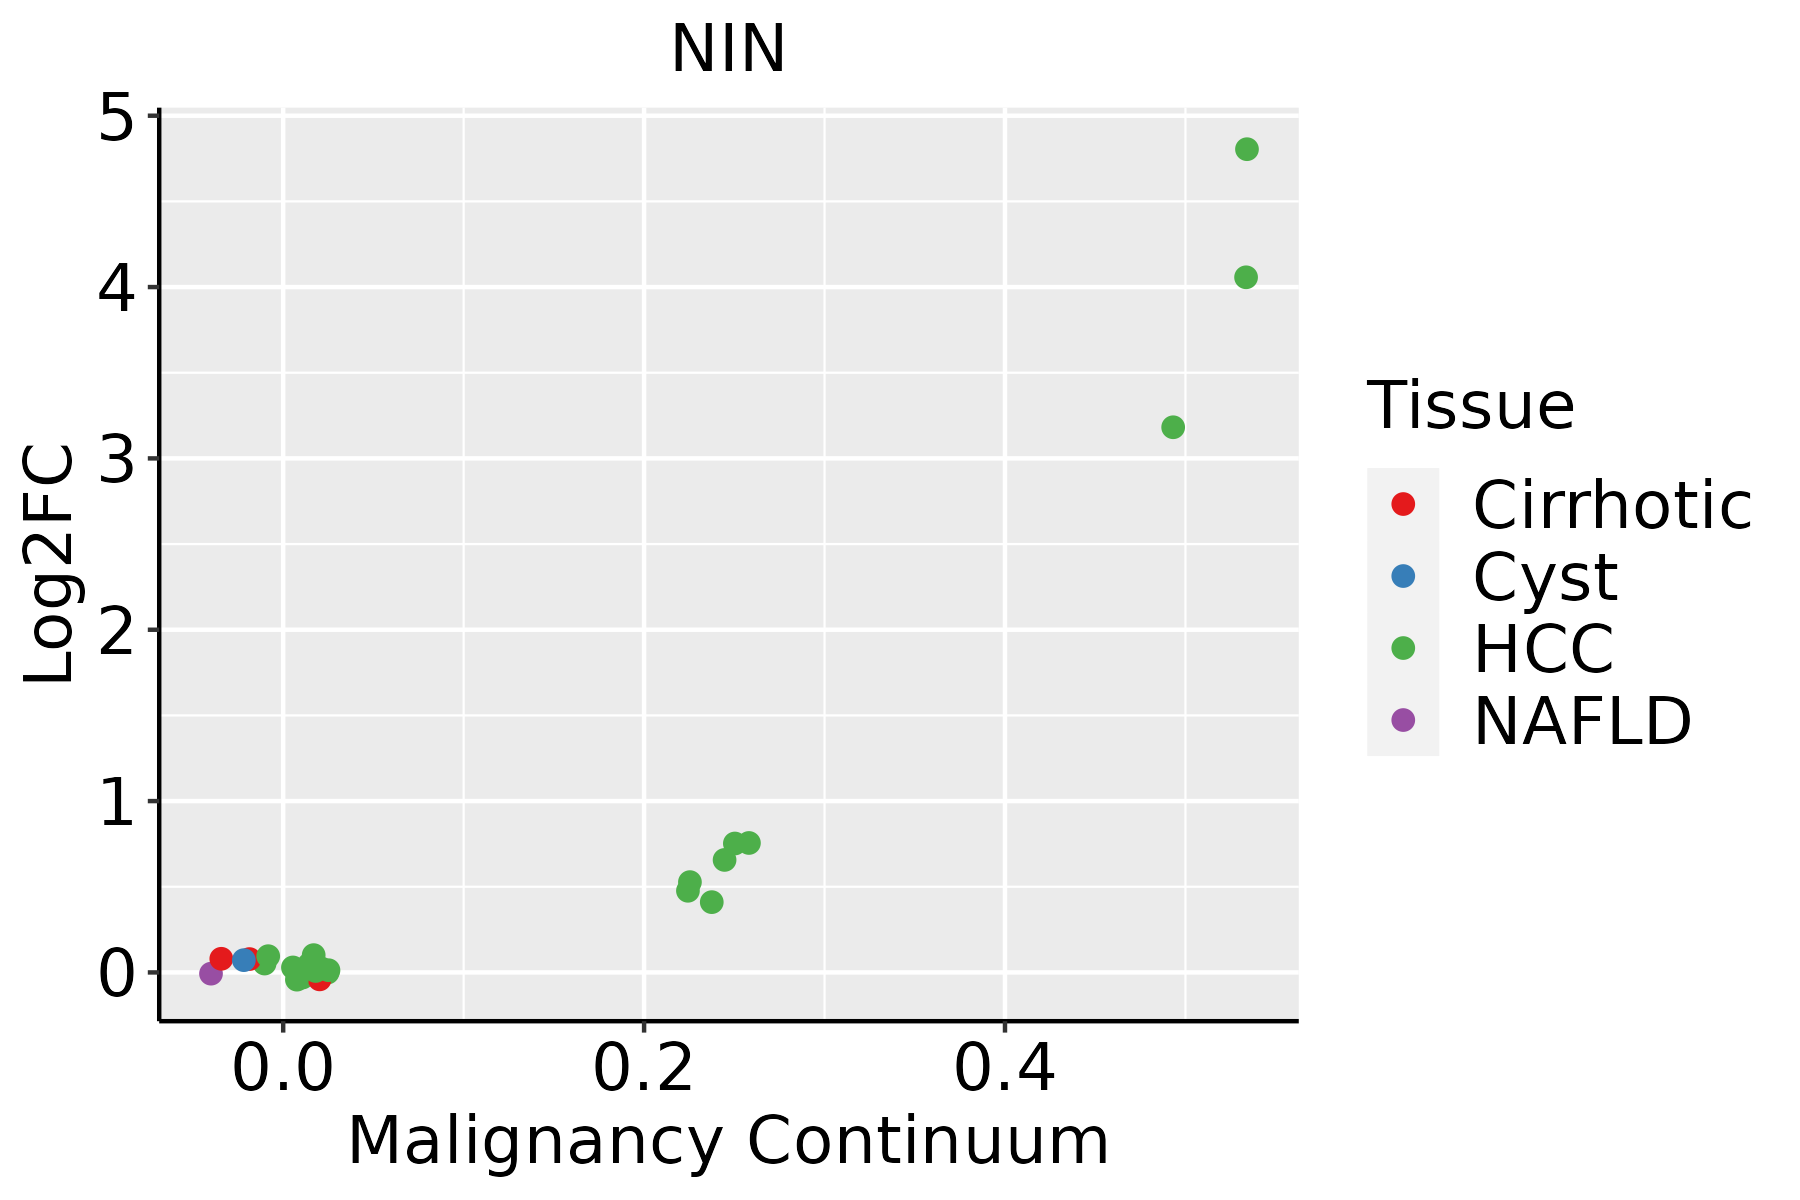
HCC: Hepatocellular carcinoma
NAFLD: Non-alcoholic fatty liver disease
Oral CavityThe image shows the transcriptomic changes along malignancy continuum.log2FC in expression of this searched gene in stem-like cells from each diseased tissue sample relative to stem-like cells in normal samples in each tissue plotted against the malignancy continuum. Samples are colored based on if they are from different disease stage.EOLP: Erosive Oral lichen planus
LP: leukoplakia
NEOLP: Non-erosive oral lichen planus
OSCC: Oral squamous cell carcinoma
ProstateThe image shows the transcriptomic changes along malignancy continuum.log2FC in expression of this searched gene in stem-like cells from each diseased tissue sample relative to stem-like cells in normal samples in each tissue plotted against the malignancy continuum. Samples are colored based on if they are from different disease stage.
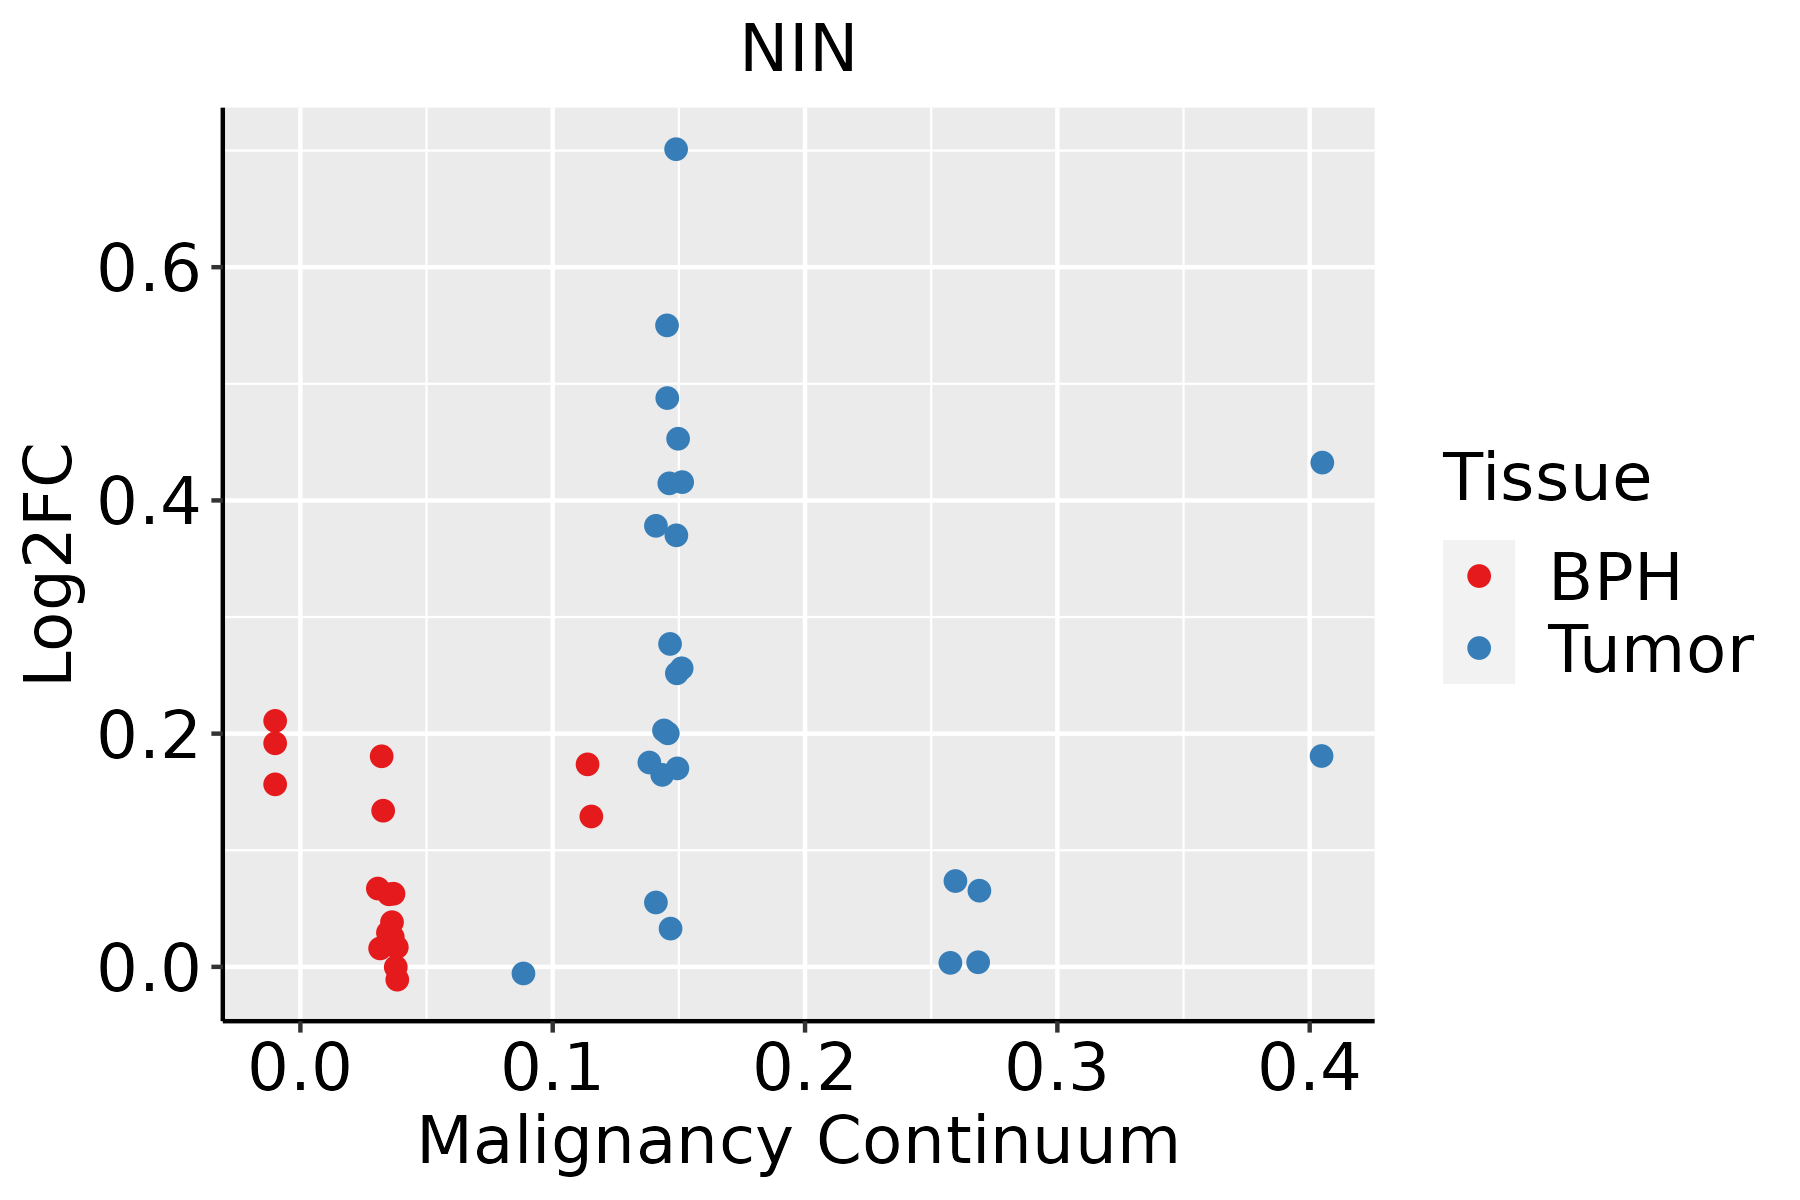
BPH: Benign Prostatic Hyperplasia
SkinThe image shows the transcriptomic changes along malignancy continuum.log2FC in expression of this searched gene in stem-like cells from each diseased tissue sample relative to stem-like cells in normal samples in each tissue plotted against the malignancy continuum. Samples are colored based on if they are from different disease stage.
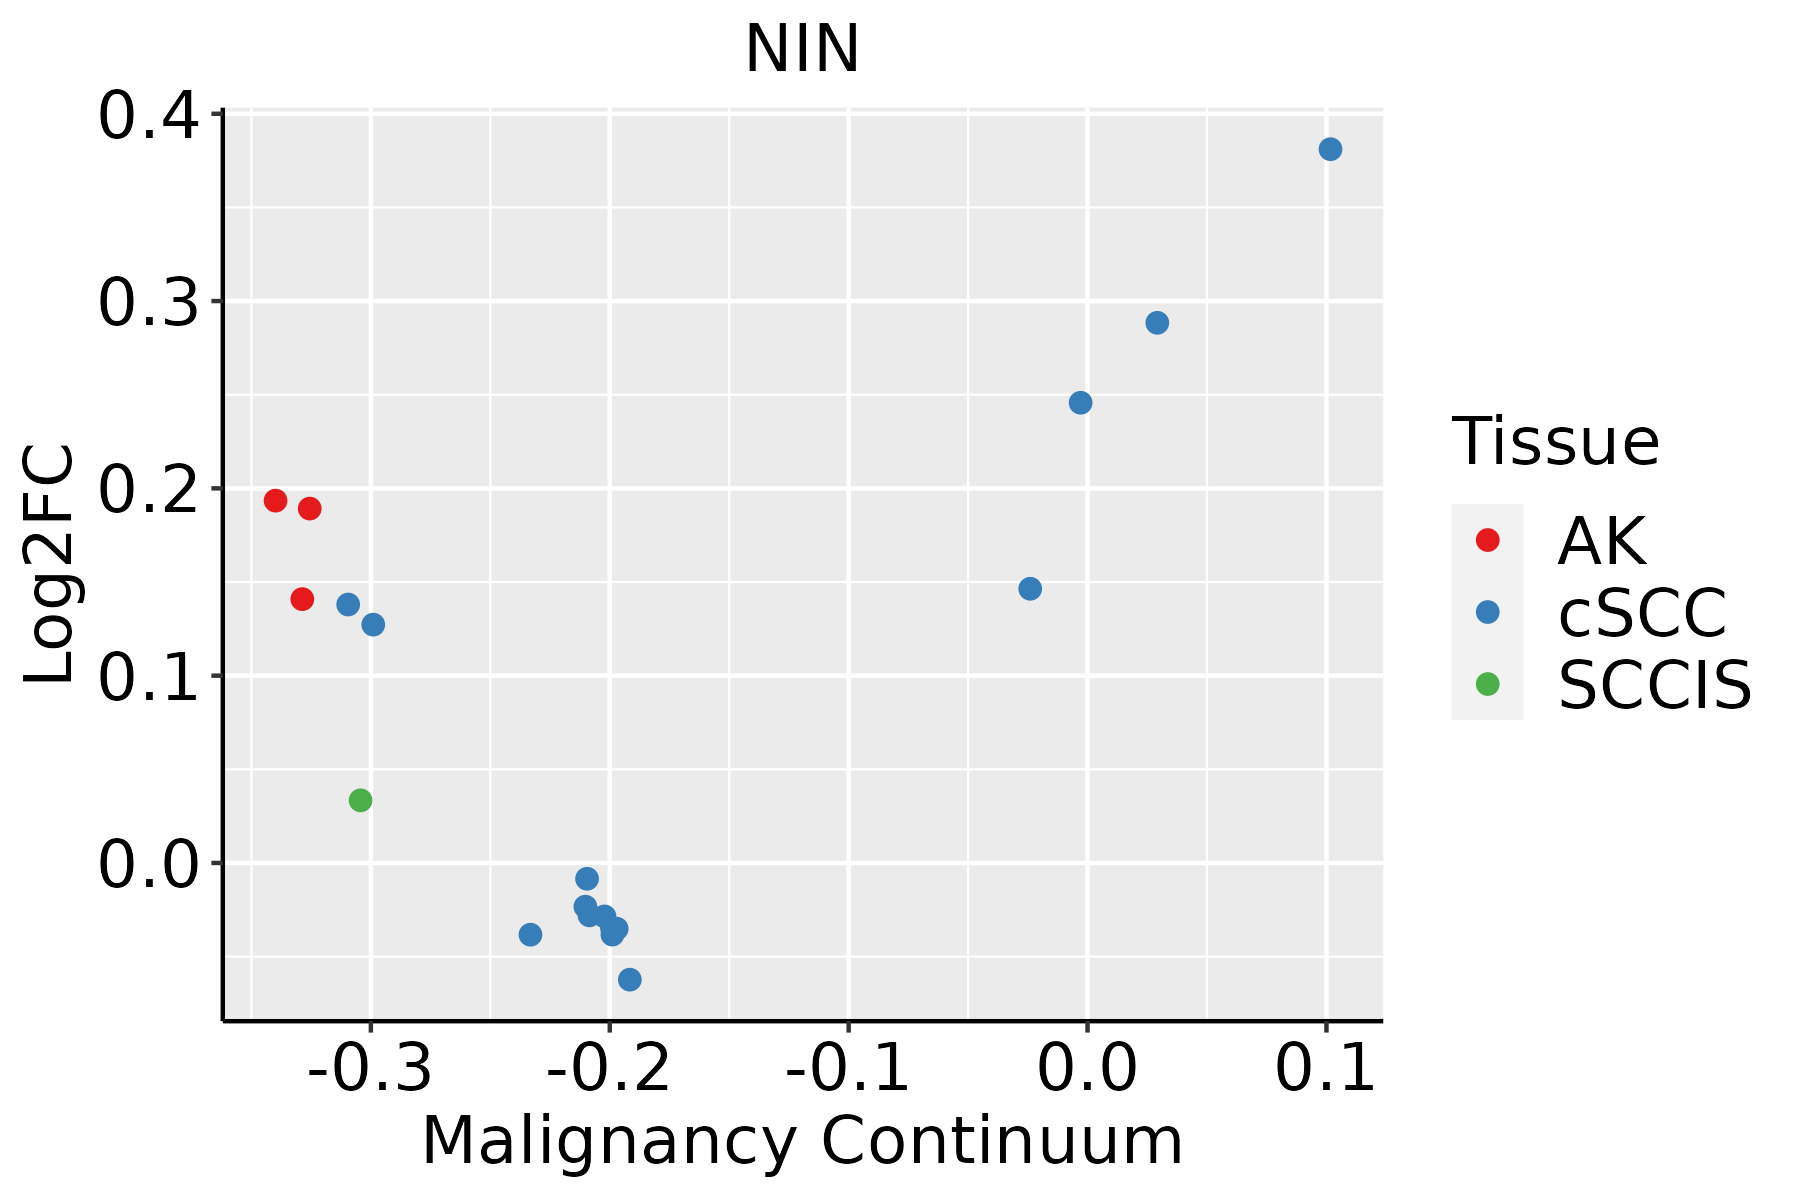
AK: Actinic keratosis
cSCC: Cutaneous squamous cell carcinoma
SCCIS:squamous cell carcinoma in situ
ThyroidThe image shows the transcriptomic changes along malignancy continuum.log2FC in expression of this searched gene in stem-like cells from each diseased tissue sample relative to stem-like cells in normal samples in each tissue plotted against the malignancy continuum. Samples are colored based on if they are from different disease stage.
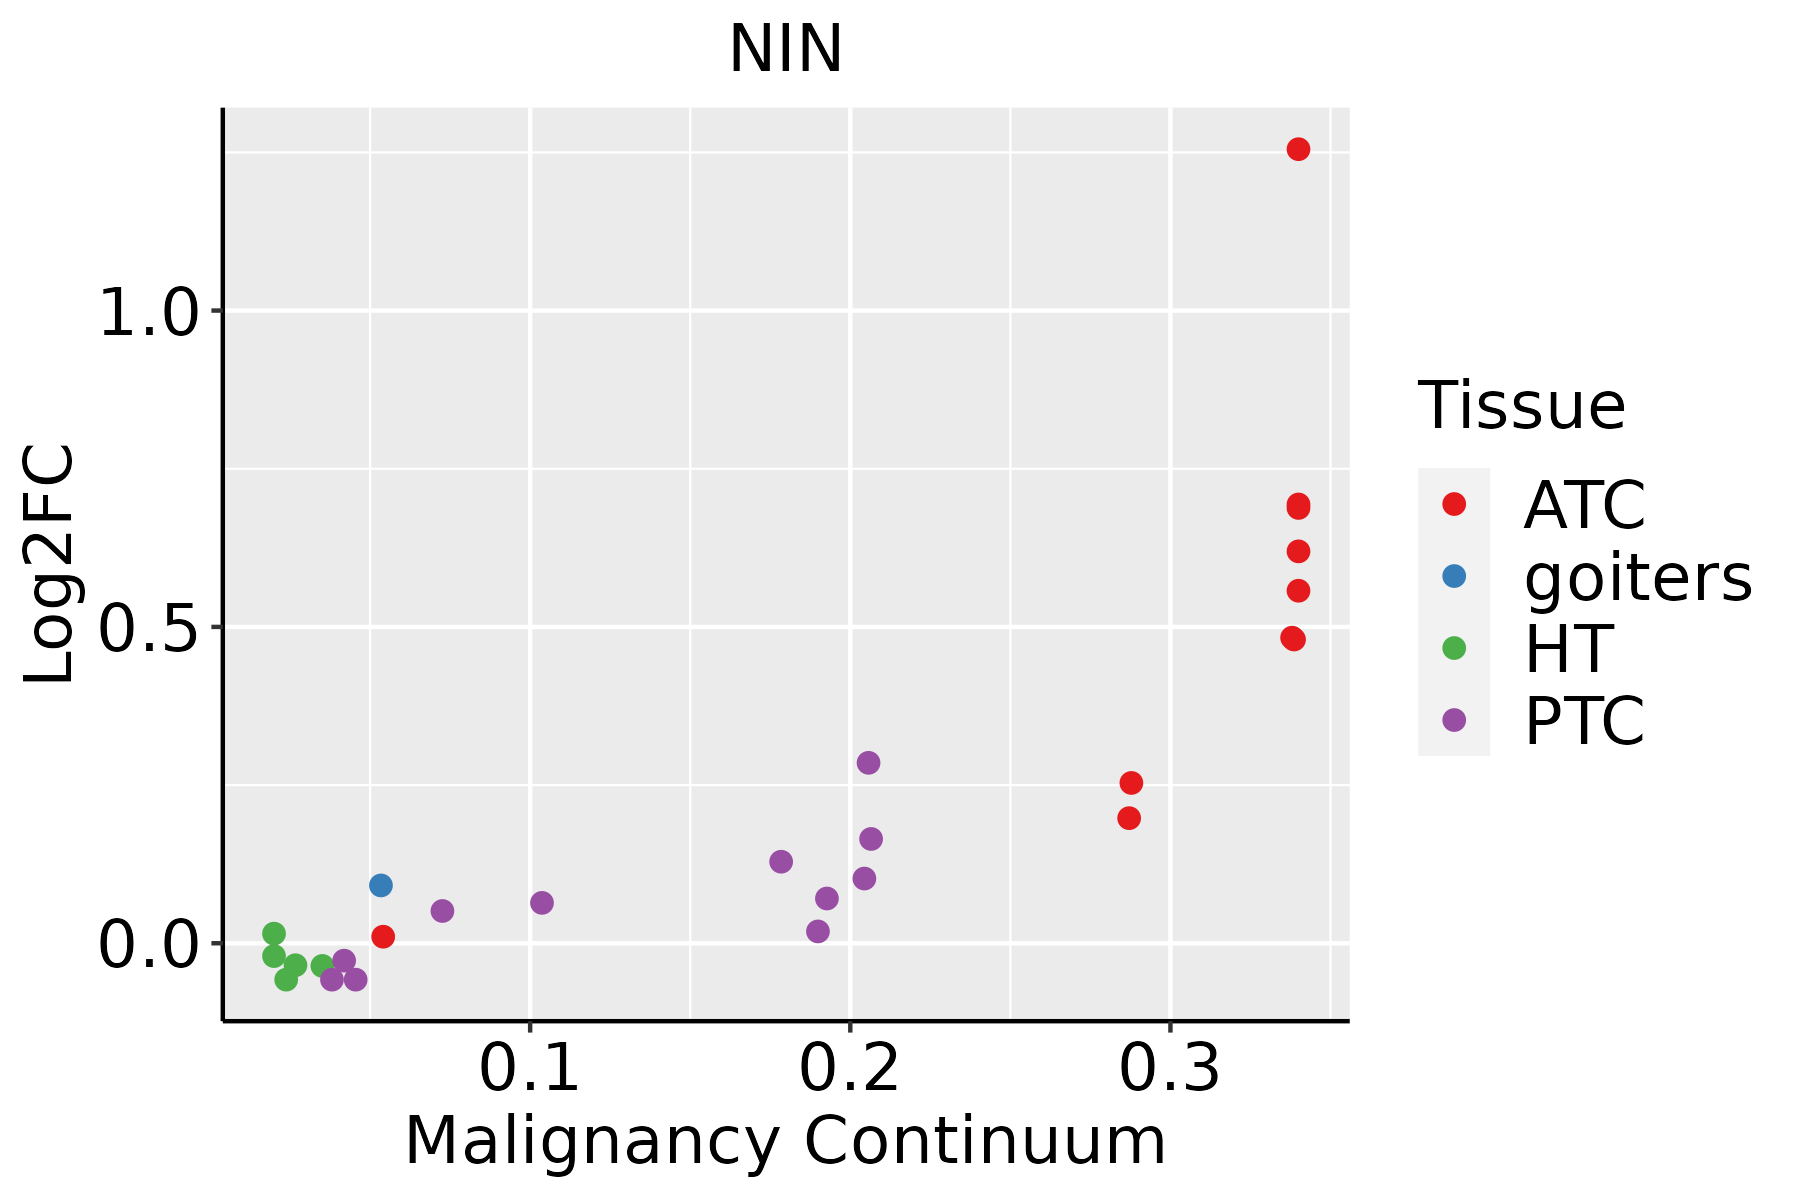
ATC: Anaplastic thyroid cancer
HT: Hashimoto's thyroiditis
PTC: Papillary thyroid cancer
∗log2FC in expression of this searched gene in stem-like cells from each diseased tissue sample relative to stem-like cells in normal samples in each tissue plotted against the malignancy continuum. Samples are colored based on if they are from different disease stage.

Top

Malignant transformation related pathway analysis

check buttonFind out the enriched GO biological processes and KEGG pathways involved in transition from healthy to precancer to cancer
check button Figure of enriched GO biological processes.
TissueDisease StageEnriched GO biological Processes
ColorectumADGO analysis - Figure of enriched GO biological processes: Top 15 enriched GO BP terms are showed in the bar plot of each disease state in each tissue. Each row represents a significant GO biological process which is colored according to the -log10(p.adjust).
ColorectumSERGO analysis - Figure of enriched GO biological processes: Top 15 enriched GO BP terms are showed in the bar plot of each disease state in each tissue. Each row represents a significant GO biological process which is colored according to the -log10(p.adjust).
ColorectumMSSGO analysis - Figure of enriched GO biological processes: Top 15 enriched GO BP terms are showed in the bar plot of each disease state in each tissue. Each row represents a significant GO biological process which is colored according to the -log10(p.adjust).
ColorectumMSI-HGO analysis - Figure of enriched GO biological processes: Top 15 enriched GO BP terms are showed in the bar plot of each disease state in each tissue. Each row represents a significant GO biological process which is colored according to the -log10(p.adjust).
ColorectumFAPGO analysis - Figure of enriched GO biological processes: Top 15 enriched GO BP terms are showed in the bar plot of each disease state in each tissue. Each row represents a significant GO biological process which is colored according to the -log10(p.adjust).
∗Top 15 enriched GO BP terms are showed in the bar plot of each disease state in each tissue. Each row represents a significant GO biological process which is colored according to the -log10(p.adjust).
Page: 1 2 3 4 5 6 7 8 9 

check button Enriched GO biological processes.
GO IDTissueDisease StageDescriptionGene RatioBg Ratiopvaluep.adjustCount
GO:0034454Oral cavityEOLPmicrotubule anchoring at centrosome5/221811/187235.79e-032.94e-025
GO:006056015Oral cavityEOLPdevelopmental growth involved in morphogenesis41/2218234/187236.54e-033.21e-0241
GO:003111011Oral cavityEOLPregulation of microtubule polymerization or depolymerization19/221888/187236.55e-033.21e-0219
GO:000740910Oral cavityEOLPaxonogenesis66/2218418/187238.99e-034.13e-0266
GO:005077212Oral cavityEOLPpositive regulation of axonogenesis17/221879/187231.01e-024.55e-0217
GO:006156414Oral cavityEOLPaxon development72/2218467/187231.14e-025.00e-0272
GO:190290334Oral cavityNEOLPregulation of supramolecular fiber organization88/2005383/187232.44e-124.83e-1088
GO:004325432Oral cavityNEOLPregulation of protein-containing complex assembly95/2005428/187232.76e-125.29e-1095
GO:003133433Oral cavityNEOLPpositive regulation of protein-containing complex assembly58/2005237/187231.09e-097.92e-0858
GO:190290533Oral cavityNEOLPpositive regulation of supramolecular fiber organization53/2005209/187231.47e-091.01e-0753
GO:003227133Oral cavityNEOLPregulation of protein polymerization57/2005233/187231.54e-091.03e-0757
GO:005125833Oral cavityNEOLPprotein polymerization67/2005297/187232.27e-091.40e-0767
GO:003227333Oral cavityNEOLPpositive regulation of protein polymerization37/2005138/187239.19e-083.43e-0637
GO:001604931Oral cavityNEOLPcell growth90/2005482/187239.23e-083.43e-0690
GO:005149532Oral cavityNEOLPpositive regulation of cytoskeleton organization50/2005226/187234.47e-071.35e-0550
GO:001072031Oral cavityNEOLPpositive regulation of cell development59/2005298/187232.21e-065.13e-0559
GO:001097521Oral cavityNEOLPregulation of neuron projection development77/2005445/187231.44e-052.53e-0477
GO:003111631Oral cavityNEOLPpositive regulation of microtubule polymerization13/200533/187231.70e-052.88e-0413
GO:003090013Oral cavityNEOLPforebrain development67/2005379/187232.54e-053.99e-0467
GO:004678531Oral cavityNEOLPmicrotubule polymerization22/200583/187234.31e-056.10e-0422
Page: 1 2 3 4 5 6 7 8 9 10 11 12 13 14 15 16 17 18 19 20 21 22 23 

check button Enriched KEGG pathways.
Pathway IDTissueDisease StageDescriptionGene RatioBg Ratiopvaluep.adjustqvalueCount
Page: 1 

Top

Cell-cell communication analysis

check buttonIdentification of potential cell-cell interactions between two cell types and their ligand-receptor pairs for different disease states
LigandReceptorLRpairPathwayTissueDisease Stage
Page: 1 

Top

Single-cell gene regulatory network inference analysis

check buttonFind out the significant the regulons (TFs) and the target genes of each regulon across cell types for different disease states
TFCell TypeTissueDisease StageTarget GeneRSSRegulon Activity
∗The dot plots of a searched regulon are shown for all cell subpopulations in each disease state of each tissue based on the regulon specific score inferred using pySCENIC and by calculating the average expression.
Page: 1 

Top

Somatic mutation of malignant transformation related genes

check buttonAnnotation of somatic variants for genes involved in malignant transformation
Hugo SymbolVariant ClassVariant ClassificationdbSNP RSHGVScHGVSpHGVSp ShortSWISSPROTBIOTYPESIFTPolyPhenTumor Sample BarcodeTissueHistologySexAgeStageTherapy TypesDrugsOutcome
NINSNVMissense_Mutationnovelc.4249C>Gp.Gln1417Glup.Q1417EQ8N4C6protein_codingtolerated(0.58)benign(0)TCGA-5L-AAT1-01Breastbreast invasive carcinomaFemale<65III/IVHormone TherapyletrozolSD
NINSNVMissense_Mutationc.51N>Gp.Phe17Leup.F17LQ8N4C6protein_codingdeleterious(0)probably_damaging(0.987)TCGA-A8-A06U-01Breastbreast invasive carcinomaFemale>=65I/IIUnknownUnknownSD
NINSNVMissense_Mutationnovelc.2894C>Gp.Ala965Glyp.A965GQ8N4C6protein_codingtolerated(0.21)benign(0.006)TCGA-A8-A096-01Breastbreast invasive carcinomaFemale>=65I/IIUnknownUnknownSD
NINSNVMissense_Mutationnovelc.517N>Ap.Gln173Lysp.Q173KQ8N4C6protein_codingtolerated(0.14)benign(0.006)TCGA-AC-A5EH-01Breastbreast invasive carcinomaFemale>=65I/IIUnknownUnknownSD
NINSNVMissense_Mutationc.3568N>Gp.Arg1190Glyp.R1190GQ8N4C6protein_codingtolerated(0.09)possibly_damaging(0.573)TCGA-AN-A0AK-01Breastbreast invasive carcinomaFemale>=65I/IIUnknownUnknownSD
NINSNVMissense_Mutationnovelc.4658N>Tp.Glu1553Valp.E1553VQ8N4C6protein_codingdeleterious(0)benign(0.219)TCGA-C8-A1HJ-01Breastbreast invasive carcinomaFemale<65I/IIUnknownUnknownSD
NINSNVMissense_Mutationnovelc.4739N>Tp.Ser1580Leup.S1580LQ8N4C6protein_codingtolerated(0.13)benign(0.069)TCGA-D8-A1J9-01Breastbreast invasive carcinomaFemale<65I/IIUnknownUnknownSD
NINSNVMissense_Mutationc.1444N>Ap.Arg482Serp.R482SQ8N4C6protein_codingdeleterious(0)probably_damaging(0.999)TCGA-D8-A1J9-01Breastbreast invasive carcinomaFemale<65I/IIUnknownUnknownSD
NINSNVMissense_Mutationrs774918630c.6116N>Ap.Arg2039Glnp.R2039QQ8N4C6protein_codingdeleterious(0)probably_damaging(0.999)TCGA-D8-A1JA-01Breastbreast invasive carcinomaFemale<65III/IVChemotherapyadriamycinPD
NINSNVMissense_Mutationc.5731N>Cp.Glu1911Glnp.E1911QQ8N4C6protein_codingdeleterious(0.01)probably_damaging(0.994)TCGA-D8-A1JA-01Breastbreast invasive carcinomaFemale<65III/IVChemotherapyadriamycinPD
Page: 1 2 3 4 5 6 7 8 9 10 11 12 13 14 15 16 17 18 19 20 21 

Top

Related drugs of malignant transformation related genes

check buttonIdentification of chemicals and drugs interact with genes involved in malignant transfromation
(DGIdb 4.0)
Entrez IDSymbolCategoryInteraction TypesDrug Claim NameDrug NamePMIDs
Page: 1