
|
|||||
|
 | |
| |
| |
| |
| |
| |
|
Gene: MEN1 |
Gene summary for MEN1 |
| Gene information | Species | Human | Gene symbol | MEN1 | Gene ID | 4221 |
| Gene name | menin 1 | |
| Gene Alias | MEAI | |
| Cytomap | 11q13.1 | |
| Gene Type | protein-coding | GO ID | GO:0000003 | UniProtAcc | A0A024R5D2 |
Top |
Malignant transformation analysis |
| Identification of the aberrant gene expression in precancerous and cancerous lesions by comparing the gene expression of stem-like cells in diseased tissues with normal stem cells |
| Entrez ID | Symbol | Replicates | Species | Organ | Tissue | Adj P-value | Log2FC | Malignancy |
| 4221 | MEN1 | LZE7T | Human | Esophagus | ESCC | 4.28e-04 | 1.71e-01 | 0.0667 |
| 4221 | MEN1 | LZE24T | Human | Esophagus | ESCC | 4.41e-10 | 2.62e-01 | 0.0596 |
| 4221 | MEN1 | LZE21T | Human | Esophagus | ESCC | 1.56e-02 | 1.64e-01 | 0.0655 |
| 4221 | MEN1 | P1T-E | Human | Esophagus | ESCC | 8.21e-03 | 2.17e-01 | 0.0875 |
| 4221 | MEN1 | P2T-E | Human | Esophagus | ESCC | 1.99e-21 | 3.48e-01 | 0.1177 |
| 4221 | MEN1 | P4T-E | Human | Esophagus | ESCC | 7.62e-16 | 4.22e-01 | 0.1323 |
| 4221 | MEN1 | P5T-E | Human | Esophagus | ESCC | 1.61e-07 | 1.00e-01 | 0.1327 |
| 4221 | MEN1 | P8T-E | Human | Esophagus | ESCC | 9.05e-11 | 1.81e-01 | 0.0889 |
| 4221 | MEN1 | P9T-E | Human | Esophagus | ESCC | 5.20e-08 | 1.53e-01 | 0.1131 |
| 4221 | MEN1 | P10T-E | Human | Esophagus | ESCC | 1.23e-12 | 2.08e-01 | 0.116 |
| 4221 | MEN1 | P11T-E | Human | Esophagus | ESCC | 9.72e-05 | 2.37e-01 | 0.1426 |
| 4221 | MEN1 | P12T-E | Human | Esophagus | ESCC | 1.37e-08 | 2.44e-01 | 0.1122 |
| 4221 | MEN1 | P15T-E | Human | Esophagus | ESCC | 2.76e-03 | 5.63e-02 | 0.1149 |
| 4221 | MEN1 | P16T-E | Human | Esophagus | ESCC | 1.24e-15 | 2.53e-01 | 0.1153 |
| 4221 | MEN1 | P17T-E | Human | Esophagus | ESCC | 2.75e-03 | 1.64e-01 | 0.1278 |
| 4221 | MEN1 | P19T-E | Human | Esophagus | ESCC | 2.10e-03 | 2.71e-01 | 0.1662 |
| 4221 | MEN1 | P20T-E | Human | Esophagus | ESCC | 2.61e-03 | 8.45e-02 | 0.1124 |
| 4221 | MEN1 | P21T-E | Human | Esophagus | ESCC | 1.39e-08 | 1.85e-01 | 0.1617 |
| 4221 | MEN1 | P22T-E | Human | Esophagus | ESCC | 3.16e-03 | 5.95e-02 | 0.1236 |
| 4221 | MEN1 | P23T-E | Human | Esophagus | ESCC | 7.07e-10 | 2.13e-01 | 0.108 |
| Page: 1 2 3 4 |
| Tissue | Expression Dynamics | Abbreviation |
| Esophagus | 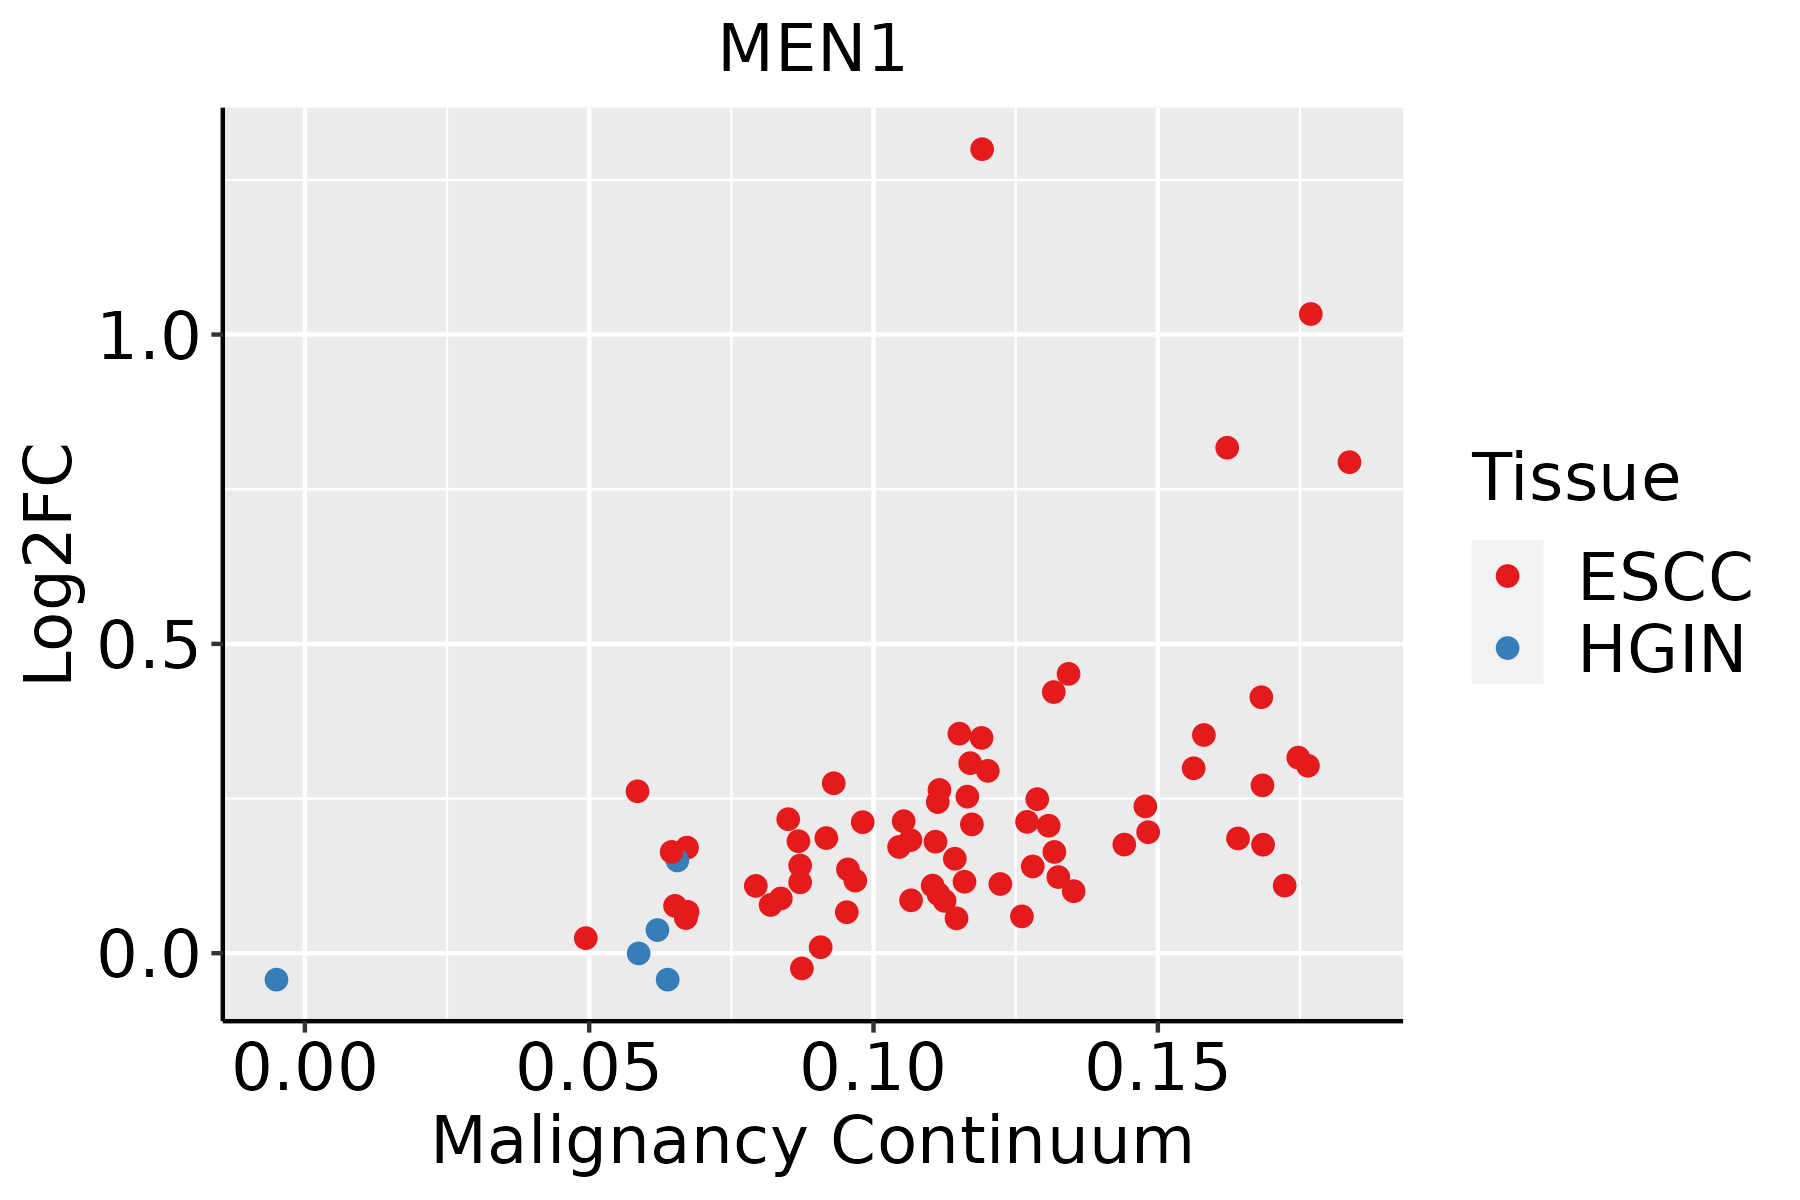 | ESCC: Esophageal squamous cell carcinoma |
| HGIN: High-grade intraepithelial neoplasias | ||
| LGIN: Low-grade intraepithelial neoplasias | ||
| Liver | 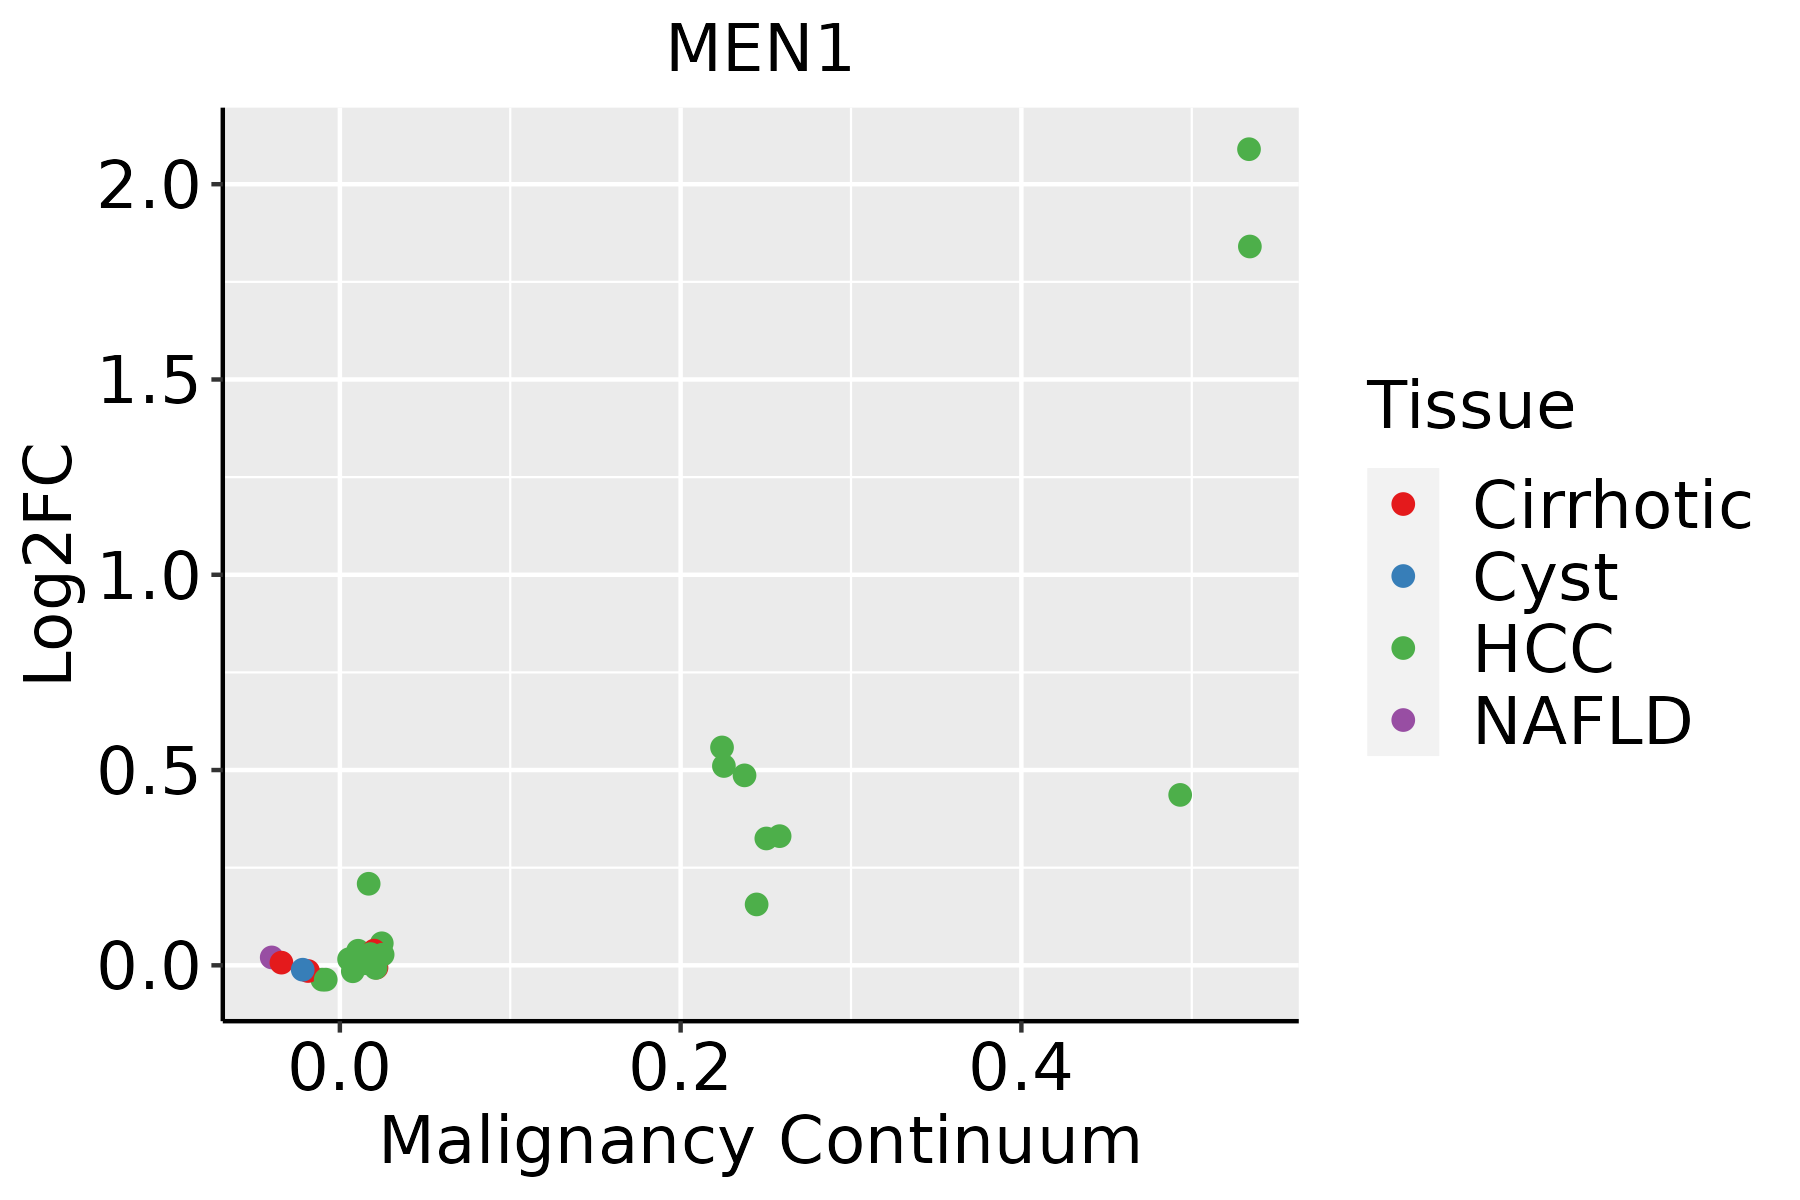 | HCC: Hepatocellular carcinoma |
| NAFLD: Non-alcoholic fatty liver disease | ||
| Oral Cavity |  | EOLP: Erosive Oral lichen planus |
| LP: leukoplakia | ||
| NEOLP: Non-erosive oral lichen planus | ||
| OSCC: Oral squamous cell carcinoma |
| ∗log2FC in expression of this searched gene in stem-like cells from each diseased tissue sample relative to stem-like cells in normal samples in each tissue plotted against the malignancy continuum. Samples are colored based on if they are from different disease stage. |
Top |
Malignant transformation related pathway analysis |
| Find out the enriched GO biological processes and KEGG pathways involved in transition from healthy to precancer to cancer |
| Tissue | Disease Stage | Enriched GO biological Processes |
| Colorectum | AD |  |
| Colorectum | SER |  |
| Colorectum | MSS |  |
| Colorectum | MSI-H |  |
| Colorectum | FAP |  |
| ∗Top 15 enriched GO BP terms are showed in the bar plot of each disease state in each tissue. Each row represents a significant GO biological process which is colored according to the -log10(p.adjust). |
| Page: 1 2 3 4 5 6 7 8 9 |
| GO ID | Tissue | Disease Stage | Description | Gene Ratio | Bg Ratio | pvalue | p.adjust | Count |
| GO:00310992 | Liver | HCC | regeneration | 107/7958 | 198/18723 | 6.67e-04 | 4.12e-03 | 107 |
| GO:00305111 | Liver | HCC | positive regulation of transforming growth factor beta receptor signaling pathway | 23/7958 | 32/18723 | 7.37e-04 | 4.47e-03 | 23 |
| GO:19038461 | Liver | HCC | positive regulation of cellular response to transforming growth factor beta stimulus | 23/7958 | 32/18723 | 7.37e-04 | 4.47e-03 | 23 |
| GO:007133112 | Liver | HCC | cellular response to hexose stimulus | 85/7958 | 153/18723 | 7.47e-04 | 4.52e-03 | 85 |
| GO:007133312 | Liver | HCC | cellular response to glucose stimulus | 84/7958 | 151/18723 | 7.57e-04 | 4.56e-03 | 84 |
| GO:00434097 | Liver | HCC | negative regulation of MAPK cascade | 98/7958 | 180/18723 | 7.88e-04 | 4.74e-03 | 98 |
| GO:00510902 | Liver | HCC | regulation of DNA-binding transcription factor activity | 220/7958 | 440/18723 | 8.04e-04 | 4.82e-03 | 220 |
| GO:00180221 | Liver | HCC | peptidyl-lysine methylation | 74/7958 | 131/18723 | 8.46e-04 | 5.06e-03 | 74 |
| GO:0010948 | Liver | HCC | negative regulation of cell cycle process | 152/7958 | 294/18723 | 8.50e-04 | 5.08e-03 | 152 |
| GO:007030222 | Liver | HCC | regulation of stress-activated protein kinase signaling cascade | 105/7958 | 195/18723 | 8.79e-04 | 5.20e-03 | 105 |
| GO:007132612 | Liver | HCC | cellular response to monosaccharide stimulus | 85/7958 | 154/18723 | 9.78e-04 | 5.68e-03 | 85 |
| GO:000717921 | Liver | HCC | transforming growth factor beta receptor signaling pathway | 106/7958 | 198/18723 | 1.09e-03 | 6.23e-03 | 106 |
| GO:003287312 | Liver | HCC | negative regulation of stress-activated MAPK cascade | 33/7958 | 51/18723 | 1.13e-03 | 6.44e-03 | 33 |
| GO:007030312 | Liver | HCC | negative regulation of stress-activated protein kinase signaling cascade | 33/7958 | 51/18723 | 1.13e-03 | 6.44e-03 | 33 |
| GO:007132212 | Liver | HCC | cellular response to carbohydrate stimulus | 89/7958 | 163/18723 | 1.19e-03 | 6.62e-03 | 89 |
| GO:0000079 | Liver | HCC | regulation of cyclin-dependent protein serine/threonine kinase activity | 55/7958 | 94/18723 | 1.25e-03 | 6.91e-03 | 55 |
| GO:1904029 | Liver | HCC | regulation of cyclin-dependent protein kinase activity | 57/7958 | 98/18723 | 1.26e-03 | 6.92e-03 | 57 |
| GO:1902806 | Liver | HCC | regulation of cell cycle G1/S phase transition | 91/7958 | 168/18723 | 1.47e-03 | 7.79e-03 | 91 |
| GO:001097511 | Liver | HCC | regulation of neuron projection development | 220/7958 | 445/18723 | 1.68e-03 | 8.78e-03 | 220 |
| GO:003287222 | Liver | HCC | regulation of stress-activated MAPK cascade | 102/7958 | 192/18723 | 1.86e-03 | 9.49e-03 | 102 |
| Page: 1 2 3 4 5 6 7 8 9 10 11 12 13 14 15 16 17 18 19 20 |
| Pathway ID | Tissue | Disease Stage | Description | Gene Ratio | Bg Ratio | pvalue | p.adjust | qvalue | Count |
| hsa052028 | Esophagus | ESCC | Transcriptional misregulation in cancer | 116/4205 | 193/8465 | 2.08e-03 | 5.95e-03 | 3.05e-03 | 116 |
| hsa0520213 | Esophagus | ESCC | Transcriptional misregulation in cancer | 116/4205 | 193/8465 | 2.08e-03 | 5.95e-03 | 3.05e-03 | 116 |
| Page: 1 |
Top |
Cell-cell communication analysis |
| Identification of potential cell-cell interactions between two cell types and their ligand-receptor pairs for different disease states |
| Ligand | Receptor | LRpair | Pathway | Tissue | Disease Stage |
| Page: 1 |
Top |
Single-cell gene regulatory network inference analysis |
| Find out the significant the regulons (TFs) and the target genes of each regulon across cell types for different disease states |
| TF | Cell Type | Tissue | Disease Stage | Target Gene | RSS | Regulon Activity |
| ∗The dot plots of a searched regulon are shown for all cell subpopulations in each disease state of each tissue based on the regulon specific score inferred using pySCENIC and by calculating the average expression. |
| Page: 1 |
Top |
Somatic mutation of malignant transformation related genes |
| Annotation of somatic variants for genes involved in malignant transformation |
| Hugo Symbol | Variant Class | Variant Classification | dbSNP RS | HGVSc | HGVSp | HGVSp Short | SWISSPROT | BIOTYPE | SIFT | PolyPhen | Tumor Sample Barcode | Tissue | Histology | Sex | Age | Stage | Therapy Types | Drugs | Outcome |
| MEN1 | SNV | Missense_Mutation | novel | c.676N>A | p.Leu226Met | p.L226M | O00255 | protein_coding | deleterious(0) | probably_damaging(0.999) | TCGA-A2-A04N-01 | Breast | breast invasive carcinoma | Female | >=65 | I/II | Chemotherapy | cytoxan | SD |
| MEN1 | SNV | Missense_Mutation | c.1817C>G | p.Ser606Cys | p.S606C | O00255 | protein_coding | deleterious(0.01) | possibly_damaging(0.82) | TCGA-AC-A23H-01 | Breast | breast invasive carcinoma | Female | >=65 | I/II | Unknown | Unknown | PD | |
| MEN1 | SNV | Missense_Mutation | c.323G>C | p.Arg108Pro | p.R108P | O00255 | protein_coding | tolerated(0.07) | possibly_damaging(0.7) | TCGA-AC-A23H-01 | Breast | breast invasive carcinoma | Female | >=65 | I/II | Unknown | Unknown | PD | |
| MEN1 | SNV | Missense_Mutation | c.1084G>C | p.Asp362His | p.D362H | O00255 | protein_coding | deleterious(0) | probably_damaging(1) | TCGA-AC-A6IX-01 | Breast | breast invasive carcinoma | Female | <65 | III/IV | Unknown | Unknown | SD | |
| MEN1 | SNV | Missense_Mutation | rs377715802 | c.1040N>T | p.Ala347Val | p.A347V | O00255 | protein_coding | deleterious(0) | possibly_damaging(0.726) | TCGA-AN-A0AK-01 | Breast | breast invasive carcinoma | Female | >=65 | I/II | Unknown | Unknown | SD |
| MEN1 | SNV | Missense_Mutation | c.479N>T | p.Ser160Phe | p.S160F | O00255 | protein_coding | tolerated(1) | benign(0.009) | TCGA-BH-A0DK-01 | Breast | breast invasive carcinoma | Female | <65 | I/II | Hormone Therapy | tamoxiphen | SD | |
| MEN1 | SNV | Missense_Mutation | c.550G>A | p.Glu184Lys | p.E184K | O00255 | protein_coding | deleterious(0) | probably_damaging(0.934) | TCGA-C8-A8HQ-01 | Breast | breast invasive carcinoma | Female | <65 | I/II | Unknown | Unknown | SD | |
| MEN1 | deletion | Frame_Shift_Del | c.1700_1706delNNNNNNN | p.Lys567SerfsTer24 | p.K567Sfs*24 | O00255 | protein_coding | TCGA-BH-A18R-01 | Breast | breast invasive carcinoma | Female | <65 | I/II | Unknown | Unknown | SD | |||
| MEN1 | deletion | Frame_Shift_Del | c.225_229delNNNNN | p.Thr76LeufsTer39 | p.T76Lfs*39 | O00255 | protein_coding | TCGA-E9-A1N5-01 | Breast | breast invasive carcinoma | Female | <65 | I/II | Chemotherapy | doxorubicin | SD | |||
| MEN1 | insertion | Frame_Shift_Ins | rs767319284 | c.1561_1562insC | p.Arg521ProfsTer15 | p.R521Pfs*15 | O00255 | protein_coding | TCGA-E9-A228-01 | Breast | breast invasive carcinoma | Female | <65 | I/II | Chemotherapy | doxorubicin | SD |
| Page: 1 2 3 4 5 6 7 8 |
Top |
Related drugs of malignant transformation related genes |
| Identification of chemicals and drugs interact with genes involved in malignant transfromation |
| (DGIdb 4.0) |
| Entrez ID | Symbol | Category | Interaction Types | Drug Claim Name | Drug Name | PMIDs |
| 4221 | MEN1 | CLINICALLY ACTIONABLE, DNA REPAIR | CHLORHEXIDINE HYDROCHLORIDE | CHLORHEXIDINE HYDROCHLORIDE | ||
| 4221 | MEN1 | CLINICALLY ACTIONABLE, DNA REPAIR | FURAFYLLINE | FURAFYLLINE | ||
| 4221 | MEN1 | CLINICALLY ACTIONABLE, DNA REPAIR | TCMDC-123591 | CHEMBL588234 | ||
| 4221 | MEN1 | CLINICALLY ACTIONABLE, DNA REPAIR | CYCLIRAMINE MALEATE | CYCLIRAMINE MALEATE | ||
| 4221 | MEN1 | CLINICALLY ACTIONABLE, DNA REPAIR | METHYLENE BLUE | METHYLENE BLUE | ||
| 4221 | MEN1 | CLINICALLY ACTIONABLE, DNA REPAIR | TANNIC ACID | TANNIC ACID | ||
| 4221 | MEN1 | CLINICALLY ACTIONABLE, DNA REPAIR | SJ000029700 | CHEMBL591864 | ||
| 4221 | MEN1 | CLINICALLY ACTIONABLE, DNA REPAIR | TRIMETREXATE | TRIMETREXATE | ||
| 4221 | MEN1 | CLINICALLY ACTIONABLE, DNA REPAIR | TCMDC-124518 | CHEMBL527584 | ||
| 4221 | MEN1 | CLINICALLY ACTIONABLE, DNA REPAIR | TRACAZOLATE | TRACAZOLATE |
| Page: 1 2 3 4 |

Copyright 2023-Present -The University of Texas Health Science Center at Houston |