
|
|||||
|
 | |
| |
| |
| |
| |
| |
|
Gene: MCU |
Gene summary for MCU |
| Gene information | Species | Human | Gene symbol | MCU | Gene ID | 90550 |
| Gene name | mitochondrial calcium uniporter | |
| Gene Alias | C10orf42 | |
| Cytomap | 10q22.1 | |
| Gene Type | protein-coding | GO ID | GO:0000266 | UniProtAcc | Q8NE86 |
Top |
Malignant transformation analysis |
| Identification of the aberrant gene expression in precancerous and cancerous lesions by comparing the gene expression of stem-like cells in diseased tissues with normal stem cells |
| Entrez ID | Symbol | Replicates | Species | Organ | Tissue | Adj P-value | Log2FC | Malignancy |
| 90550 | MCU | CCI_1 | Human | Cervix | CC | 8.85e-14 | 1.09e+00 | 0.528 |
| 90550 | MCU | CCI_2 | Human | Cervix | CC | 2.73e-08 | 8.07e-01 | 0.5249 |
| 90550 | MCU | CCI_3 | Human | Cervix | CC | 2.83e-08 | 5.44e-01 | 0.516 |
| 90550 | MCU | HTA11_3410_2000001011 | Human | Colorectum | AD | 1.98e-33 | -8.79e-01 | 0.0155 |
| 90550 | MCU | HTA11_2951_2000001011 | Human | Colorectum | AD | 9.76e-04 | -8.53e-01 | 0.0216 |
| 90550 | MCU | HTA11_347_2000001011 | Human | Colorectum | AD | 6.87e-15 | 6.61e-01 | -0.1954 |
| 90550 | MCU | HTA11_3361_2000001011 | Human | Colorectum | AD | 7.02e-03 | -4.41e-01 | -0.1207 |
| 90550 | MCU | HTA11_866_3004761011 | Human | Colorectum | AD | 1.66e-09 | -6.12e-01 | 0.096 |
| 90550 | MCU | HTA11_8622_2000001021 | Human | Colorectum | SER | 4.25e-07 | -7.33e-01 | 0.0528 |
| 90550 | MCU | HTA11_7696_3000711011 | Human | Colorectum | AD | 1.41e-07 | -4.49e-01 | 0.0674 |
| 90550 | MCU | HTA11_6818_2000001011 | Human | Colorectum | AD | 2.38e-03 | -4.77e-01 | 0.0112 |
| 90550 | MCU | HTA11_99999970781_79442 | Human | Colorectum | MSS | 1.22e-18 | -5.64e-01 | 0.294 |
| 90550 | MCU | HTA11_99999971662_82457 | Human | Colorectum | MSS | 6.16e-12 | -5.87e-01 | 0.3859 |
| 90550 | MCU | HTA11_99999973899_84307 | Human | Colorectum | MSS | 2.22e-11 | -9.20e-01 | 0.2585 |
| 90550 | MCU | HTA11_99999974143_84620 | Human | Colorectum | MSS | 6.44e-53 | -1.12e+00 | 0.3005 |
| 90550 | MCU | F007 | Human | Colorectum | FAP | 3.20e-02 | -4.44e-01 | 0.1176 |
| 90550 | MCU | A001-C-207 | Human | Colorectum | FAP | 1.38e-04 | -4.64e-01 | 0.1278 |
| 90550 | MCU | A015-C-203 | Human | Colorectum | FAP | 7.03e-28 | -5.67e-01 | -0.1294 |
| 90550 | MCU | A015-C-204 | Human | Colorectum | FAP | 1.28e-07 | -4.91e-01 | -0.0228 |
| 90550 | MCU | A014-C-040 | Human | Colorectum | FAP | 2.32e-10 | -8.95e-01 | -0.1184 |
| Page: 1 2 3 4 5 6 7 8 9 10 |
| Tissue | Expression Dynamics | Abbreviation |
| Cervix | 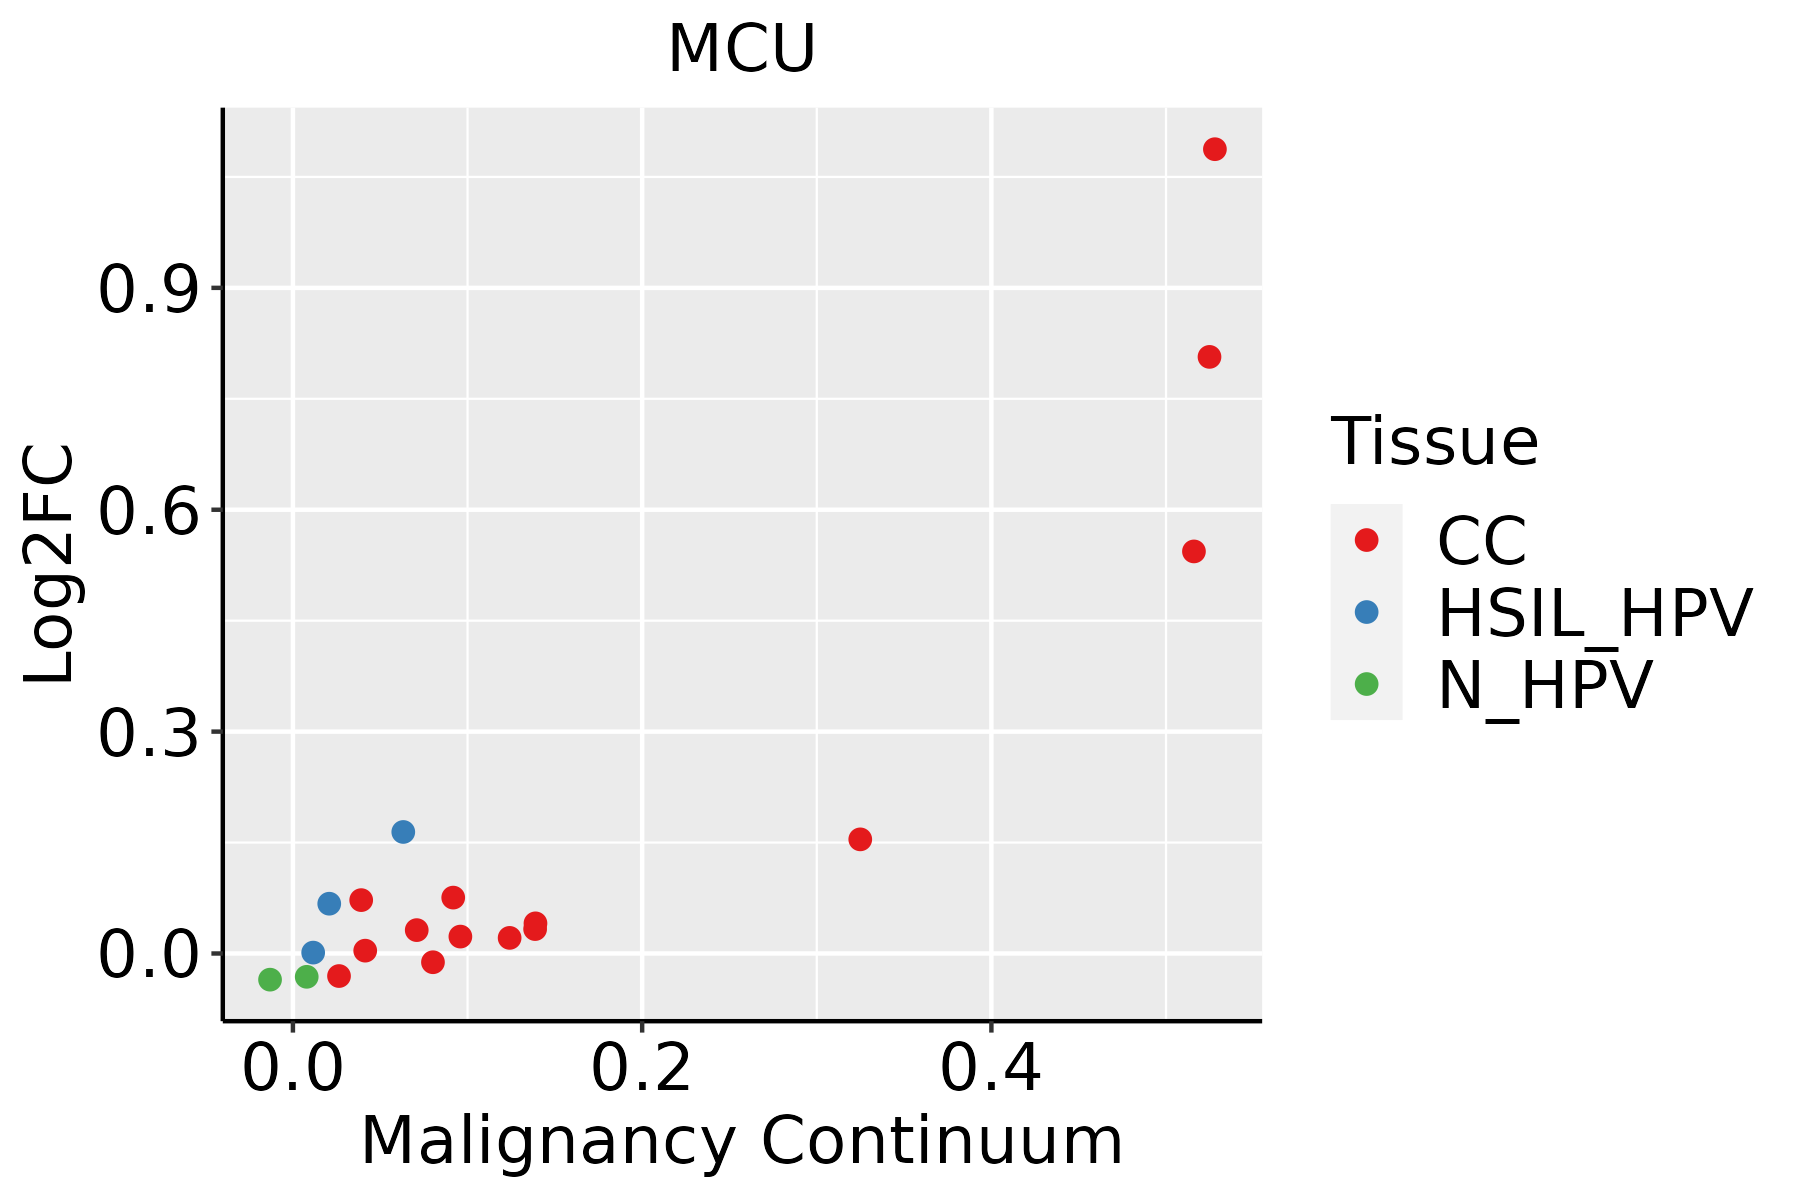 | CC: Cervix cancer |
| HSIL_HPV: HPV-infected high-grade squamous intraepithelial lesions | ||
| N_HPV: HPV-infected normal cervix | ||
| Colorectum (GSE201348) |  | FAP: Familial adenomatous polyposis |
| CRC: Colorectal cancer | ||
| Colorectum (HTA11) |  | AD: Adenomas |
| SER: Sessile serrated lesions | ||
| MSI-H: Microsatellite-high colorectal cancer | ||
| MSS: Microsatellite stable colorectal cancer | ||
| Endometrium | 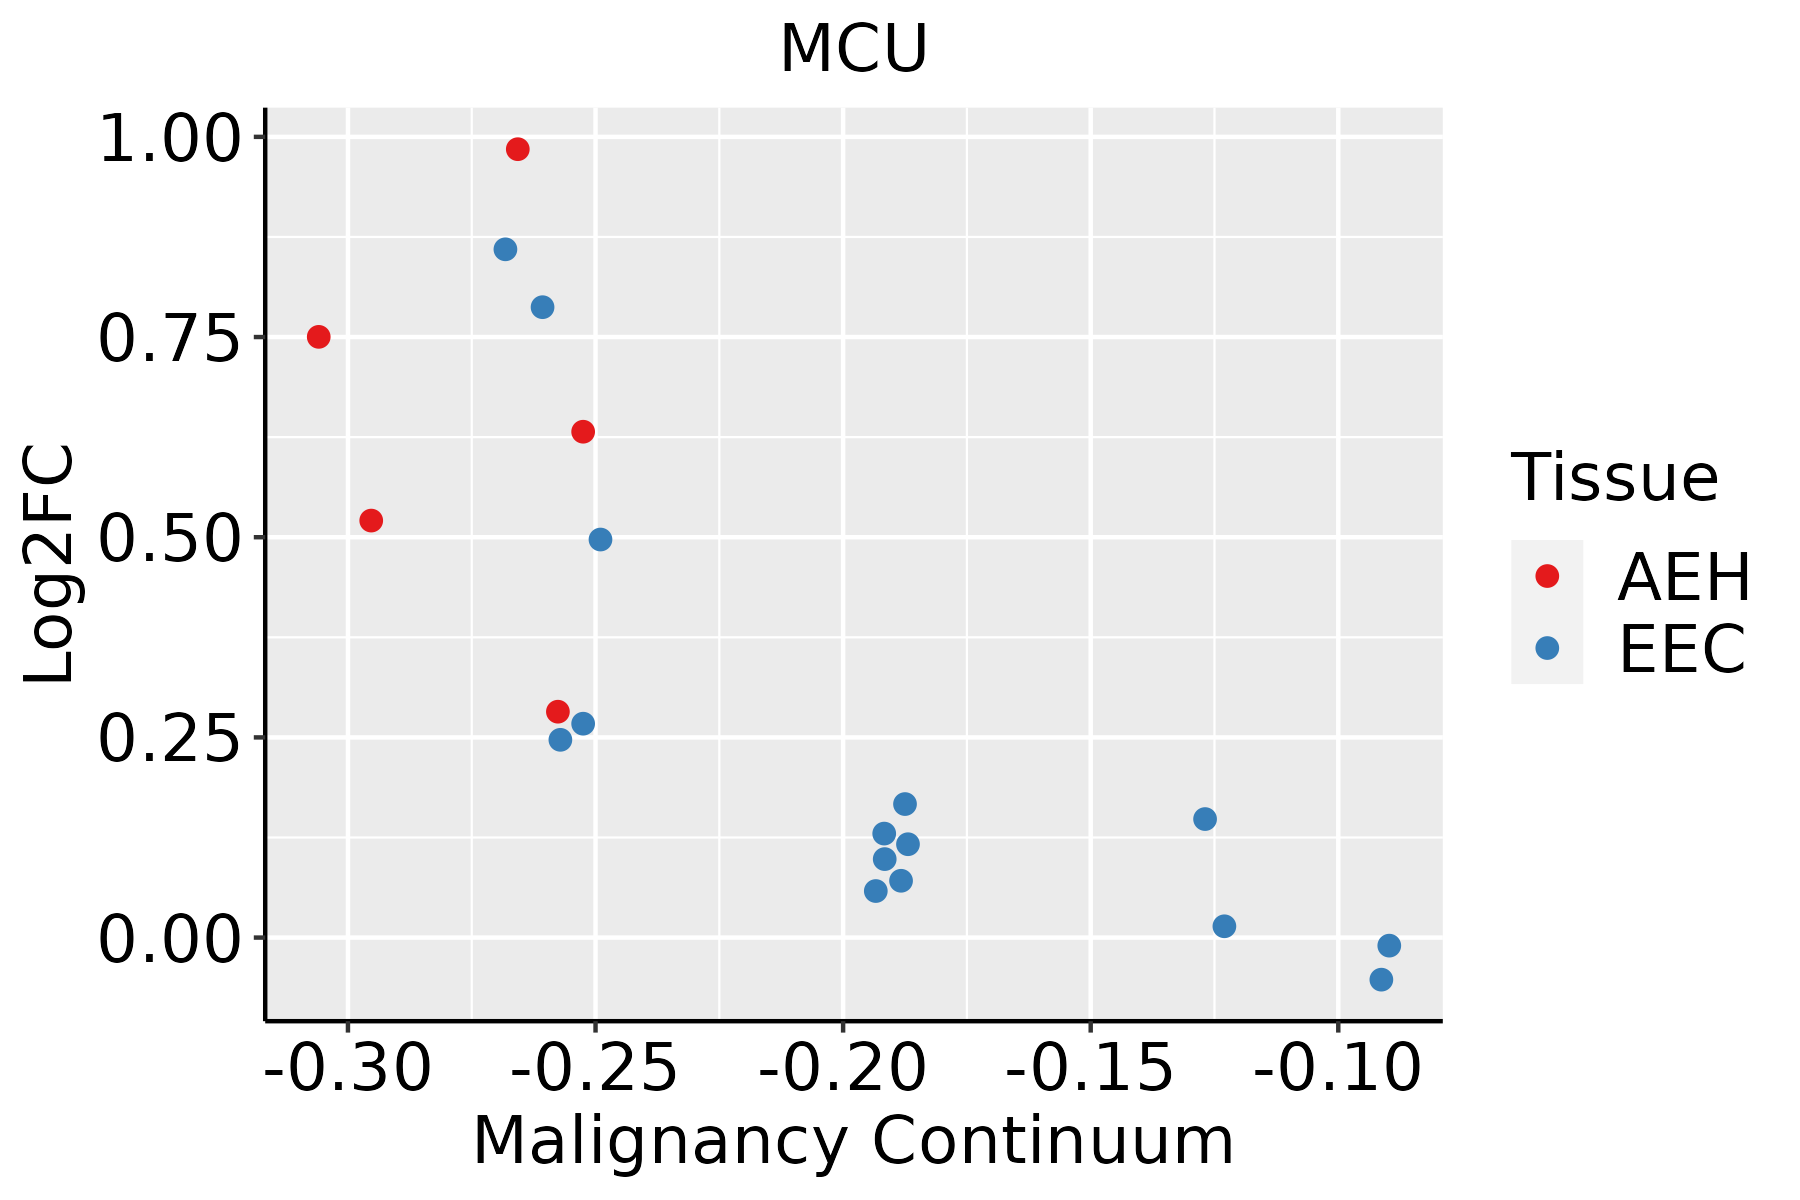 | AEH: Atypical endometrial hyperplasia |
| EEC: Endometrioid Cancer | ||
| Esophagus | 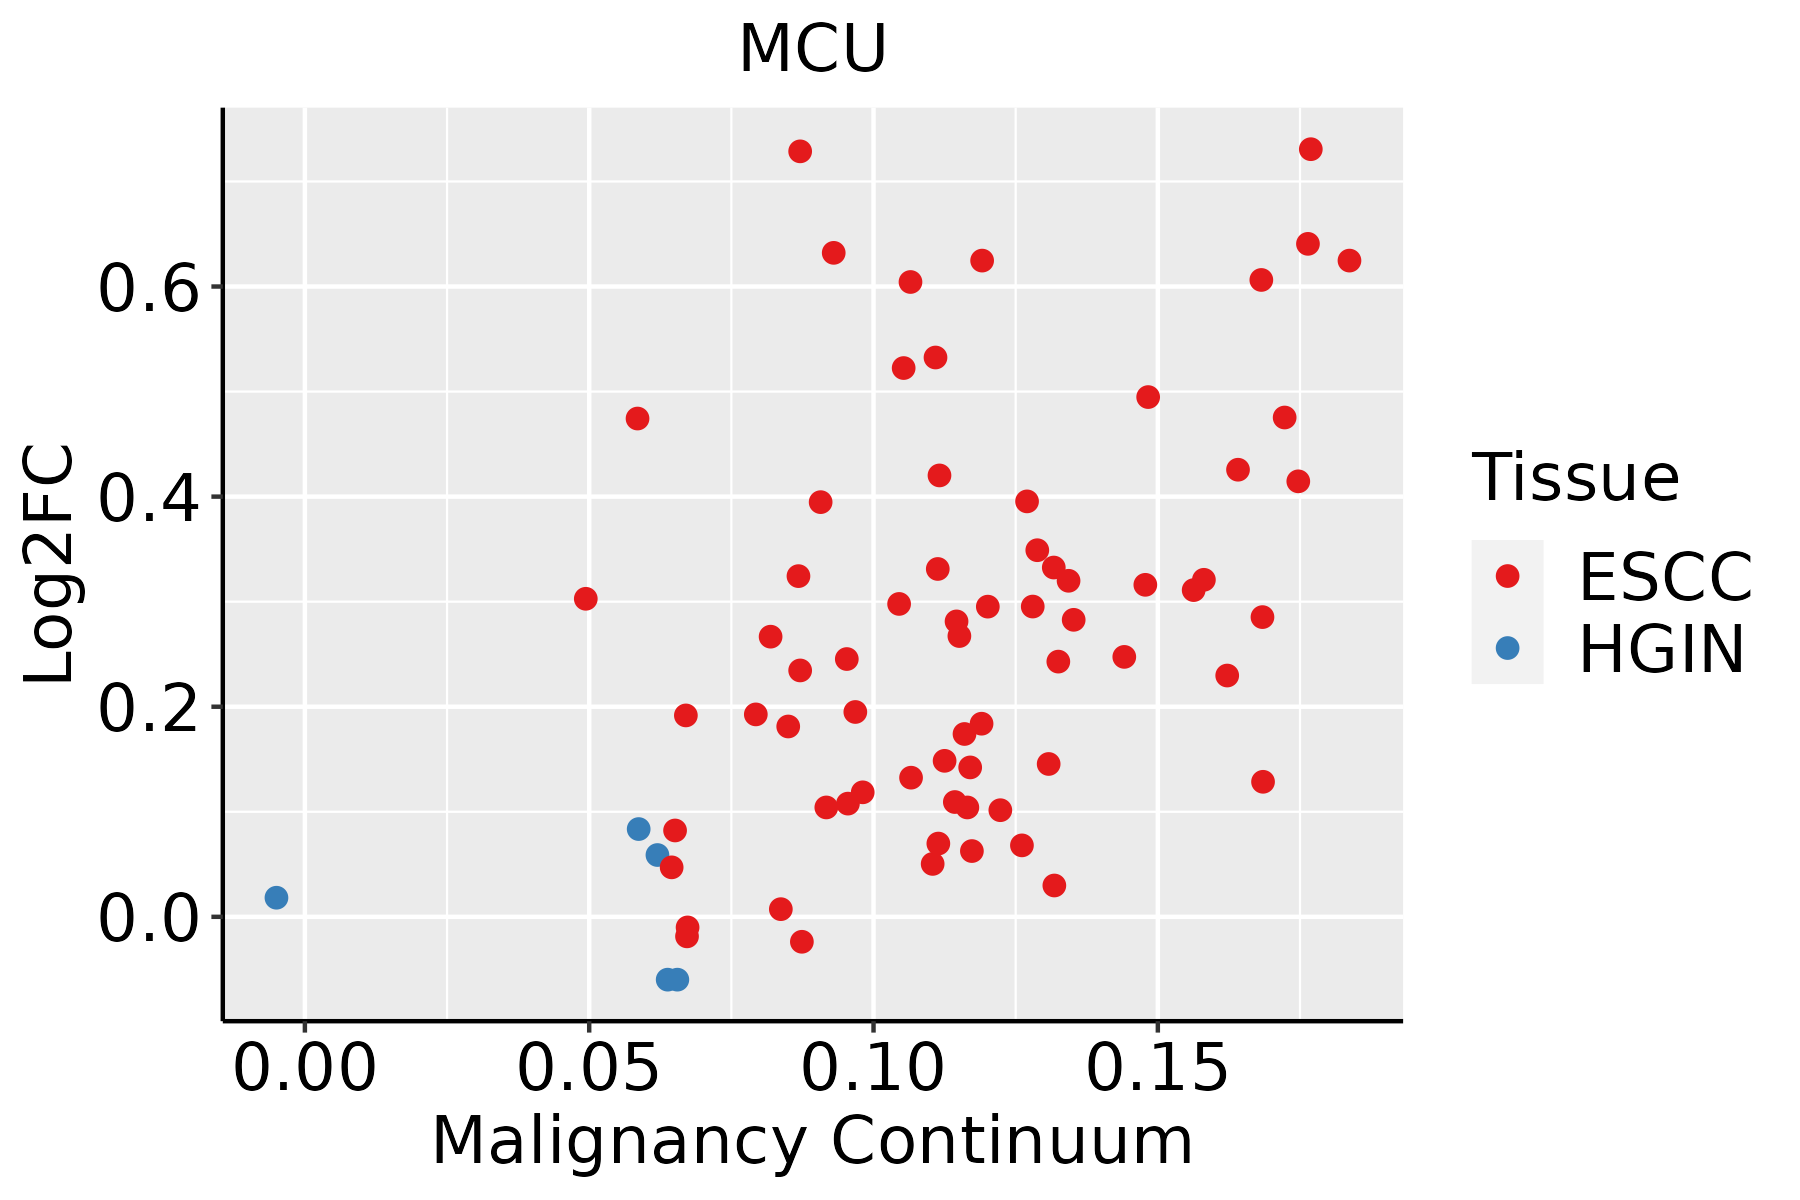 | ESCC: Esophageal squamous cell carcinoma |
| HGIN: High-grade intraepithelial neoplasias | ||
| LGIN: Low-grade intraepithelial neoplasias | ||
| GC | 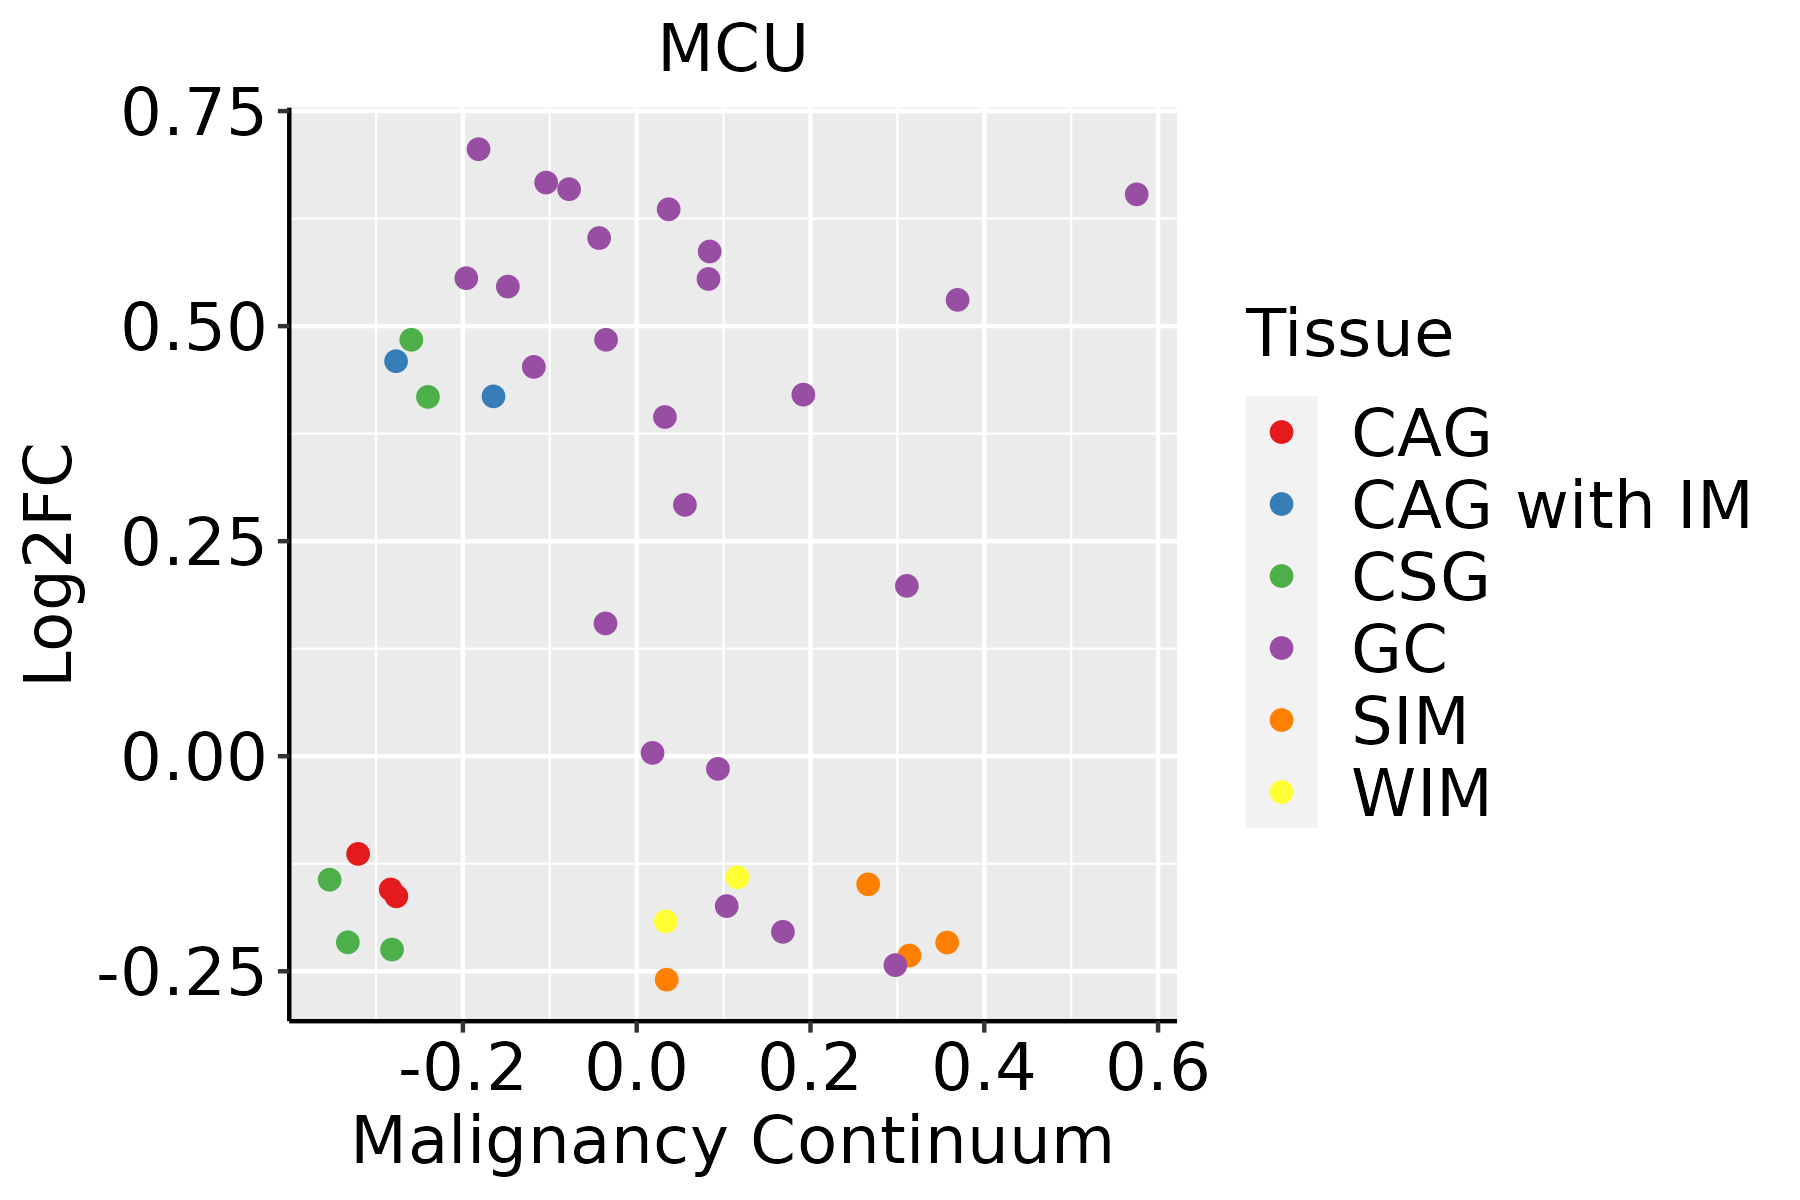 | CAG: Chronic atrophic gastritis |
| CAG with IM: Chronic atrophic gastritis with intestinal metaplasia | ||
| CSG: Chronic superficial gastritis | ||
| GC: Gastric cancer | ||
| SIM: Severe intestinal metaplasia | ||
| WIM: Wild intestinal metaplasia | ||
| Liver | 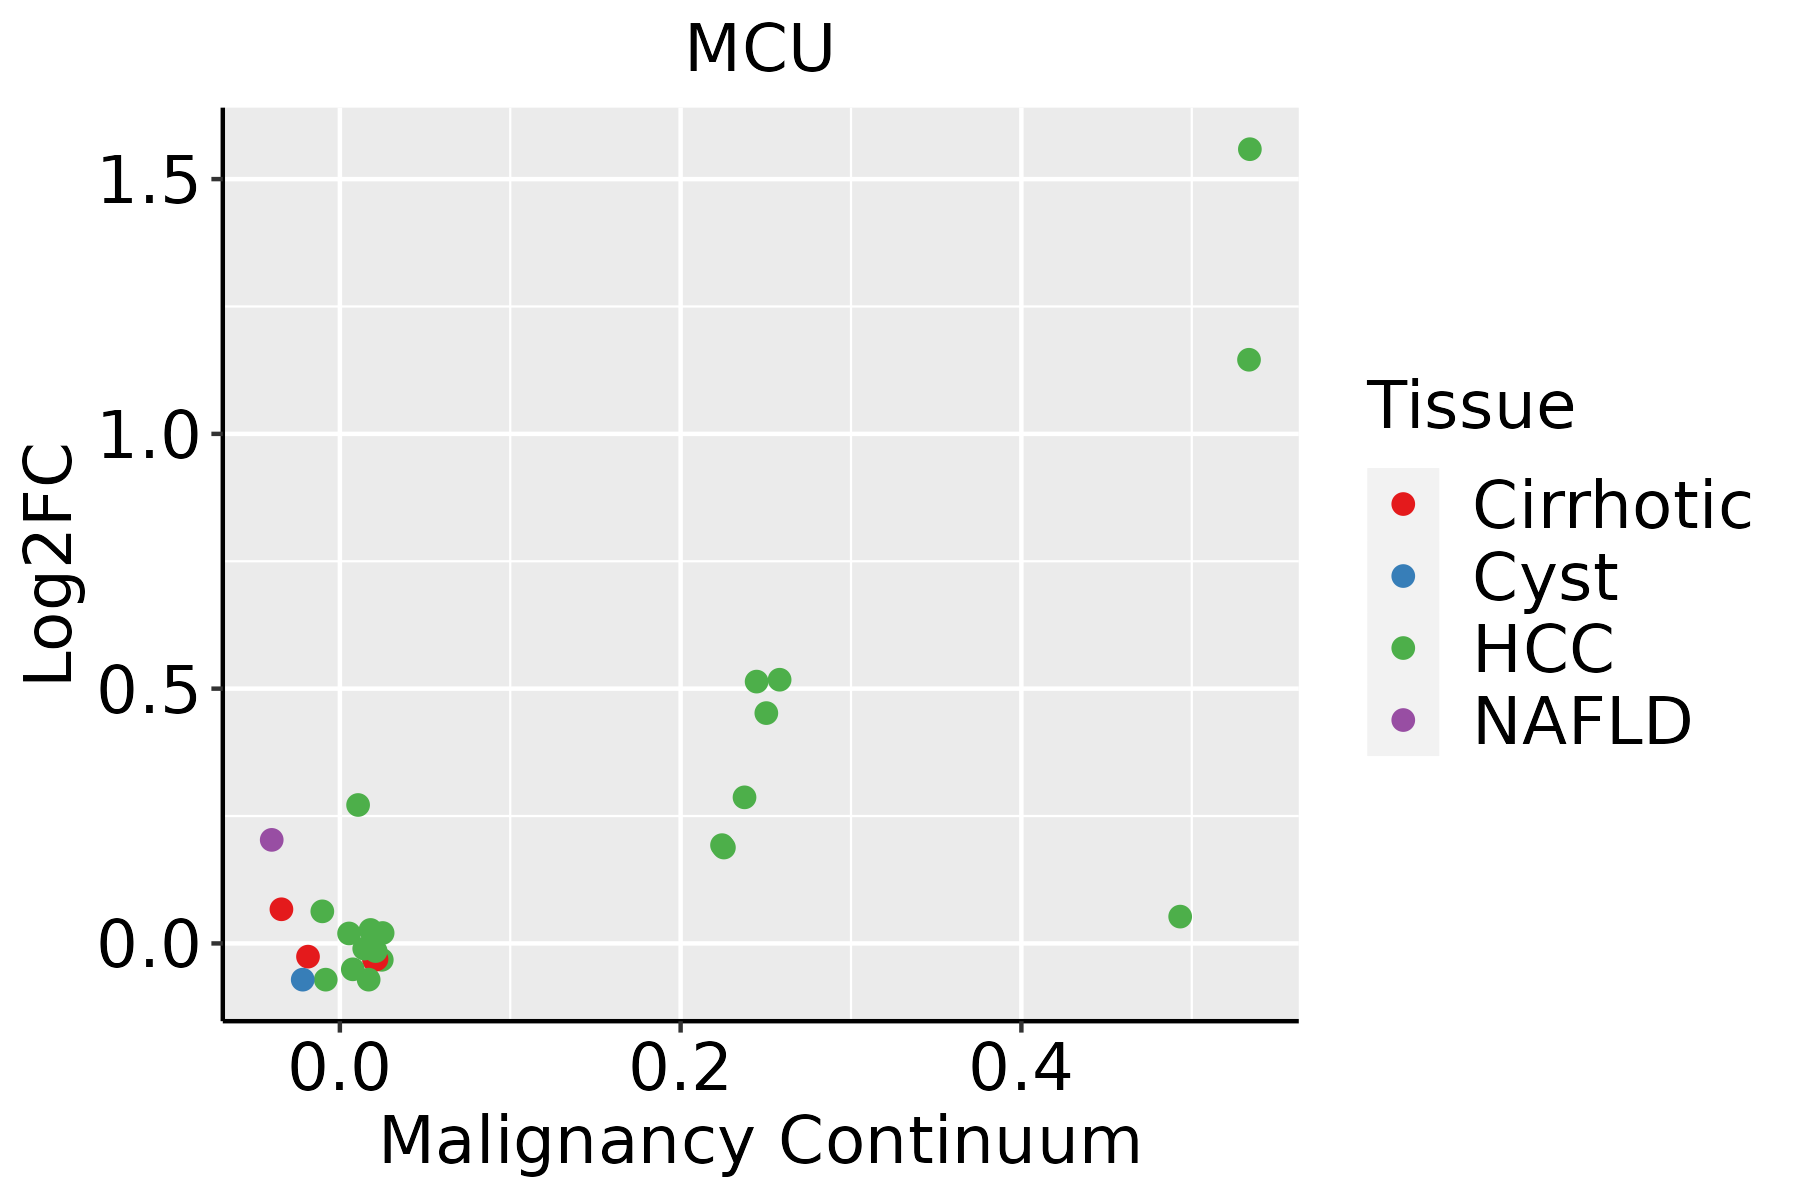 | HCC: Hepatocellular carcinoma |
| NAFLD: Non-alcoholic fatty liver disease | ||
| Lung | 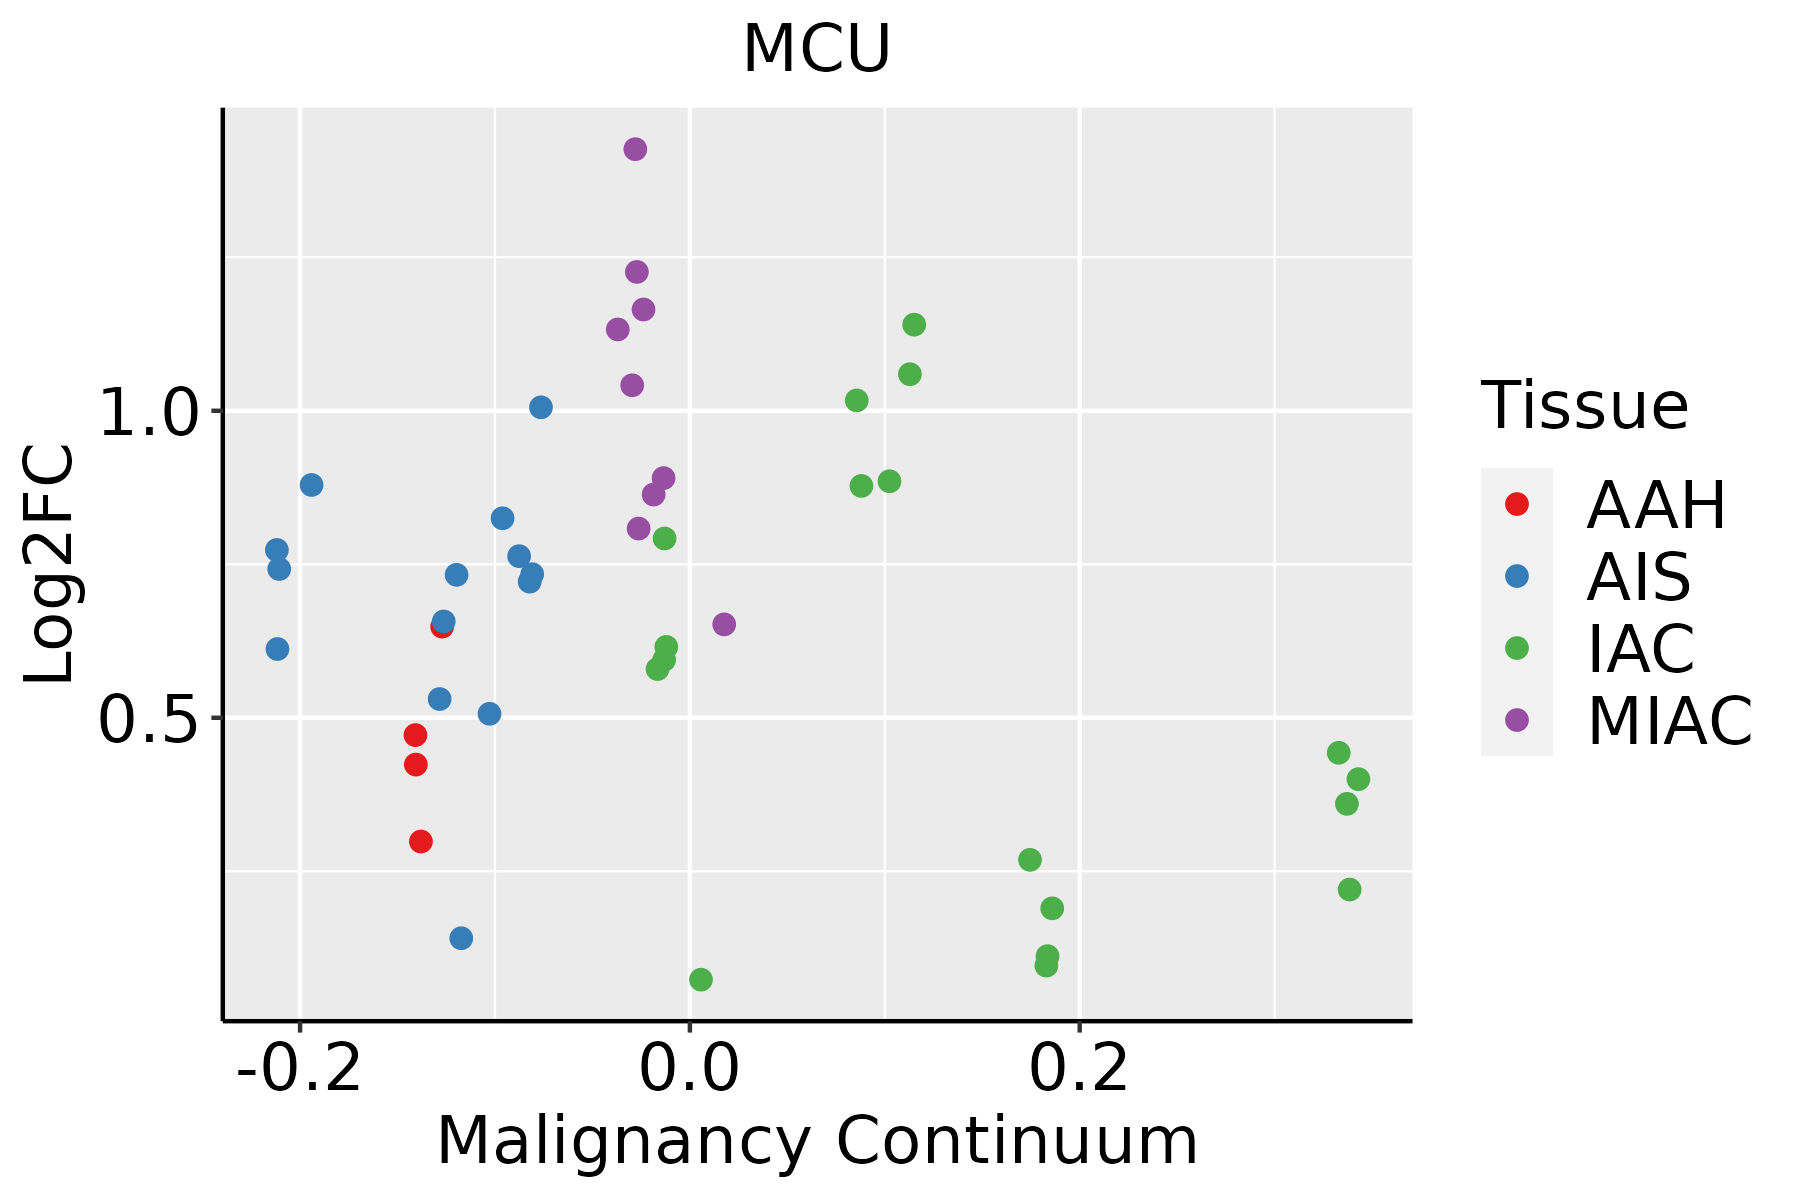 | AAH: Atypical adenomatous hyperplasia |
| AIS: Adenocarcinoma in situ | ||
| IAC: Invasive lung adenocarcinoma | ||
| MIA: Minimally invasive adenocarcinoma | ||
| Oral Cavity | 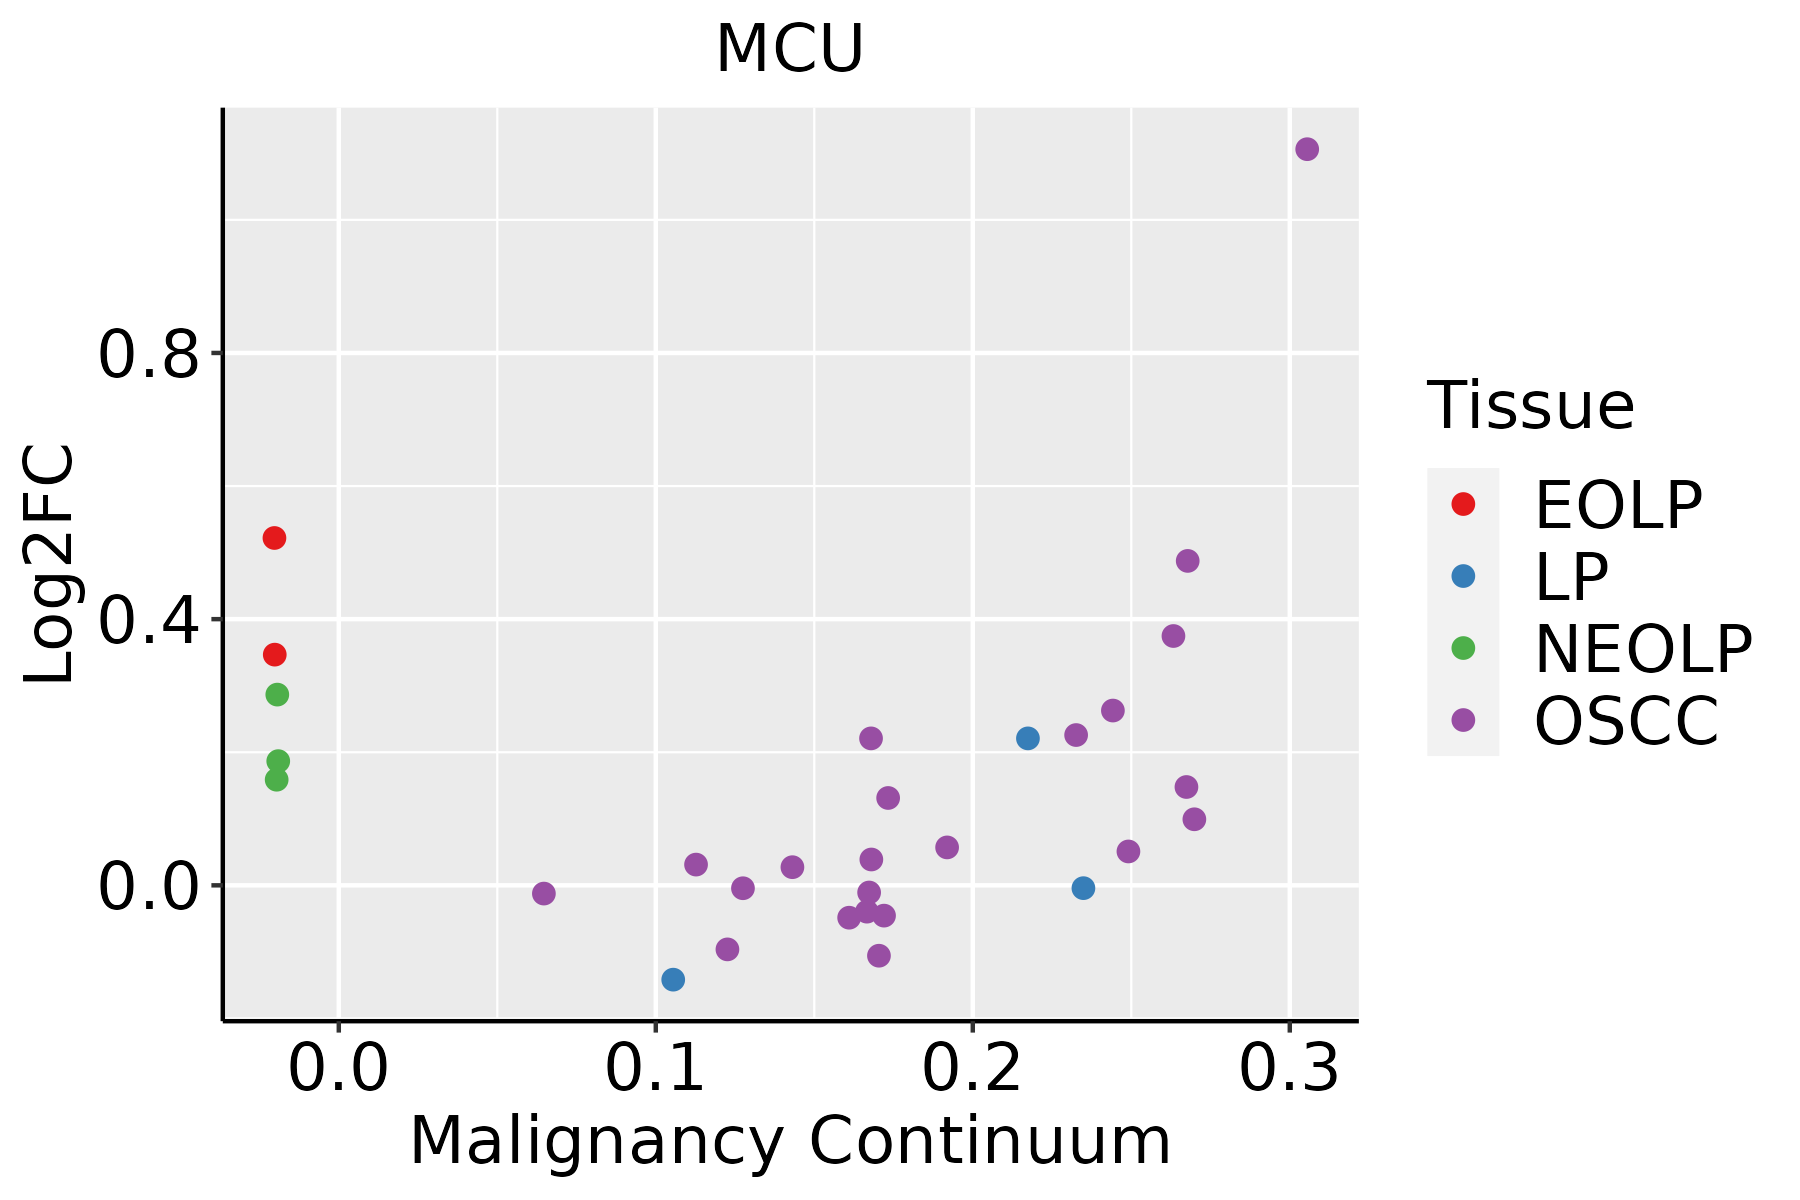 | EOLP: Erosive Oral lichen planus |
| LP: leukoplakia | ||
| NEOLP: Non-erosive oral lichen planus | ||
| OSCC: Oral squamous cell carcinoma | ||
| Thyroid | 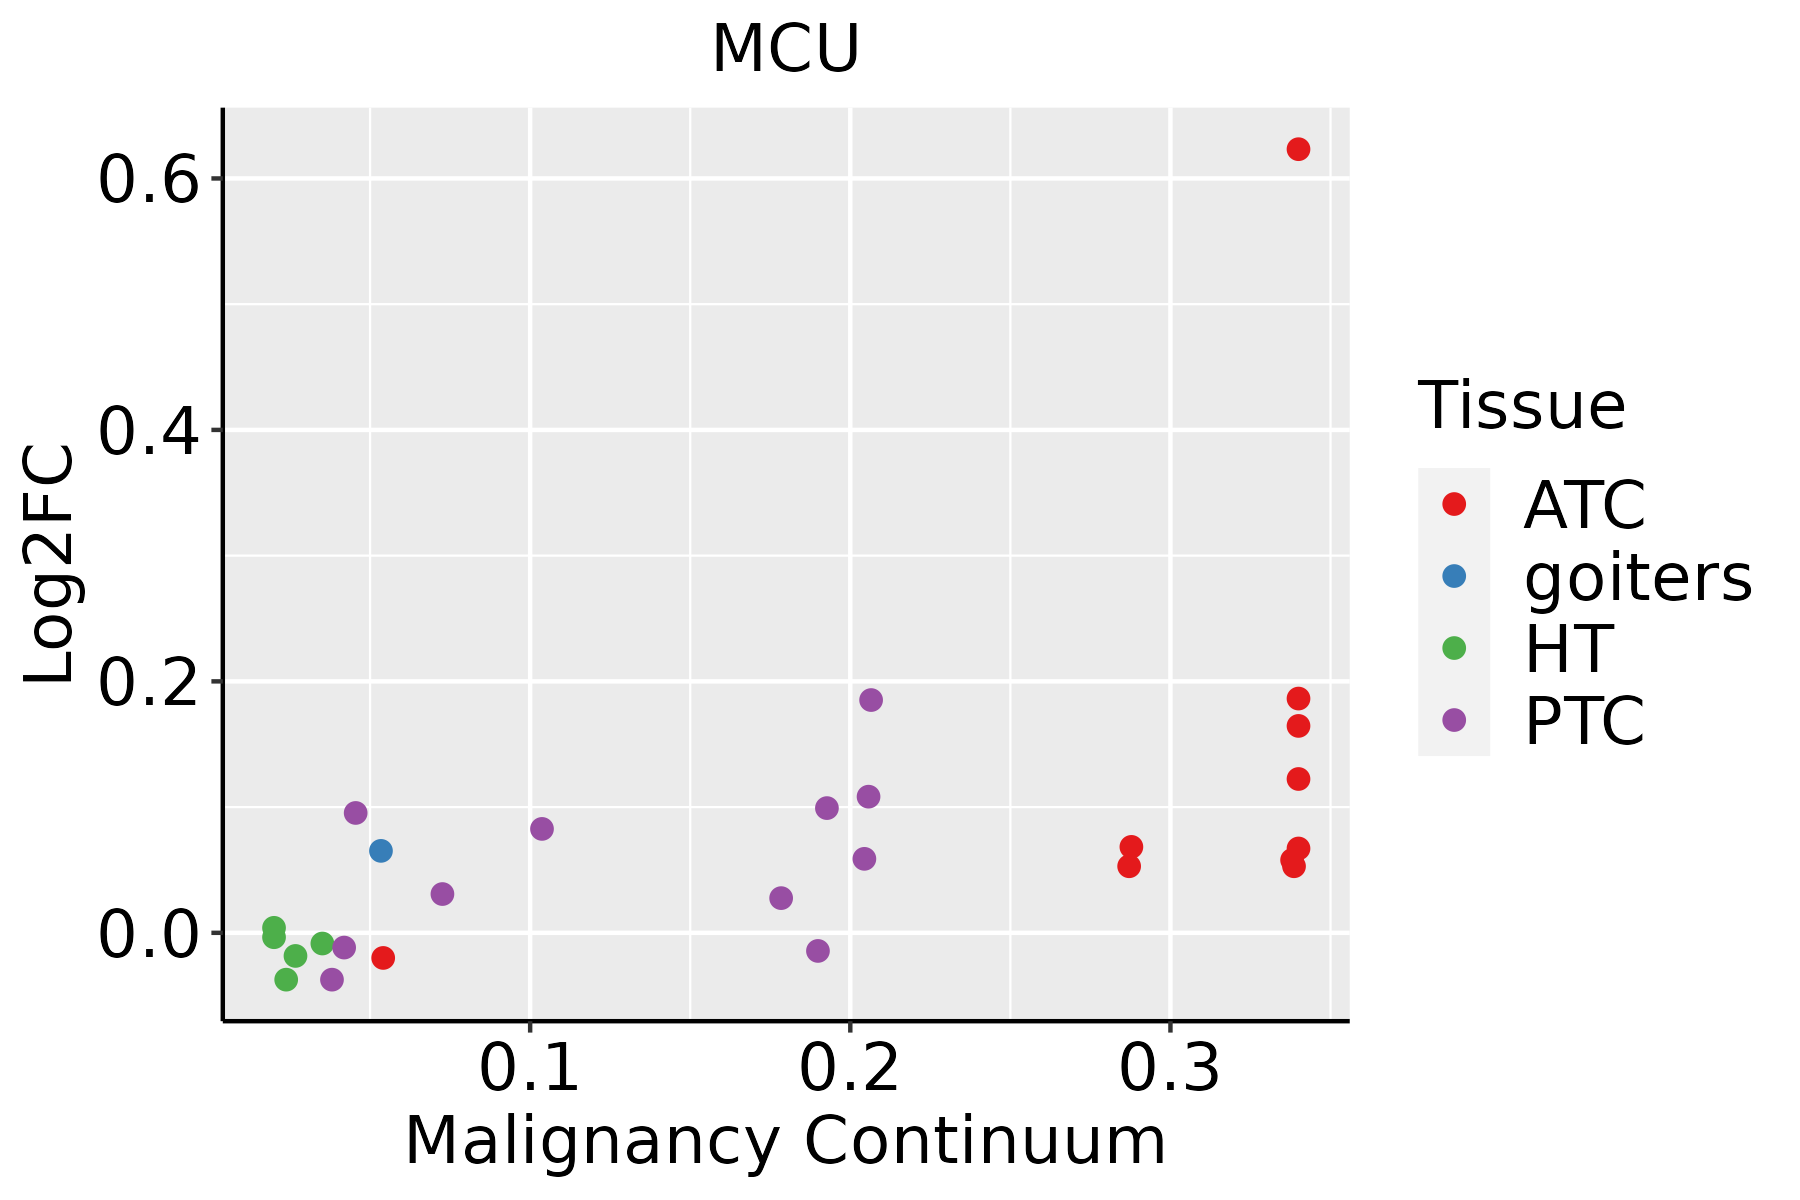 | ATC: Anaplastic thyroid cancer |
| HT: Hashimoto's thyroiditis | ||
| PTC: Papillary thyroid cancer |
| ∗log2FC in expression of this searched gene in stem-like cells from each diseased tissue sample relative to stem-like cells in normal samples in each tissue plotted against the malignancy continuum. Samples are colored based on if they are from different disease stage. |
Top |
Malignant transformation related pathway analysis |
| Find out the enriched GO biological processes and KEGG pathways involved in transition from healthy to precancer to cancer |
| Tissue | Disease Stage | Enriched GO biological Processes |
| Colorectum | AD |  |
| Colorectum | SER |  |
| Colorectum | MSS |  |
| Colorectum | MSI-H |  |
| Colorectum | FAP |  |
| ∗Top 15 enriched GO BP terms are showed in the bar plot of each disease state in each tissue. Each row represents a significant GO biological process which is colored according to the -log10(p.adjust). |
| Page: 1 2 3 4 5 6 7 8 9 |
| GO ID | Tissue | Disease Stage | Description | Gene Ratio | Bg Ratio | pvalue | p.adjust | Count |
| GO:005122216 | Endometrium | EEC | positive regulation of protein transport | 66/2168 | 303/18723 | 2.55e-07 | 1.09e-05 | 66 |
| GO:199054216 | Endometrium | EEC | mitochondrial transmembrane transport | 31/2168 | 102/18723 | 2.65e-07 | 1.11e-05 | 31 |
| GO:004259314 | Endometrium | EEC | glucose homeostasis | 56/2168 | 258/18723 | 2.26e-06 | 6.61e-05 | 56 |
| GO:003350014 | Endometrium | EEC | carbohydrate homeostasis | 56/2168 | 259/18723 | 2.56e-06 | 7.39e-05 | 56 |
| GO:005090013 | Endometrium | EEC | leukocyte migration | 67/2168 | 369/18723 | 1.19e-04 | 1.59e-03 | 67 |
| GO:005070813 | Endometrium | EEC | regulation of protein secretion | 50/2168 | 268/18723 | 4.33e-04 | 4.51e-03 | 50 |
| GO:000268513 | Endometrium | EEC | regulation of leukocyte migration | 41/2168 | 210/18723 | 5.35e-04 | 5.38e-03 | 41 |
| GO:005156112 | Endometrium | EEC | positive regulation of mitochondrial calcium ion concentration | 6/2168 | 11/18723 | 6.59e-04 | 6.37e-03 | 6 |
| GO:009752913 | Endometrium | EEC | myeloid leukocyte migration | 42/2168 | 220/18723 | 7.42e-04 | 7.02e-03 | 42 |
| GO:006032613 | Endometrium | EEC | cell chemotaxis | 55/2168 | 310/18723 | 8.22e-04 | 7.63e-03 | 55 |
| GO:001082115 | Endometrium | EEC | regulation of mitochondrion organization | 30/2168 | 144/18723 | 9.67e-04 | 8.64e-03 | 30 |
| GO:003059513 | Endometrium | EEC | leukocyte chemotaxis | 43/2168 | 230/18723 | 1.01e-03 | 8.89e-03 | 43 |
| GO:003210313 | Endometrium | EEC | positive regulation of response to external stimulus | 71/2168 | 427/18723 | 1.06e-03 | 9.18e-03 | 71 |
| GO:003202412 | Endometrium | EEC | positive regulation of insulin secretion | 19/2168 | 78/18723 | 1.19e-03 | 1.00e-02 | 19 |
| GO:000268813 | Endometrium | EEC | regulation of leukocyte chemotaxis | 26/2168 | 122/18723 | 1.45e-03 | 1.18e-02 | 26 |
| GO:000268713 | Endometrium | EEC | positive regulation of leukocyte migration | 28/2168 | 135/18723 | 1.50e-03 | 1.21e-02 | 28 |
| GO:005156012 | Endometrium | EEC | mitochondrial calcium ion homeostasis | 9/2168 | 26/18723 | 1.82e-03 | 1.41e-02 | 9 |
| GO:005071412 | Endometrium | EEC | positive regulation of protein secretion | 28/2168 | 137/18723 | 1.89e-03 | 1.45e-02 | 28 |
| GO:005079611 | Endometrium | EEC | regulation of insulin secretion | 32/2168 | 165/18723 | 2.30e-03 | 1.70e-02 | 32 |
| GO:005092112 | Endometrium | EEC | positive regulation of chemotaxis | 28/2168 | 141/18723 | 2.94e-03 | 2.07e-02 | 28 |
| Page: 1 2 3 4 5 6 7 8 9 10 11 12 13 14 15 16 17 18 19 20 21 22 23 24 25 26 27 |
| Pathway ID | Tissue | Disease Stage | Description | Gene Ratio | Bg Ratio | pvalue | p.adjust | qvalue | Count |
| hsa0501220 | Cervix | CC | Parkinson disease | 102/1267 | 266/8465 | 1.81e-21 | 1.47e-19 | 8.66e-20 | 102 |
| hsa0502018 | Cervix | CC | Prion disease | 98/1267 | 273/8465 | 2.64e-18 | 1.42e-16 | 8.42e-17 | 98 |
| hsa0501018 | Cervix | CC | Alzheimer disease | 113/1267 | 384/8465 | 9.67e-14 | 3.92e-12 | 2.32e-12 | 113 |
| hsa0502218 | Cervix | CC | Pathways of neurodegeneration - multiple diseases | 128/1267 | 476/8465 | 2.87e-12 | 9.29e-11 | 5.50e-11 | 128 |
| hsa0501418 | Cervix | CC | Amyotrophic lateral sclerosis | 103/1267 | 364/8465 | 1.79e-11 | 4.47e-10 | 2.64e-10 | 103 |
| hsa0421810 | Cervix | CC | Cellular senescence | 49/1267 | 156/8465 | 1.30e-07 | 1.63e-06 | 9.61e-07 | 49 |
| hsa0501716 | Cervix | CC | Spinocerebellar ataxia | 35/1267 | 143/8465 | 1.77e-03 | 7.21e-03 | 4.26e-03 | 35 |
| hsa046213 | Cervix | CC | NOD-like receptor signaling pathway | 41/1267 | 186/8465 | 5.90e-03 | 1.95e-02 | 1.15e-02 | 41 |
| hsa05012110 | Cervix | CC | Parkinson disease | 102/1267 | 266/8465 | 1.81e-21 | 1.47e-19 | 8.66e-20 | 102 |
| hsa0502019 | Cervix | CC | Prion disease | 98/1267 | 273/8465 | 2.64e-18 | 1.42e-16 | 8.42e-17 | 98 |
| hsa0501019 | Cervix | CC | Alzheimer disease | 113/1267 | 384/8465 | 9.67e-14 | 3.92e-12 | 2.32e-12 | 113 |
| hsa0502219 | Cervix | CC | Pathways of neurodegeneration - multiple diseases | 128/1267 | 476/8465 | 2.87e-12 | 9.29e-11 | 5.50e-11 | 128 |
| hsa0501419 | Cervix | CC | Amyotrophic lateral sclerosis | 103/1267 | 364/8465 | 1.79e-11 | 4.47e-10 | 2.64e-10 | 103 |
| hsa0421815 | Cervix | CC | Cellular senescence | 49/1267 | 156/8465 | 1.30e-07 | 1.63e-06 | 9.61e-07 | 49 |
| hsa0501717 | Cervix | CC | Spinocerebellar ataxia | 35/1267 | 143/8465 | 1.77e-03 | 7.21e-03 | 4.26e-03 | 35 |
| hsa0462112 | Cervix | CC | NOD-like receptor signaling pathway | 41/1267 | 186/8465 | 5.90e-03 | 1.95e-02 | 1.15e-02 | 41 |
| hsa05012 | Colorectum | AD | Parkinson disease | 147/2092 | 266/8465 | 2.53e-27 | 8.48e-25 | 5.41e-25 | 147 |
| hsa05010 | Colorectum | AD | Alzheimer disease | 174/2092 | 384/8465 | 1.82e-19 | 9.26e-18 | 5.91e-18 | 174 |
| hsa05020 | Colorectum | AD | Prion disease | 133/2092 | 273/8465 | 2.47e-18 | 8.29e-17 | 5.29e-17 | 133 |
| hsa05014 | Colorectum | AD | Amyotrophic lateral sclerosis | 164/2092 | 364/8465 | 4.28e-18 | 1.27e-16 | 8.09e-17 | 164 |
| Page: 1 2 3 4 5 6 7 8 9 10 11 12 |
Top |
Cell-cell communication analysis |
| Identification of potential cell-cell interactions between two cell types and their ligand-receptor pairs for different disease states |
| Ligand | Receptor | LRpair | Pathway | Tissue | Disease Stage |
| Page: 1 |
Top |
Single-cell gene regulatory network inference analysis |
| Find out the significant the regulons (TFs) and the target genes of each regulon across cell types for different disease states |
| TF | Cell Type | Tissue | Disease Stage | Target Gene | RSS | Regulon Activity |
| ∗The dot plots of a searched regulon are shown for all cell subpopulations in each disease state of each tissue based on the regulon specific score inferred using pySCENIC and by calculating the average expression. |
| Page: 1 |
Top |
Somatic mutation of malignant transformation related genes |
| Annotation of somatic variants for genes involved in malignant transformation |
| Hugo Symbol | Variant Class | Variant Classification | dbSNP RS | HGVSc | HGVSp | HGVSp Short | SWISSPROT | BIOTYPE | SIFT | PolyPhen | Tumor Sample Barcode | Tissue | Histology | Sex | Age | Stage | Therapy Types | Drugs | Outcome |
| MCU | SNV | Missense_Mutation | novel | c.10G>A | p.Ala4Thr | p.A4T | Q8NE86 | protein_coding | tolerated_low_confidence(0.61) | benign(0.001) | TCGA-2W-A8YY-01 | Cervix | cervical & endocervical cancer | Female | <65 | I/II | Chemotherapy | cisplatin | CR |
| MCU | SNV | Missense_Mutation | novel | c.730N>A | p.Ala244Thr | p.A244T | Q8NE86 | protein_coding | deleterious(0.05) | possibly_damaging(0.771) | TCGA-AA-A01K-01 | Colorectum | colon adenocarcinoma | Female | >=65 | III/IV | Chemotherapy | folinic | CR |
| MCU | SNV | Missense_Mutation | novel | c.494G>T | p.Arg165Ile | p.R165I | Q8NE86 | protein_coding | deleterious(0.04) | benign(0.246) | TCGA-AZ-4315-01 | Colorectum | colon adenocarcinoma | Male | <65 | I/II | Unknown | Unknown | SD |
| MCU | SNV | Missense_Mutation | rs760003771 | c.721G>A | p.Ala241Thr | p.A241T | Q8NE86 | protein_coding | deleterious(0) | probably_damaging(0.978) | TCGA-CK-5916-01 | Colorectum | colon adenocarcinoma | Female | >=65 | I/II | Unknown | Unknown | PD |
| MCU | SNV | Missense_Mutation | rs770146478 | c.857N>A | p.Arg286His | p.R286H | Q8NE86 | protein_coding | deleterious(0) | possibly_damaging(0.883) | TCGA-AG-A002-01 | Colorectum | rectum adenocarcinoma | Male | <65 | I/II | Unknown | Unknown | SD |
| MCU | insertion | Frame_Shift_Ins | novel | c.952_953insTATGT | p.Asn318IlefsTer19 | p.N318Ifs*19 | Q8NE86 | protein_coding | TCGA-AM-5820-01 | Colorectum | colon adenocarcinoma | Female | <65 | I/II | Unknown | Unknown | SD | ||
| MCU | SNV | Missense_Mutation | novel | c.767N>T | p.Trp256Leu | p.W256L | Q8NE86 | protein_coding | deleterious(0) | probably_damaging(0.968) | TCGA-A5-A0G2-01 | Endometrium | uterine corpus endometrioid carcinoma | Female | <65 | III/IV | Unknown | Unknown | SD |
| MCU | SNV | Missense_Mutation | c.884N>T | p.Arg295Ile | p.R295I | Q8NE86 | protein_coding | deleterious(0) | possibly_damaging(0.756) | TCGA-AP-A0LM-01 | Endometrium | uterine corpus endometrioid carcinoma | Female | <65 | III/IV | Chemotherapy | cisplatin | SD | |
| MCU | SNV | Missense_Mutation | c.376N>A | p.Ala126Thr | p.A126T | Q8NE86 | protein_coding | tolerated(0.13) | benign(0.135) | TCGA-AX-A05S-01 | Endometrium | uterine corpus endometrioid carcinoma | Female | >=65 | III/IV | Unspecific | Carboplatin & Paclitaxel | PD | |
| MCU | SNV | Missense_Mutation | novel | c.424N>T | p.Asp142Tyr | p.D142Y | Q8NE86 | protein_coding | deleterious(0) | benign(0.403) | TCGA-AX-A05Z-01 | Endometrium | uterine corpus endometrioid carcinoma | Female | <65 | III/IV | Chemotherapy | adriamycin | SD |
| Page: 1 2 3 |
Top |
Related drugs of malignant transformation related genes |
| Identification of chemicals and drugs interact with genes involved in malignant transfromation |
| (DGIdb 4.0) |
| Entrez ID | Symbol | Category | Interaction Types | Drug Claim Name | Drug Name | PMIDs |
| Page: 1 |

Copyright 2023-Present -The University of Texas Health Science Center at Houston |