
|
|||||
|
 | |
| |
| |
| |
| |
| |
|
Gene: MAPKAP1 |
Gene summary for MAPKAP1 |
| Gene information | Species | Human | Gene symbol | MAPKAP1 | Gene ID | 79109 |
| Gene name | MAPK associated protein 1 | |
| Gene Alias | JC310 | |
| Cytomap | 9q33.3 | |
| Gene Type | protein-coding | GO ID | GO:0001932 | UniProtAcc | Q9BPZ7 |
Top |
Malignant transformation analysis |
| Identification of the aberrant gene expression in precancerous and cancerous lesions by comparing the gene expression of stem-like cells in diseased tissues with normal stem cells |
| Entrez ID | Symbol | Replicates | Species | Organ | Tissue | Adj P-value | Log2FC | Malignancy |
| 79109 | MAPKAP1 | CCI_2 | Human | Cervix | CC | 2.19e-12 | 1.38e+00 | 0.5249 |
| 79109 | MAPKAP1 | CCI_3 | Human | Cervix | CC | 4.16e-13 | 1.09e+00 | 0.516 |
| 79109 | MAPKAP1 | HTA11_3410_2000001011 | Human | Colorectum | AD | 2.39e-05 | -4.58e-01 | 0.0155 |
| 79109 | MAPKAP1 | HTA11_2487_2000001011 | Human | Colorectum | SER | 1.25e-03 | -2.93e-01 | -0.1808 |
| 79109 | MAPKAP1 | HTA11_3361_2000001011 | Human | Colorectum | AD | 3.65e-04 | -4.92e-01 | -0.1207 |
| 79109 | MAPKAP1 | HTA11_696_2000001011 | Human | Colorectum | AD | 4.88e-02 | -2.07e-01 | -0.1464 |
| 79109 | MAPKAP1 | HTA11_866_2000001011 | Human | Colorectum | AD | 4.05e-02 | -2.20e-01 | -0.1001 |
| 79109 | MAPKAP1 | HTA11_866_3004761011 | Human | Colorectum | AD | 1.16e-05 | -4.87e-01 | 0.096 |
| 79109 | MAPKAP1 | HTA11_10711_2000001011 | Human | Colorectum | AD | 1.46e-02 | -4.62e-01 | 0.0338 |
| 79109 | MAPKAP1 | HTA11_7696_3000711011 | Human | Colorectum | AD | 2.39e-04 | -2.70e-01 | 0.0674 |
| 79109 | MAPKAP1 | HTA11_99999970781_79442 | Human | Colorectum | MSS | 5.26e-11 | -3.95e-01 | 0.294 |
| 79109 | MAPKAP1 | HTA11_99999974143_84620 | Human | Colorectum | MSS | 1.35e-15 | -4.69e-01 | 0.3005 |
| 79109 | MAPKAP1 | A002-C-010 | Human | Colorectum | FAP | 2.07e-04 | -7.31e-02 | 0.242 |
| 79109 | MAPKAP1 | A001-C-207 | Human | Colorectum | FAP | 2.22e-05 | -4.08e-01 | 0.1278 |
| 79109 | MAPKAP1 | A015-C-203 | Human | Colorectum | FAP | 3.19e-33 | -5.10e-01 | -0.1294 |
| 79109 | MAPKAP1 | A015-C-204 | Human | Colorectum | FAP | 2.61e-05 | -3.93e-01 | -0.0228 |
| 79109 | MAPKAP1 | A014-C-040 | Human | Colorectum | FAP | 1.97e-05 | -6.02e-01 | -0.1184 |
| 79109 | MAPKAP1 | A002-C-201 | Human | Colorectum | FAP | 8.16e-11 | -3.73e-01 | 0.0324 |
| 79109 | MAPKAP1 | A002-C-203 | Human | Colorectum | FAP | 8.52e-05 | -1.83e-01 | 0.2786 |
| 79109 | MAPKAP1 | A001-C-119 | Human | Colorectum | FAP | 6.73e-15 | -7.08e-01 | -0.1557 |
| Page: 1 2 3 4 5 6 7 8 |
| Tissue | Expression Dynamics | Abbreviation |
| Cervix | 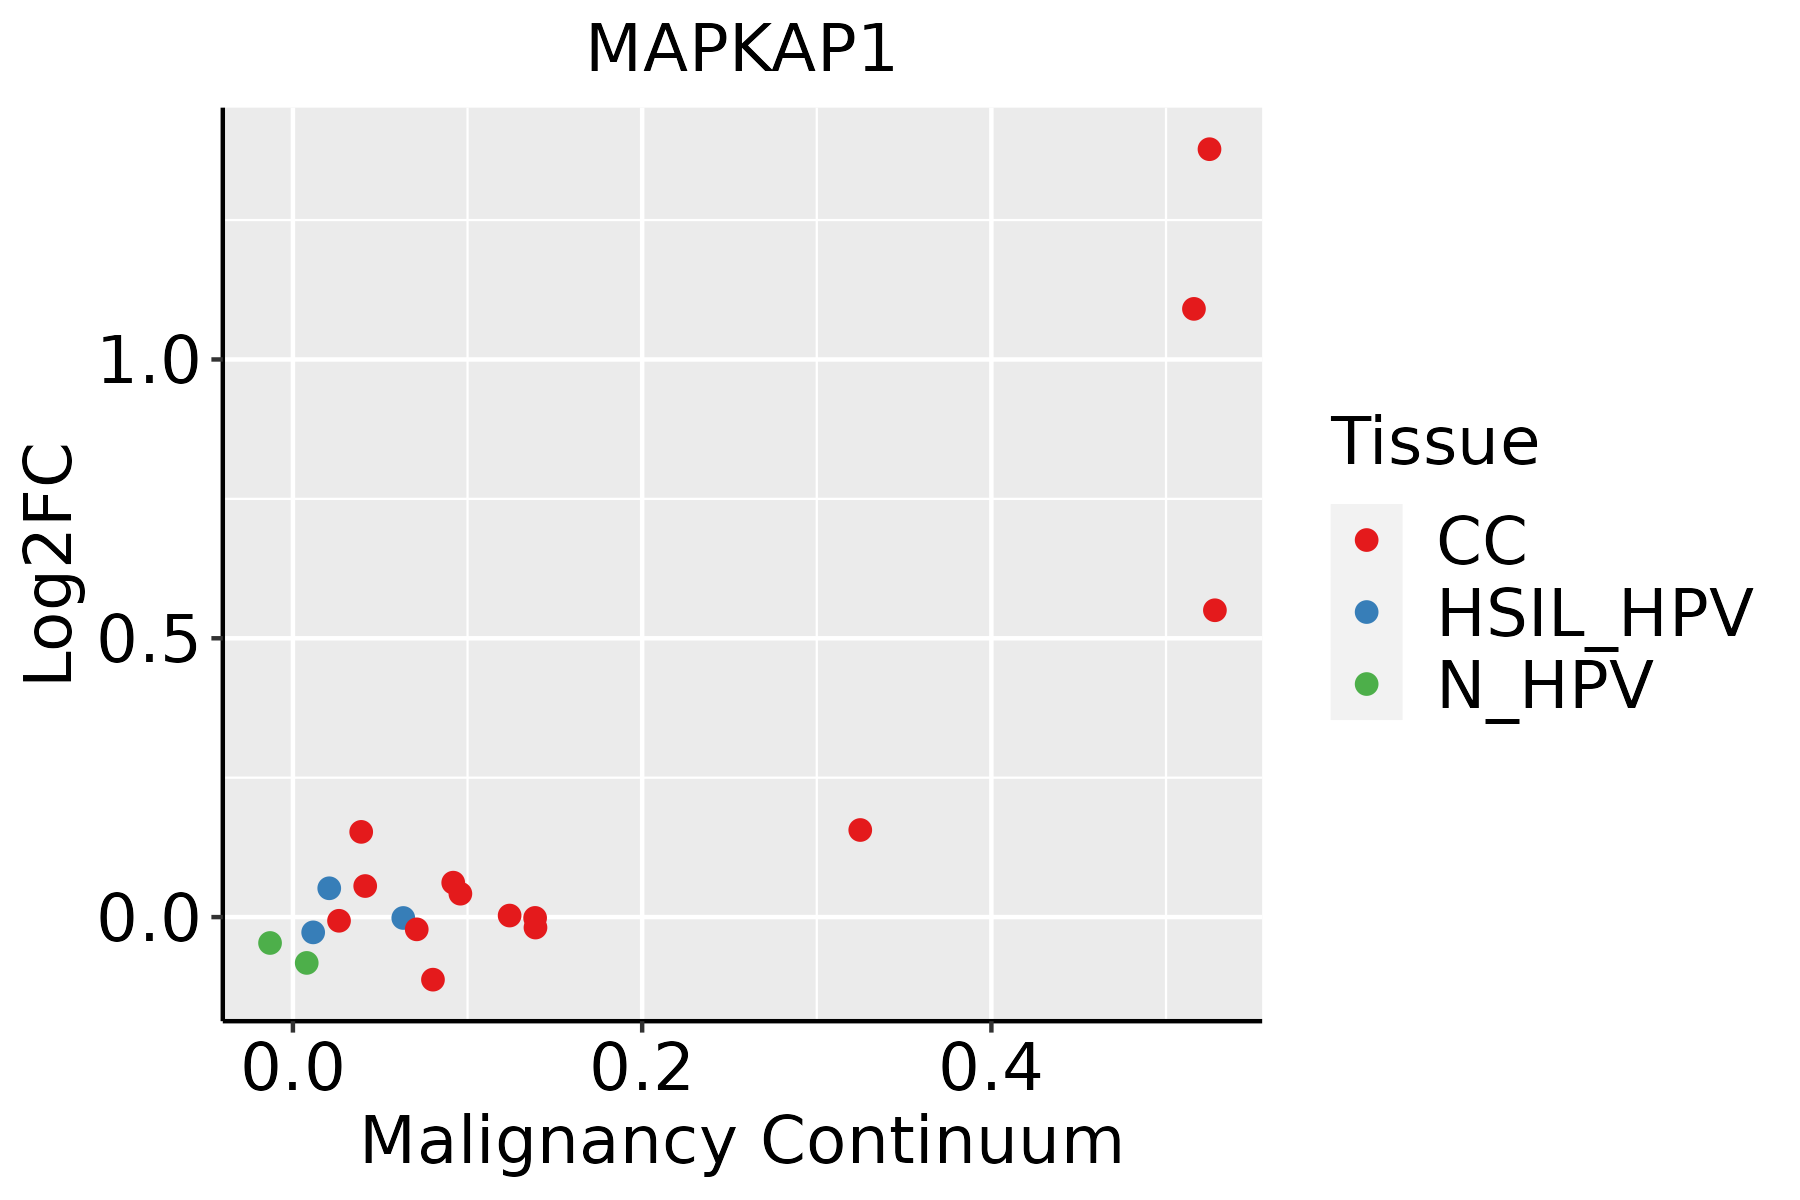 | CC: Cervix cancer |
| HSIL_HPV: HPV-infected high-grade squamous intraepithelial lesions | ||
| N_HPV: HPV-infected normal cervix | ||
| Colorectum (GSE201348) |  | FAP: Familial adenomatous polyposis |
| CRC: Colorectal cancer | ||
| Colorectum (HTA11) | 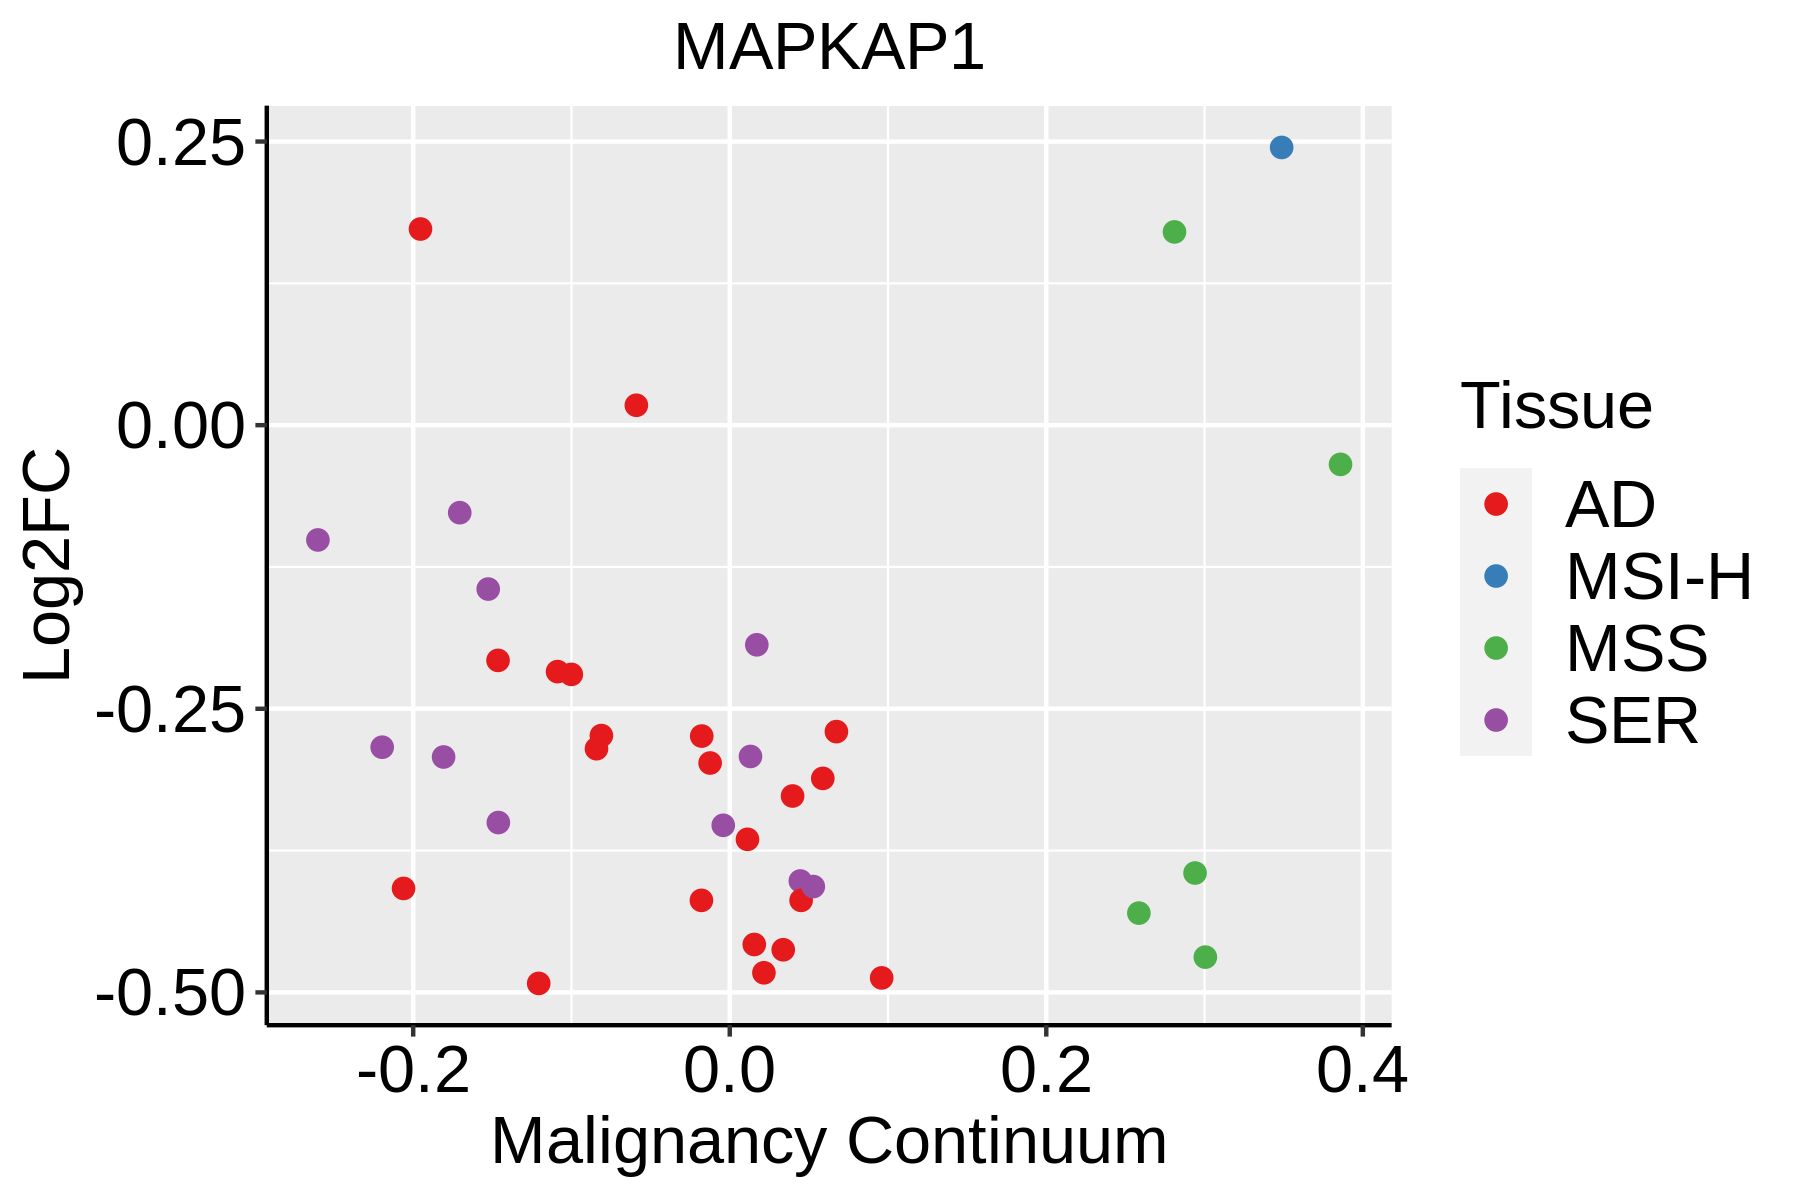 | AD: Adenomas |
| SER: Sessile serrated lesions | ||
| MSI-H: Microsatellite-high colorectal cancer | ||
| MSS: Microsatellite stable colorectal cancer | ||
| Esophagus |  | ESCC: Esophageal squamous cell carcinoma |
| HGIN: High-grade intraepithelial neoplasias | ||
| LGIN: Low-grade intraepithelial neoplasias | ||
| Liver |  | HCC: Hepatocellular carcinoma |
| NAFLD: Non-alcoholic fatty liver disease | ||
| Oral Cavity | 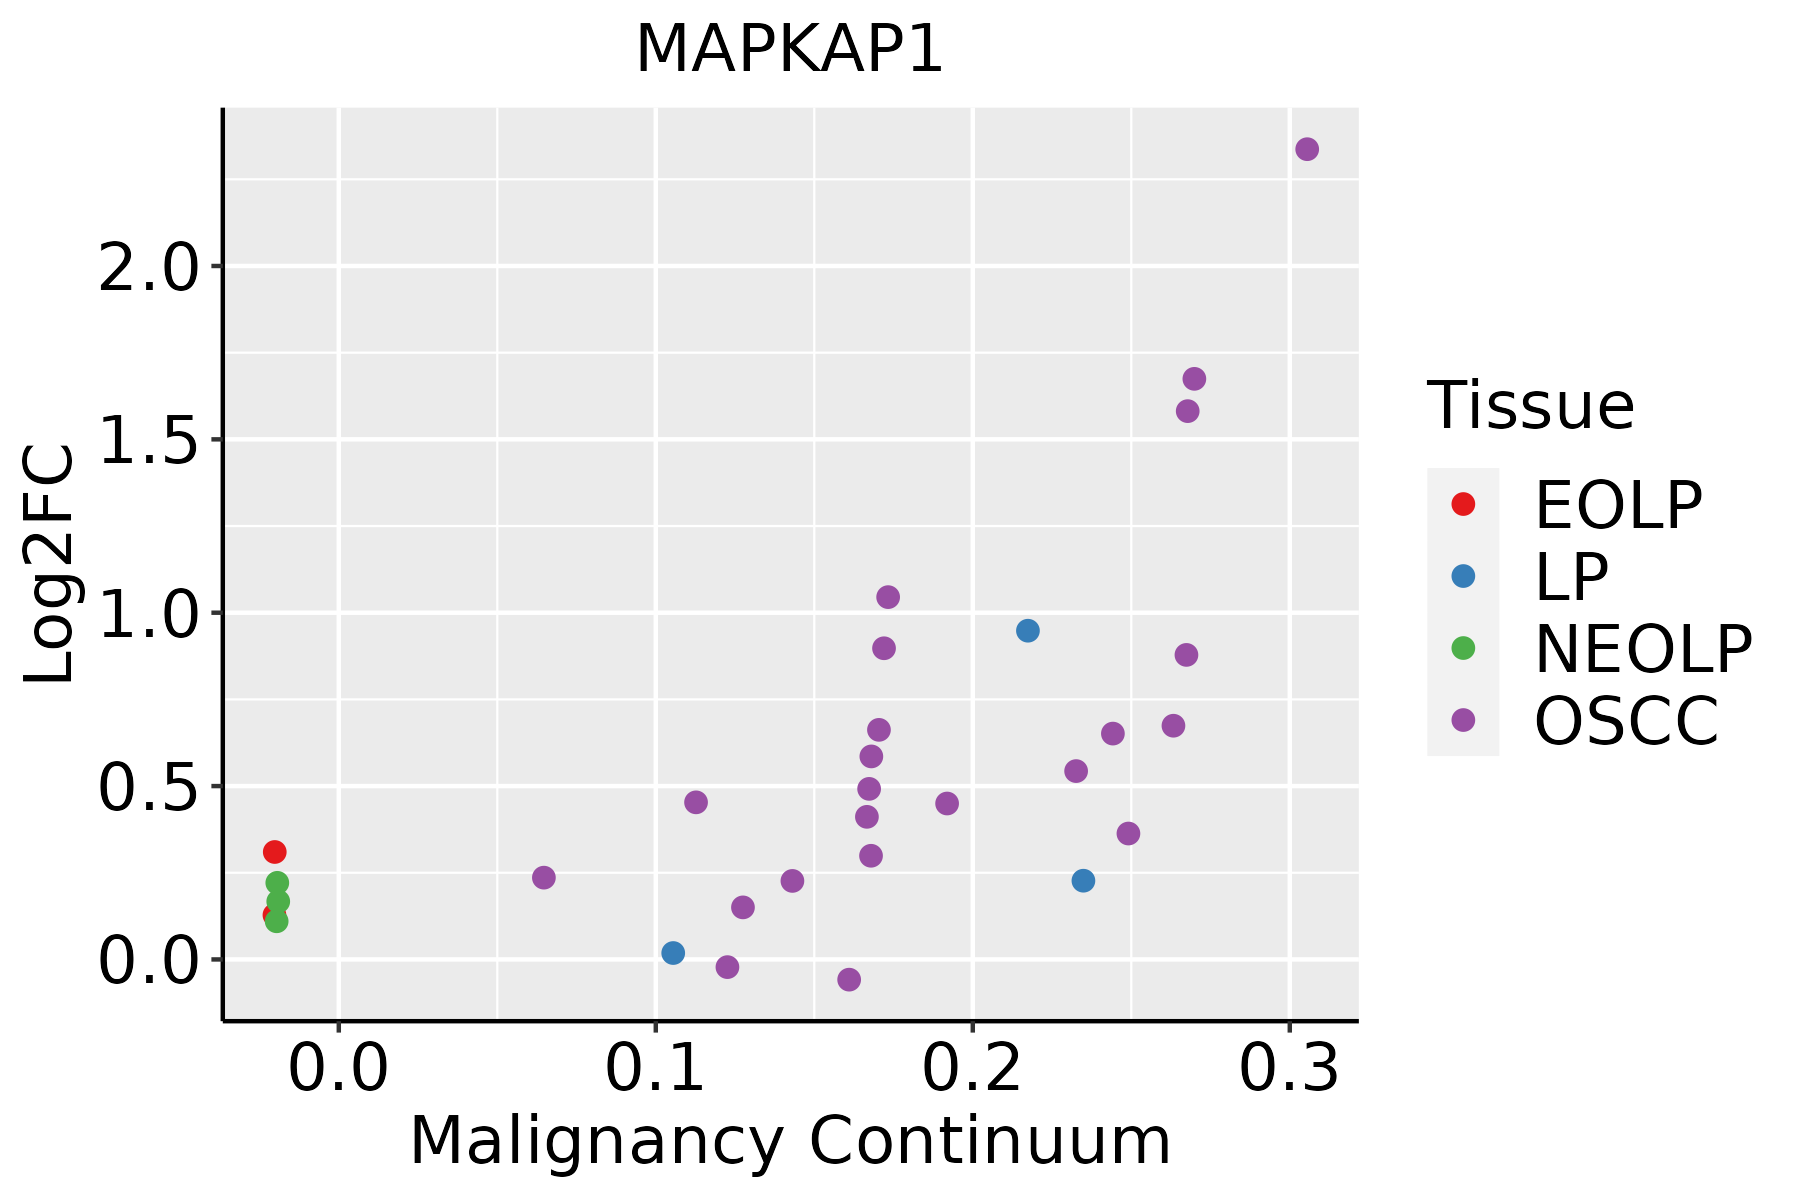 | EOLP: Erosive Oral lichen planus |
| LP: leukoplakia | ||
| NEOLP: Non-erosive oral lichen planus | ||
| OSCC: Oral squamous cell carcinoma | ||
| Prostate | 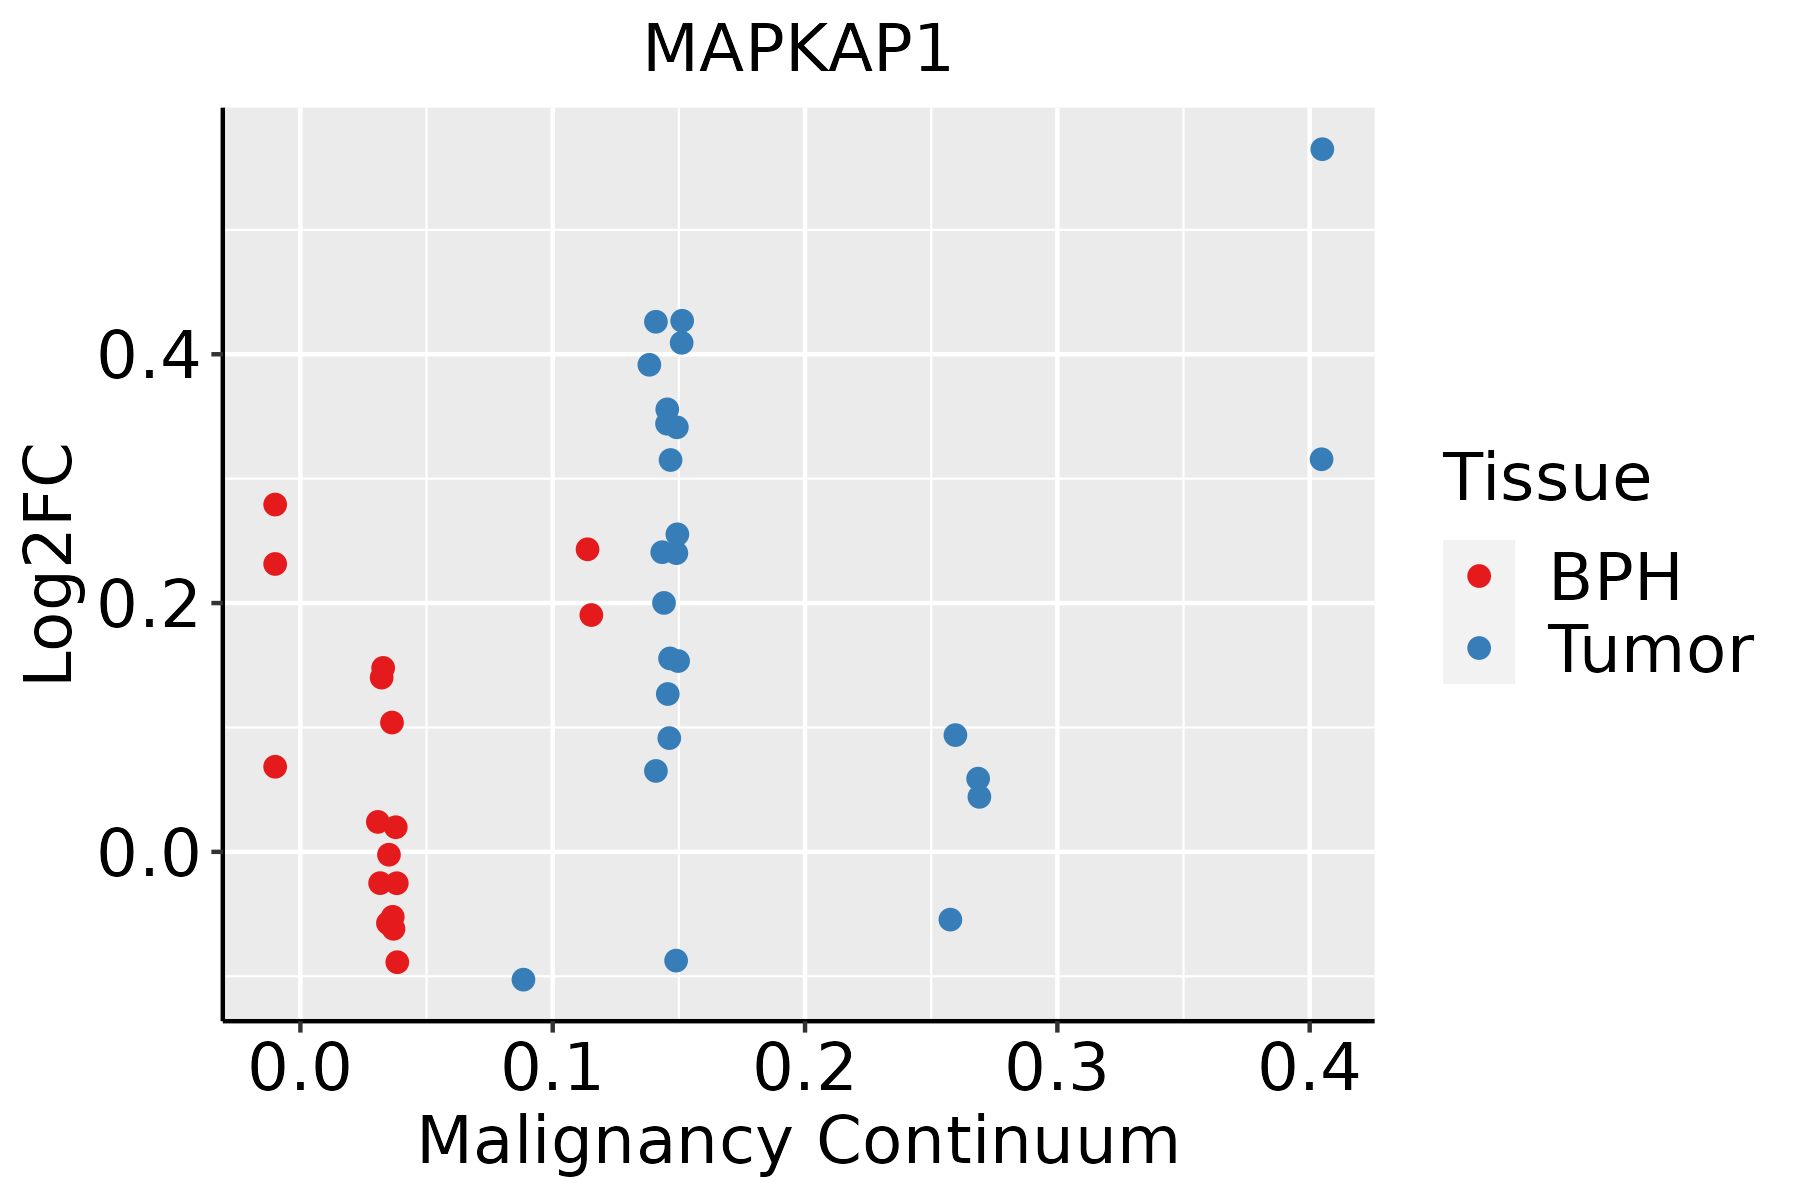 | BPH: Benign Prostatic Hyperplasia |
| Skin |  | AK: Actinic keratosis |
| cSCC: Cutaneous squamous cell carcinoma | ||
| SCCIS:squamous cell carcinoma in situ | ||
| Thyroid | 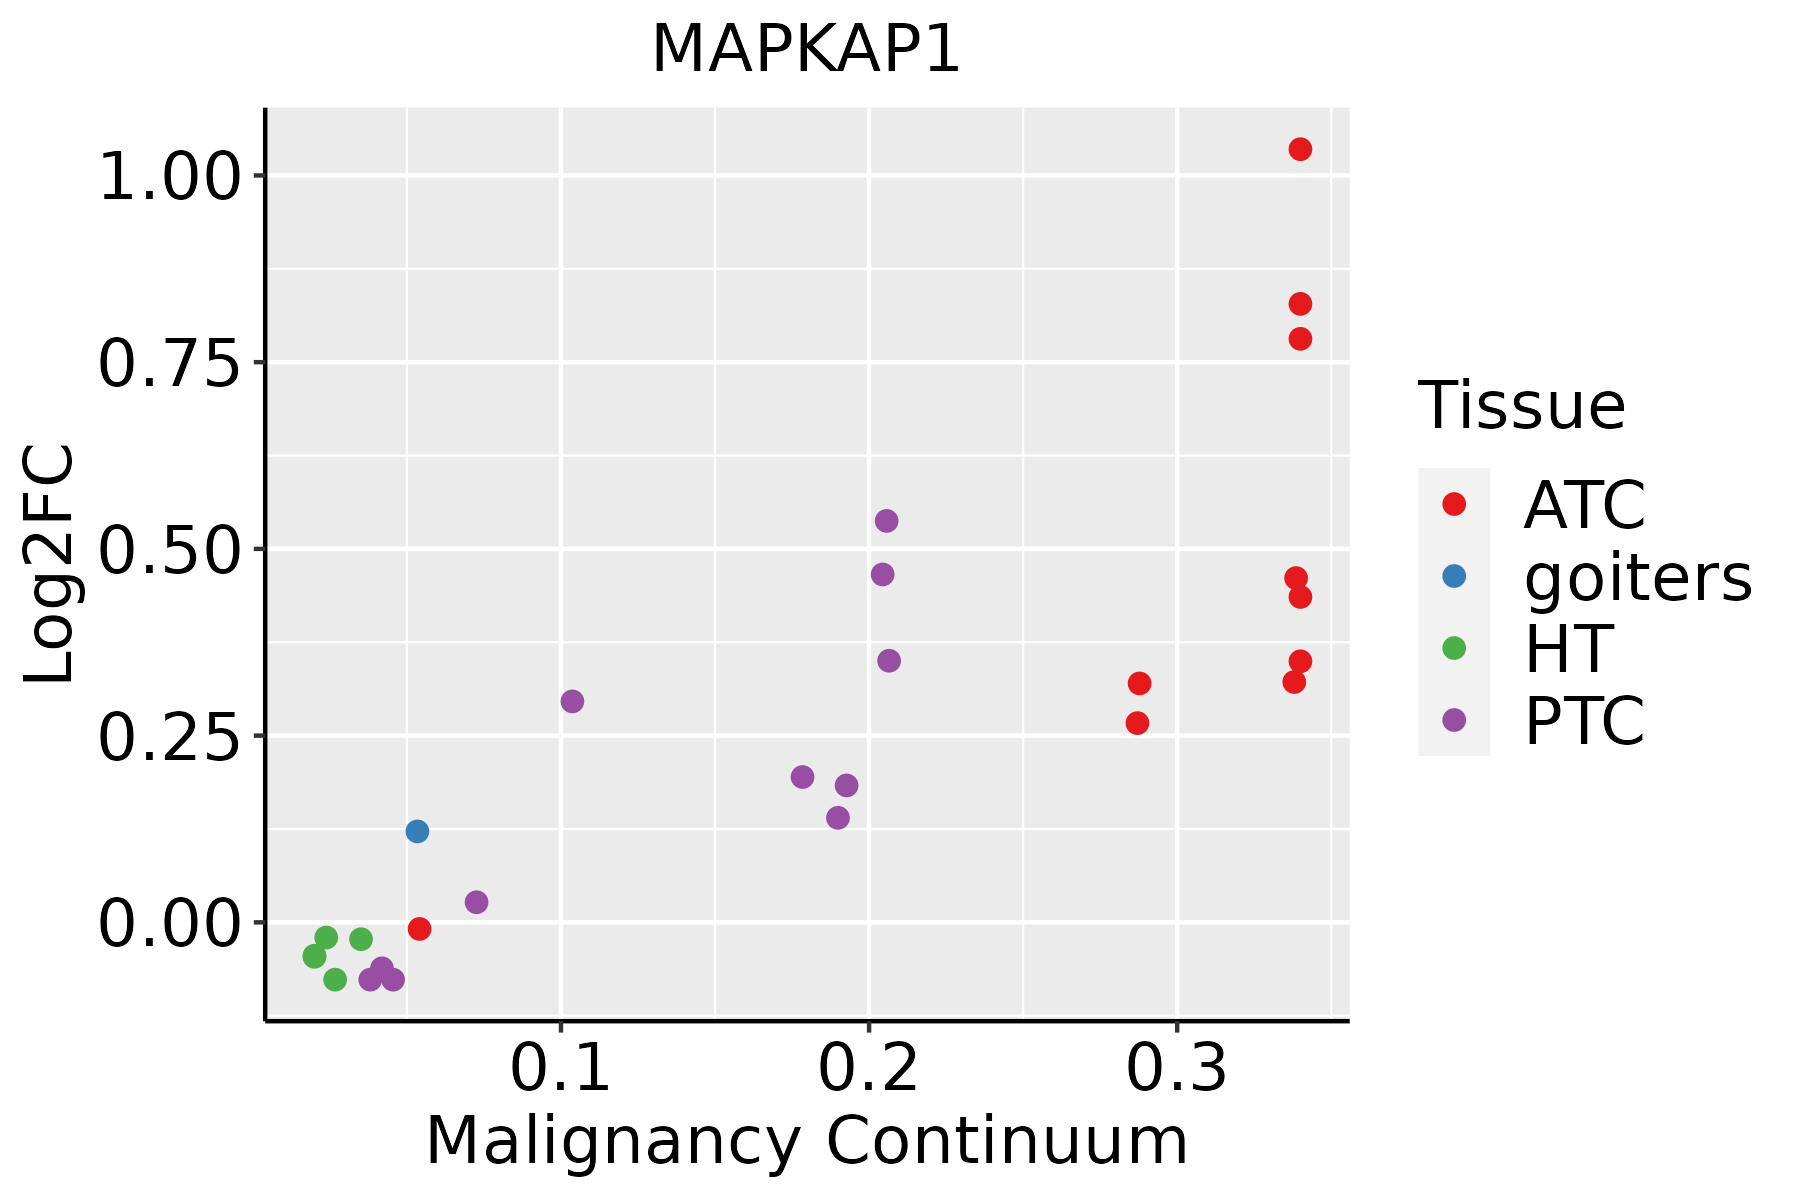 | ATC: Anaplastic thyroid cancer |
| HT: Hashimoto's thyroiditis | ||
| PTC: Papillary thyroid cancer |
| ∗log2FC in expression of this searched gene in stem-like cells from each diseased tissue sample relative to stem-like cells in normal samples in each tissue plotted against the malignancy continuum. Samples are colored based on if they are from different disease stage. |
Top |
Malignant transformation related pathway analysis |
| Find out the enriched GO biological processes and KEGG pathways involved in transition from healthy to precancer to cancer |
| Tissue | Disease Stage | Enriched GO biological Processes |
| Colorectum | AD |  |
| Colorectum | SER |  |
| Colorectum | MSS |  |
| Colorectum | MSI-H |  |
| Colorectum | FAP |  |
| ∗Top 15 enriched GO BP terms are showed in the bar plot of each disease state in each tissue. Each row represents a significant GO biological process which is colored according to the -log10(p.adjust). |
| Page: 1 2 3 4 5 6 7 8 9 |
| GO ID | Tissue | Disease Stage | Description | Gene Ratio | Bg Ratio | pvalue | p.adjust | Count |
| GO:001820923 | Skin | cSCC | peptidyl-serine modification | 108/4864 | 338/18723 | 7.73e-03 | 3.60e-02 | 108 |
| GO:0006979113 | Thyroid | PTC | response to oxidative stress | 234/5968 | 446/18723 | 6.97e-20 | 9.77e-18 | 234 |
| GO:0062197113 | Thyroid | PTC | cellular response to chemical stress | 180/5968 | 337/18723 | 1.36e-16 | 1.16e-14 | 180 |
| GO:0034599113 | Thyroid | PTC | cellular response to oxidative stress | 151/5968 | 288/18723 | 2.82e-13 | 1.43e-11 | 151 |
| GO:000726519 | Thyroid | PTC | Ras protein signal transduction | 162/5968 | 337/18723 | 3.16e-10 | 1.02e-08 | 162 |
| GO:0021762112 | Thyroid | PTC | substantia nigra development | 31/5968 | 44/18723 | 1.70e-07 | 3.19e-06 | 31 |
| GO:001810518 | Thyroid | PTC | peptidyl-serine phosphorylation | 143/5968 | 315/18723 | 2.94e-07 | 5.04e-06 | 143 |
| GO:001820916 | Thyroid | PTC | peptidyl-serine modification | 151/5968 | 338/18723 | 4.61e-07 | 7.51e-06 | 151 |
| GO:005105617 | Thyroid | PTC | regulation of small GTPase mediated signal transduction | 132/5968 | 302/18723 | 9.26e-06 | 1.04e-04 | 132 |
| GO:004657817 | Thyroid | PTC | regulation of Ras protein signal transduction | 88/5968 | 189/18723 | 1.62e-05 | 1.70e-04 | 88 |
| GO:0030901111 | Thyroid | PTC | midbrain development | 48/5968 | 90/18723 | 1.95e-05 | 1.99e-04 | 48 |
| GO:00510586 | Thyroid | PTC | negative regulation of small GTPase mediated signal transduction | 31/5968 | 56/18723 | 2.32e-04 | 1.68e-03 | 31 |
| GO:0048857110 | Thyroid | PTC | neural nucleus development | 34/5968 | 64/18723 | 3.38e-04 | 2.33e-03 | 34 |
| GO:00465805 | Thyroid | PTC | negative regulation of Ras protein signal transduction | 27/5968 | 49/18723 | 6.38e-04 | 4.02e-03 | 27 |
| GO:00319295 | Thyroid | PTC | TOR signaling | 57/5968 | 126/18723 | 1.12e-03 | 6.56e-03 | 57 |
| GO:00382032 | Thyroid | PTC | TORC2 signaling | 9/5968 | 12/18723 | 2.72e-03 | 1.36e-02 | 9 |
| GO:00331356 | Thyroid | PTC | regulation of peptidyl-serine phosphorylation | 62/5968 | 144/18723 | 3.05e-03 | 1.50e-02 | 62 |
| GO:1900407110 | Thyroid | PTC | regulation of cellular response to oxidative stress | 39/5968 | 89/18723 | 1.18e-02 | 4.65e-02 | 39 |
| GO:00331384 | Thyroid | PTC | positive regulation of peptidyl-serine phosphorylation | 46/5968 | 108/18723 | 1.22e-02 | 4.78e-02 | 46 |
| GO:000697934 | Thyroid | ATC | response to oxidative stress | 246/6293 | 446/18723 | 2.98e-21 | 6.09e-19 | 246 |
| Page: 1 2 3 4 5 6 7 8 9 10 11 12 |
| Pathway ID | Tissue | Disease Stage | Description | Gene Ratio | Bg Ratio | pvalue | p.adjust | qvalue | Count |
| hsa04150 | Colorectum | MSS | mTOR signaling pathway | 47/1875 | 156/8465 | 1.19e-02 | 3.99e-02 | 2.44e-02 | 47 |
| hsa041501 | Colorectum | MSS | mTOR signaling pathway | 47/1875 | 156/8465 | 1.19e-02 | 3.99e-02 | 2.44e-02 | 47 |
| hsa041505 | Esophagus | ESCC | mTOR signaling pathway | 98/4205 | 156/8465 | 5.81e-04 | 1.95e-03 | 9.97e-04 | 98 |
| hsa0415013 | Esophagus | ESCC | mTOR signaling pathway | 98/4205 | 156/8465 | 5.81e-04 | 1.95e-03 | 9.97e-04 | 98 |
| hsa041502 | Liver | HCC | mTOR signaling pathway | 95/4020 | 156/8465 | 4.70e-04 | 1.99e-03 | 1.11e-03 | 95 |
| hsa0415011 | Liver | HCC | mTOR signaling pathway | 95/4020 | 156/8465 | 4.70e-04 | 1.99e-03 | 1.11e-03 | 95 |
| hsa041504 | Oral cavity | OSCC | mTOR signaling pathway | 90/3704 | 156/8465 | 2.87e-04 | 9.15e-04 | 4.66e-04 | 90 |
| hsa0415012 | Oral cavity | OSCC | mTOR signaling pathway | 90/3704 | 156/8465 | 2.87e-04 | 9.15e-04 | 4.66e-04 | 90 |
| hsa0415021 | Oral cavity | EOLP | mTOR signaling pathway | 34/1218 | 156/8465 | 7.59e-03 | 2.17e-02 | 1.28e-02 | 34 |
| hsa041503 | Oral cavity | EOLP | mTOR signaling pathway | 34/1218 | 156/8465 | 7.59e-03 | 2.17e-02 | 1.28e-02 | 34 |
| Page: 1 |
Top |
Cell-cell communication analysis |
| Identification of potential cell-cell interactions between two cell types and their ligand-receptor pairs for different disease states |
| Ligand | Receptor | LRpair | Pathway | Tissue | Disease Stage |
| Page: 1 |
Top |
Single-cell gene regulatory network inference analysis |
| Find out the significant the regulons (TFs) and the target genes of each regulon across cell types for different disease states |
| TF | Cell Type | Tissue | Disease Stage | Target Gene | RSS | Regulon Activity |
| ∗The dot plots of a searched regulon are shown for all cell subpopulations in each disease state of each tissue based on the regulon specific score inferred using pySCENIC and by calculating the average expression. |
| Page: 1 |
Top |
Somatic mutation of malignant transformation related genes |
| Annotation of somatic variants for genes involved in malignant transformation |
| Hugo Symbol | Variant Class | Variant Classification | dbSNP RS | HGVSc | HGVSp | HGVSp Short | SWISSPROT | BIOTYPE | SIFT | PolyPhen | Tumor Sample Barcode | Tissue | Histology | Sex | Age | Stage | Therapy Types | Drugs | Outcome |
| MAPKAP1 | SNV | Missense_Mutation | c.1079N>G | p.Asp360Gly | p.D360G | Q9BPZ7 | protein_coding | deleterious(0.04) | benign(0.033) | TCGA-AR-A256-01 | Breast | breast invasive carcinoma | Female | <65 | I/II | Chemotherapy | doxorubicin | PD | |
| MAPKAP1 | SNV | Missense_Mutation | c.562N>A | p.Asp188Asn | p.D188N | Q9BPZ7 | protein_coding | deleterious(0.01) | possibly_damaging(0.511) | TCGA-D8-A27G-01 | Breast | breast invasive carcinoma | Female | >=65 | I/II | Unknown | Unknown | SD | |
| MAPKAP1 | SNV | Missense_Mutation | c.266N>C | p.Arg89Thr | p.R89T | Q9BPZ7 | protein_coding | deleterious(0) | benign(0.428) | TCGA-GM-A2DI-01 | Breast | breast invasive carcinoma | Female | <65 | I/II | Chemotherapy | taxotere | CR | |
| MAPKAP1 | insertion | Frame_Shift_Ins | novel | c.1503_1504insA | p.Gln502ThrfsTer44 | p.Q502Tfs*44 | Q9BPZ7 | protein_coding | TCGA-BH-A18G-01 | Breast | breast invasive carcinoma | Female | >=65 | I/II | Unknown | Unknown | SD | ||
| MAPKAP1 | insertion | In_Frame_Ins | novel | c.650_655dupAAGGAC | p.Gly218_Arg219insGlnGly | p.G218_R219insQG | Q9BPZ7 | protein_coding | TCGA-C8-A26Y-01 | Breast | breast invasive carcinoma | Female | >=65 | I/II | Unknown | Unknown | SD | ||
| MAPKAP1 | SNV | Missense_Mutation | c.1405G>A | p.Glu469Lys | p.E469K | Q9BPZ7 | protein_coding | deleterious(0) | probably_damaging(0.989) | TCGA-C5-A7UH-01 | Cervix | cervical & endocervical cancer | Female | <65 | III/IV | Chemotherapy | cisplatin | SD | |
| MAPKAP1 | SNV | Missense_Mutation | novel | c.1526N>T | p.Thr509Met | p.T509M | Q9BPZ7 | protein_coding | tolerated(0.06) | probably_damaging(0.998) | TCGA-EA-A410-01 | Cervix | cervical & endocervical cancer | Female | <65 | I/II | Unknown | Unknown | SD |
| MAPKAP1 | SNV | Missense_Mutation | c.1409N>T | p.Ser470Leu | p.S470L | Q9BPZ7 | protein_coding | deleterious(0.01) | benign(0.269) | TCGA-AA-3510-01 | Colorectum | colon adenocarcinoma | Male | >=65 | I/II | Unknown | Unknown | SD | |
| MAPKAP1 | SNV | Missense_Mutation | c.332N>T | p.Arg111Ile | p.R111I | Q9BPZ7 | protein_coding | tolerated(0.18) | probably_damaging(0.94) | TCGA-AA-3510-01 | Colorectum | colon adenocarcinoma | Male | >=65 | I/II | Unknown | Unknown | SD | |
| MAPKAP1 | SNV | Missense_Mutation | novel | c.110N>G | p.Asp37Gly | p.D37G | Q9BPZ7 | protein_coding | deleterious(0.02) | probably_damaging(0.955) | TCGA-AA-3947-01 | Colorectum | colon adenocarcinoma | Female | <65 | I/II | Unknown | Unknown | SD |
| Page: 1 2 3 4 5 6 7 |
Top |
Related drugs of malignant transformation related genes |
| Identification of chemicals and drugs interact with genes involved in malignant transfromation |
| (DGIdb 4.0) |
| Entrez ID | Symbol | Category | Interaction Types | Drug Claim Name | Drug Name | PMIDs |
| 79109 | MAPKAP1 | KINASE | inhibitor | OSI-027 | OSI-027 | |
| 79109 | MAPKAP1 | KINASE | inhibitor | MLN0128 | SAPANISERTIB | |
| 79109 | MAPKAP1 | KINASE | inhibitor | AZD8055 | AZD-8055 |
| Page: 1 |

Copyright 2023-Present -The University of Texas Health Science Center at Houston |