
|
|||||
|
 | |
| |
| |
| |
| |
| |
|
Gene: MAIP1 |
Gene summary for MAIP1 |
| Gene information | Species | Human | Gene symbol | MAIP1 | Gene ID | 79568 |
| Gene name | matrix AAA peptidase interacting protein 1 | |
| Gene Alias | C2orf47 | |
| Cytomap | 2q33.1 | |
| Gene Type | protein-coding | GO ID | GO:0006810 | UniProtAcc | A0A024R3U8 |
Top |
Malignant transformation analysis |
| Identification of the aberrant gene expression in precancerous and cancerous lesions by comparing the gene expression of stem-like cells in diseased tissues with normal stem cells |
| Entrez ID | Symbol | Replicates | Species | Organ | Tissue | Adj P-value | Log2FC | Malignancy |
| 79568 | MAIP1 | LZE4T | Human | Esophagus | ESCC | 9.66e-09 | 2.32e-01 | 0.0811 |
| 79568 | MAIP1 | LZE5T | Human | Esophagus | ESCC | 1.57e-03 | 2.22e-01 | 0.0514 |
| 79568 | MAIP1 | LZE7T | Human | Esophagus | ESCC | 1.02e-03 | 2.31e-01 | 0.0667 |
| 79568 | MAIP1 | LZE20T | Human | Esophagus | ESCC | 2.95e-06 | 1.86e-01 | 0.0662 |
| 79568 | MAIP1 | LZE22T | Human | Esophagus | ESCC | 1.57e-02 | 2.52e-01 | 0.068 |
| 79568 | MAIP1 | LZE24T | Human | Esophagus | ESCC | 1.70e-23 | 5.01e-01 | 0.0596 |
| 79568 | MAIP1 | HCC2 | Human | Liver | HCC | 2.08e-08 | 2.07e+00 | 0.5341 |
| 79568 | MAIP1 | S014 | Human | Liver | HCC | 5.13e-20 | 6.68e-01 | 0.2254 |
| 79568 | MAIP1 | S015 | Human | Liver | HCC | 1.64e-26 | 8.20e-01 | 0.2375 |
| 79568 | MAIP1 | S016 | Human | Liver | HCC | 2.57e-31 | 7.25e-01 | 0.2243 |
| 79568 | MAIP1 | S027 | Human | Liver | HCC | 2.41e-09 | 8.06e-01 | 0.2446 |
| 79568 | MAIP1 | S028 | Human | Liver | HCC | 2.55e-24 | 8.70e-01 | 0.2503 |
| 79568 | MAIP1 | S029 | Human | Liver | HCC | 1.06e-32 | 1.07e+00 | 0.2581 |
| Page: 1 |
| Tissue | Expression Dynamics | Abbreviation |
| Liver | 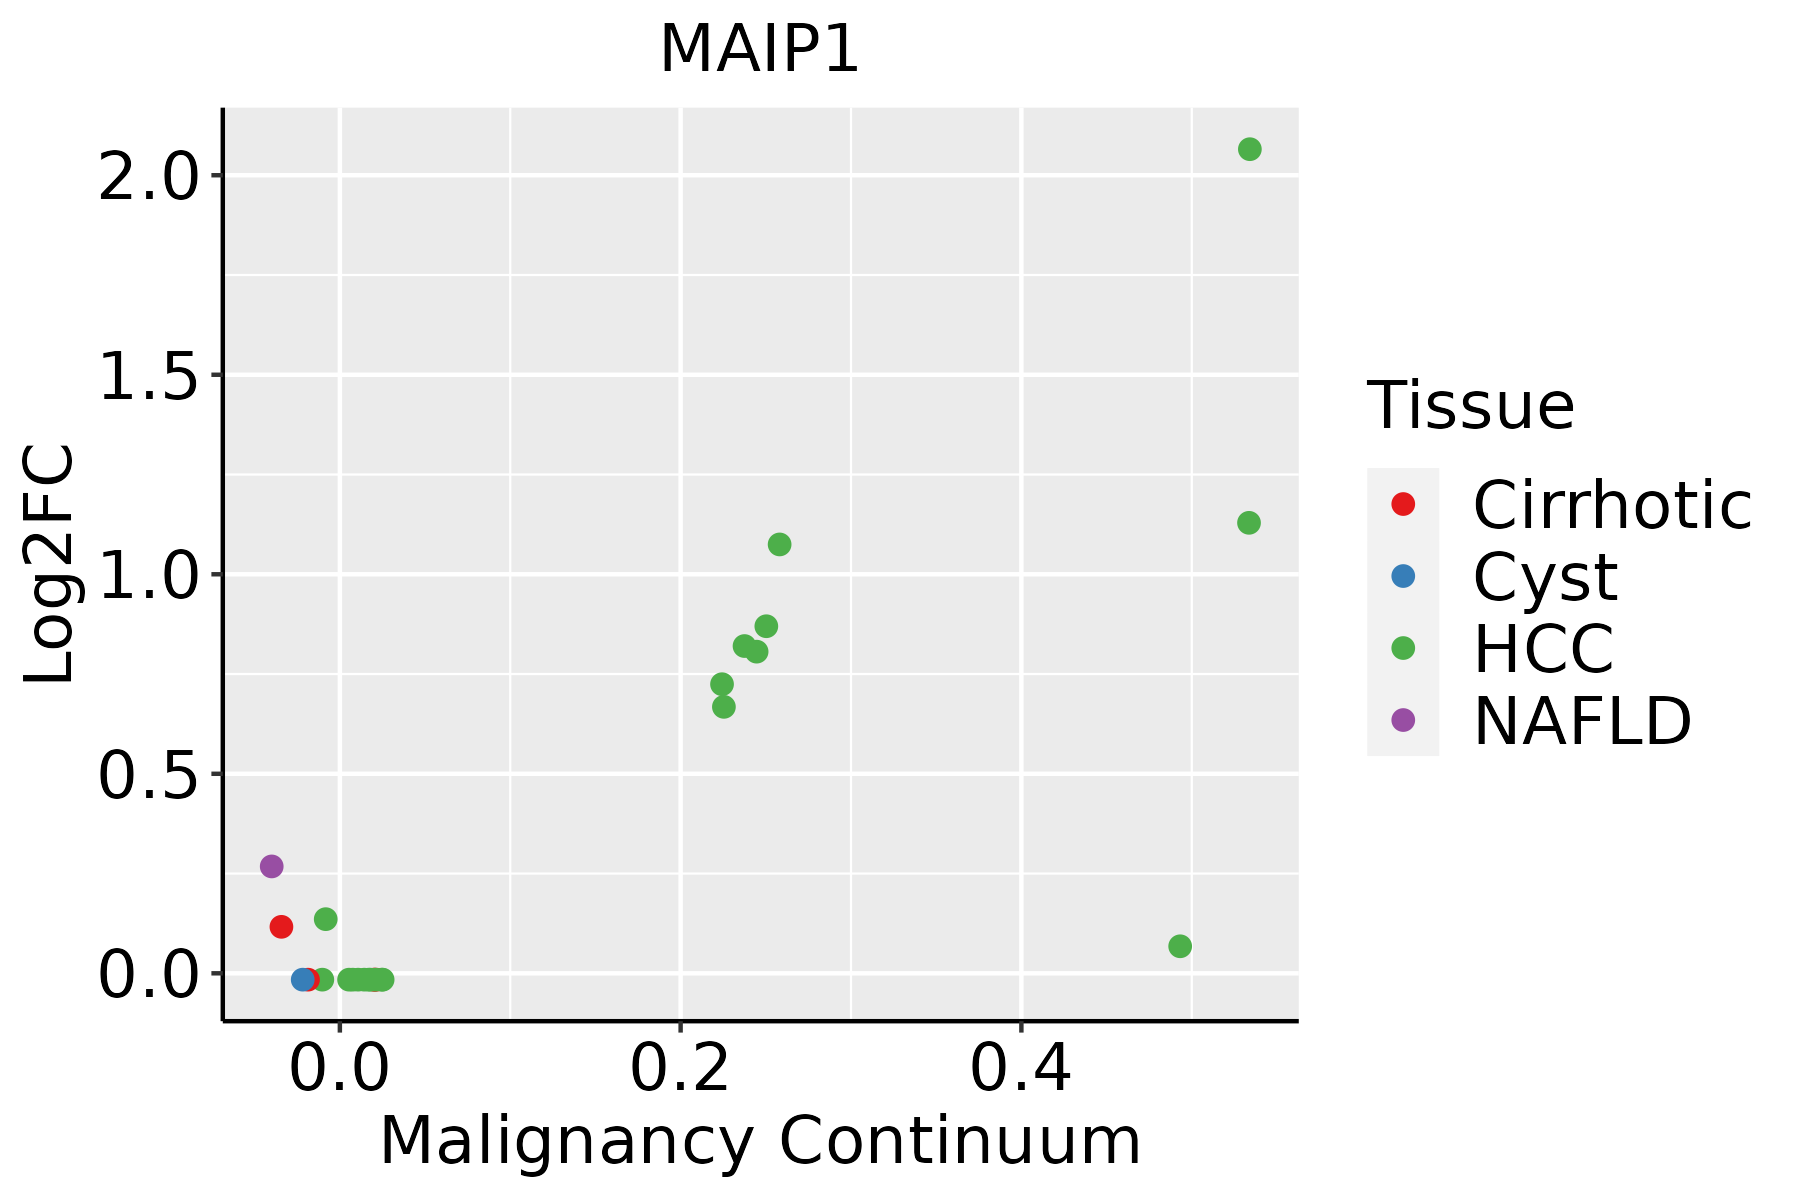 | HCC: Hepatocellular carcinoma |
| NAFLD: Non-alcoholic fatty liver disease |
| ∗log2FC in expression of this searched gene in stem-like cells from each diseased tissue sample relative to stem-like cells in normal samples in each tissue plotted against the malignancy continuum. Samples are colored based on if they are from different disease stage. |
Top |
Malignant transformation related pathway analysis |
| Find out the enriched GO biological processes and KEGG pathways involved in transition from healthy to precancer to cancer |
| Tissue | Disease Stage | Enriched GO biological Processes |
| Colorectum | AD |  |
| Colorectum | SER |  |
| Colorectum | MSS |  |
| Colorectum | MSI-H |  |
| Colorectum | FAP |  |
| ∗Top 15 enriched GO BP terms are showed in the bar plot of each disease state in each tissue. Each row represents a significant GO biological process which is colored according to the -log10(p.adjust). |
| Page: 1 2 3 4 5 6 7 8 9 |
| GO ID | Tissue | Disease Stage | Description | Gene Ratio | Bg Ratio | pvalue | p.adjust | Count |
| GO:003497610 | Cervix | CC | response to endoplasmic reticulum stress | 57/2311 | 256/18723 | 5.81e-06 | 1.42e-04 | 57 |
| GO:20010569 | Cervix | CC | positive regulation of cysteine-type endopeptidase activity | 38/2311 | 148/18723 | 6.94e-06 | 1.65e-04 | 38 |
| GO:00092678 | Cervix | CC | cellular response to starvation | 39/2311 | 156/18723 | 1.04e-05 | 2.32e-04 | 39 |
| GO:20012446 | Cervix | CC | positive regulation of intrinsic apoptotic signaling pathway | 20/2311 | 58/18723 | 1.07e-05 | 2.33e-04 | 20 |
| GO:00432809 | Cervix | CC | positive regulation of cysteine-type endopeptidase activity involved in apoptotic process | 34/2311 | 129/18723 | 1.13e-05 | 2.45e-04 | 34 |
| GO:00700599 | Cervix | CC | intrinsic apoptotic signaling pathway in response to endoplasmic reticulum stress | 21/2311 | 63/18723 | 1.18e-05 | 2.51e-04 | 21 |
| GO:00425948 | Cervix | CC | response to starvation | 46/2311 | 197/18723 | 1.24e-05 | 2.59e-04 | 46 |
| GO:00316698 | Cervix | CC | cellular response to nutrient levels | 49/2311 | 215/18723 | 1.32e-05 | 2.68e-04 | 49 |
| GO:00096158 | Cervix | CC | response to virus | 73/2311 | 367/18723 | 2.22e-05 | 3.95e-04 | 73 |
| GO:00723329 | Cervix | CC | intrinsic apoptotic signaling pathway by p53 class mediator | 23/2311 | 76/18723 | 2.76e-05 | 4.60e-04 | 23 |
| GO:200123610 | Cervix | CC | regulation of extrinsic apoptotic signaling pathway | 37/2311 | 151/18723 | 2.80e-05 | 4.65e-04 | 37 |
| GO:007233110 | Cervix | CC | signal transduction by p53 class mediator | 38/2311 | 163/18723 | 7.06e-05 | 9.85e-04 | 38 |
| GO:000166610 | Cervix | CC | response to hypoxia | 61/2311 | 307/18723 | 1.04e-04 | 1.34e-03 | 61 |
| GO:007048210 | Cervix | CC | response to oxygen levels | 67/2311 | 347/18723 | 1.21e-04 | 1.51e-03 | 67 |
| GO:00108218 | Cervix | CC | regulation of mitochondrion organization | 34/2311 | 144/18723 | 1.27e-04 | 1.58e-03 | 34 |
| GO:20010209 | Cervix | CC | regulation of response to DNA damage stimulus | 46/2311 | 219/18723 | 1.92e-04 | 2.23e-03 | 46 |
| GO:003629310 | Cervix | CC | response to decreased oxygen levels | 62/2311 | 322/18723 | 2.29e-04 | 2.57e-03 | 62 |
| GO:19022356 | Cervix | CC | regulation of endoplasmic reticulum stress-induced intrinsic apoptotic signaling pathway | 12/2311 | 32/18723 | 2.53e-04 | 2.79e-03 | 12 |
| GO:00070067 | Cervix | CC | mitochondrial membrane organization | 28/2311 | 116/18723 | 3.28e-04 | 3.47e-03 | 28 |
| GO:00069194 | Cervix | CC | activation of cysteine-type endopeptidase activity involved in apoptotic process | 21/2311 | 78/18723 | 3.74e-04 | 3.86e-03 | 21 |
| Page: 1 2 3 4 5 6 7 8 9 10 11 12 13 14 15 16 17 18 19 20 21 22 23 24 25 26 27 28 29 30 31 32 33 34 35 36 37 38 39 40 41 42 43 44 45 46 47 |
| Pathway ID | Tissue | Disease Stage | Description | Gene Ratio | Bg Ratio | pvalue | p.adjust | qvalue | Count |
| Page: 1 |
Top |
Cell-cell communication analysis |
| Identification of potential cell-cell interactions between two cell types and their ligand-receptor pairs for different disease states |
| Ligand | Receptor | LRpair | Pathway | Tissue | Disease Stage |
| Page: 1 |
Top |
Single-cell gene regulatory network inference analysis |
| Find out the significant the regulons (TFs) and the target genes of each regulon across cell types for different disease states |
| TF | Cell Type | Tissue | Disease Stage | Target Gene | RSS | Regulon Activity |
| ∗The dot plots of a searched regulon are shown for all cell subpopulations in each disease state of each tissue based on the regulon specific score inferred using pySCENIC and by calculating the average expression. |
| Page: 1 |
Top |
Somatic mutation of malignant transformation related genes |
| Annotation of somatic variants for genes involved in malignant transformation |
| Hugo Symbol | Variant Class | Variant Classification | dbSNP RS | HGVSc | HGVSp | HGVSp Short | SWISSPROT | BIOTYPE | SIFT | PolyPhen | Tumor Sample Barcode | Tissue | Histology | Sex | Age | Stage | Therapy Types | Drugs | Outcome |
| MAIP1 | SNV | Missense_Mutation | c.742N>T | p.Val248Phe | p.V248F | Q8WWC4 | protein_coding | tolerated(0.08) | benign(0.233) | TCGA-A8-A08S-01 | Breast | breast invasive carcinoma | Female | >=65 | I/II | Hormone Therapy | anastrozole | SD | |
| MAIP1 | SNV | Missense_Mutation | c.340N>A | p.Gly114Arg | p.G114R | Q8WWC4 | protein_coding | deleterious(0.03) | possibly_damaging(0.905) | TCGA-A8-A09Z-01 | Breast | breast invasive carcinoma | Female | >=65 | I/II | Unknown | Unknown | SD | |
| MAIP1 | SNV | Missense_Mutation | novel | c.608N>C | p.Phe203Ser | p.F203S | Q8WWC4 | protein_coding | deleterious(0) | benign(0.091) | TCGA-AC-A3QQ-01 | Breast | breast invasive carcinoma | Female | <65 | I/II | Unknown | Unknown | SD |
| MAIP1 | SNV | Missense_Mutation | novel | c.781N>A | p.Leu261Ile | p.L261I | Q8WWC4 | protein_coding | tolerated(0.07) | possibly_damaging(0.521) | TCGA-AN-A046-01 | Breast | breast invasive carcinoma | Female | >=65 | I/II | Unknown | Unknown | SD |
| MAIP1 | SNV | Missense_Mutation | c.363N>T | p.Trp121Cys | p.W121C | Q8WWC4 | protein_coding | deleterious(0) | probably_damaging(0.971) | TCGA-BH-A0HY-01 | Breast | breast invasive carcinoma | Female | <65 | I/II | Hormone Therapy | taxotere | CR | |
| MAIP1 | SNV | Missense_Mutation | c.520G>C | p.Glu174Gln | p.E174Q | Q8WWC4 | protein_coding | deleterious(0) | probably_damaging(0.982) | TCGA-BH-A0W7-01 | Breast | breast invasive carcinoma | Female | <65 | I/II | Chemotherapy | taxotere | CR | |
| MAIP1 | insertion | Frame_Shift_Ins | novel | c.607_608insCTCA | p.Phe203SerfsTer13 | p.F203Sfs*13 | Q8WWC4 | protein_coding | TCGA-A7-A26I-01 | Breast | breast invasive carcinoma | Female | >=65 | I/II | Chemotherapy | cytoxan | SD | ||
| MAIP1 | insertion | Frame_Shift_Ins | novel | c.646_647insTGGC | p.Lys216MetfsTer8 | p.K216Mfs*8 | Q8WWC4 | protein_coding | TCGA-A8-A06X-01 | Breast | breast invasive carcinoma | Female | >=65 | I/II | Unknown | Unknown | SD | ||
| MAIP1 | insertion | Frame_Shift_Ins | novel | c.647_648insGCCTAGATTTC | p.Gly217ProfsTer12 | p.G217Pfs*12 | Q8WWC4 | protein_coding | TCGA-A8-A06X-01 | Breast | breast invasive carcinoma | Female | >=65 | I/II | Unknown | Unknown | SD | ||
| MAIP1 | SNV | Missense_Mutation | novel | c.37N>T | p.His13Tyr | p.H13Y | Q8WWC4 | protein_coding | deleterious_low_confidence(0.02) | benign(0.006) | TCGA-AJ-A3EK-01 | Endometrium | uterine corpus endometrioid carcinoma | Female | <65 | I/II | Chemotherapy | carboplatin | CR |
| Page: 1 2 3 |
Top |
Related drugs of malignant transformation related genes |
| Identification of chemicals and drugs interact with genes involved in malignant transfromation |
| (DGIdb 4.0) |
| Entrez ID | Symbol | Category | Interaction Types | Drug Claim Name | Drug Name | PMIDs |
| Page: 1 |

Copyright 2023-Present -The University of Texas Health Science Center at Houston |