
|
|||||
|
 | |
| |
| |
| |
| |
| |
|
Gene: KRT19 |
Gene summary for KRT19 |
| Gene information | Species | Human | Gene symbol | KRT19 | Gene ID | 3880 |
| Gene name | keratin 19 | |
| Gene Alias | CK19 | |
| Cytomap | 17q21.2 | |
| Gene Type | protein-coding | GO ID | GO:0000003 | UniProtAcc | P08727 |
Top |
Malignant transformation analysis |
| Identification of the aberrant gene expression in precancerous and cancerous lesions by comparing the gene expression of stem-like cells in diseased tissues with normal stem cells |
| Entrez ID | Symbol | Replicates | Species | Organ | Tissue | Adj P-value | Log2FC | Malignancy |
| 3880 | KRT19 | GSM4909277 | Human | Breast | Precancer | 4.41e-02 | -8.20e-01 | 0.0177 |
| 3880 | KRT19 | GSM4909281 | Human | Breast | IDC | 1.79e-05 | 3.03e-01 | 0.21 |
| 3880 | KRT19 | GSM4909282 | Human | Breast | IDC | 1.14e-16 | -5.91e-01 | -0.0288 |
| 3880 | KRT19 | GSM4909285 | Human | Breast | IDC | 7.55e-08 | 3.40e-01 | 0.21 |
| 3880 | KRT19 | GSM4909286 | Human | Breast | IDC | 5.82e-97 | 8.36e-01 | 0.1081 |
| 3880 | KRT19 | GSM4909288 | Human | Breast | IDC | 1.24e-05 | -7.22e-01 | 0.0988 |
| 3880 | KRT19 | GSM4909290 | Human | Breast | IDC | 6.58e-19 | 4.81e-01 | 0.2096 |
| 3880 | KRT19 | GSM4909293 | Human | Breast | IDC | 5.84e-05 | 3.08e-01 | 0.1581 |
| 3880 | KRT19 | GSM4909294 | Human | Breast | IDC | 1.11e-04 | 1.15e-01 | 0.2022 |
| 3880 | KRT19 | GSM4909295 | Human | Breast | IDC | 2.20e-17 | 4.84e-01 | 0.0898 |
| 3880 | KRT19 | GSM4909296 | Human | Breast | IDC | 6.45e-08 | 3.18e-01 | 0.1524 |
| 3880 | KRT19 | GSM4909297 | Human | Breast | IDC | 1.68e-64 | 6.72e-01 | 0.1517 |
| 3880 | KRT19 | GSM4909298 | Human | Breast | IDC | 6.80e-03 | -1.05e-01 | 0.1551 |
| 3880 | KRT19 | GSM4909299 | Human | Breast | IDC | 5.40e-08 | -4.59e-01 | 0.035 |
| 3880 | KRT19 | GSM4909301 | Human | Breast | IDC | 9.77e-08 | 3.41e-01 | 0.1577 |
| 3880 | KRT19 | GSM4909302 | Human | Breast | IDC | 3.83e-40 | 5.43e-01 | 0.1545 |
| 3880 | KRT19 | GSM4909303 | Human | Breast | IDC | 2.38e-02 | 3.20e-01 | 0.0438 |
| 3880 | KRT19 | GSM4909304 | Human | Breast | IDC | 2.90e-45 | 5.82e-01 | 0.1636 |
| 3880 | KRT19 | GSM4909305 | Human | Breast | IDC | 1.72e-36 | 6.03e-01 | 0.0436 |
| 3880 | KRT19 | GSM4909306 | Human | Breast | IDC | 5.21e-41 | 5.52e-01 | 0.1564 |
| Page: 1 2 3 4 5 6 7 8 9 10 11 12 13 14 15 16 17 18 |
| Tissue | Expression Dynamics | Abbreviation |
| Breast | 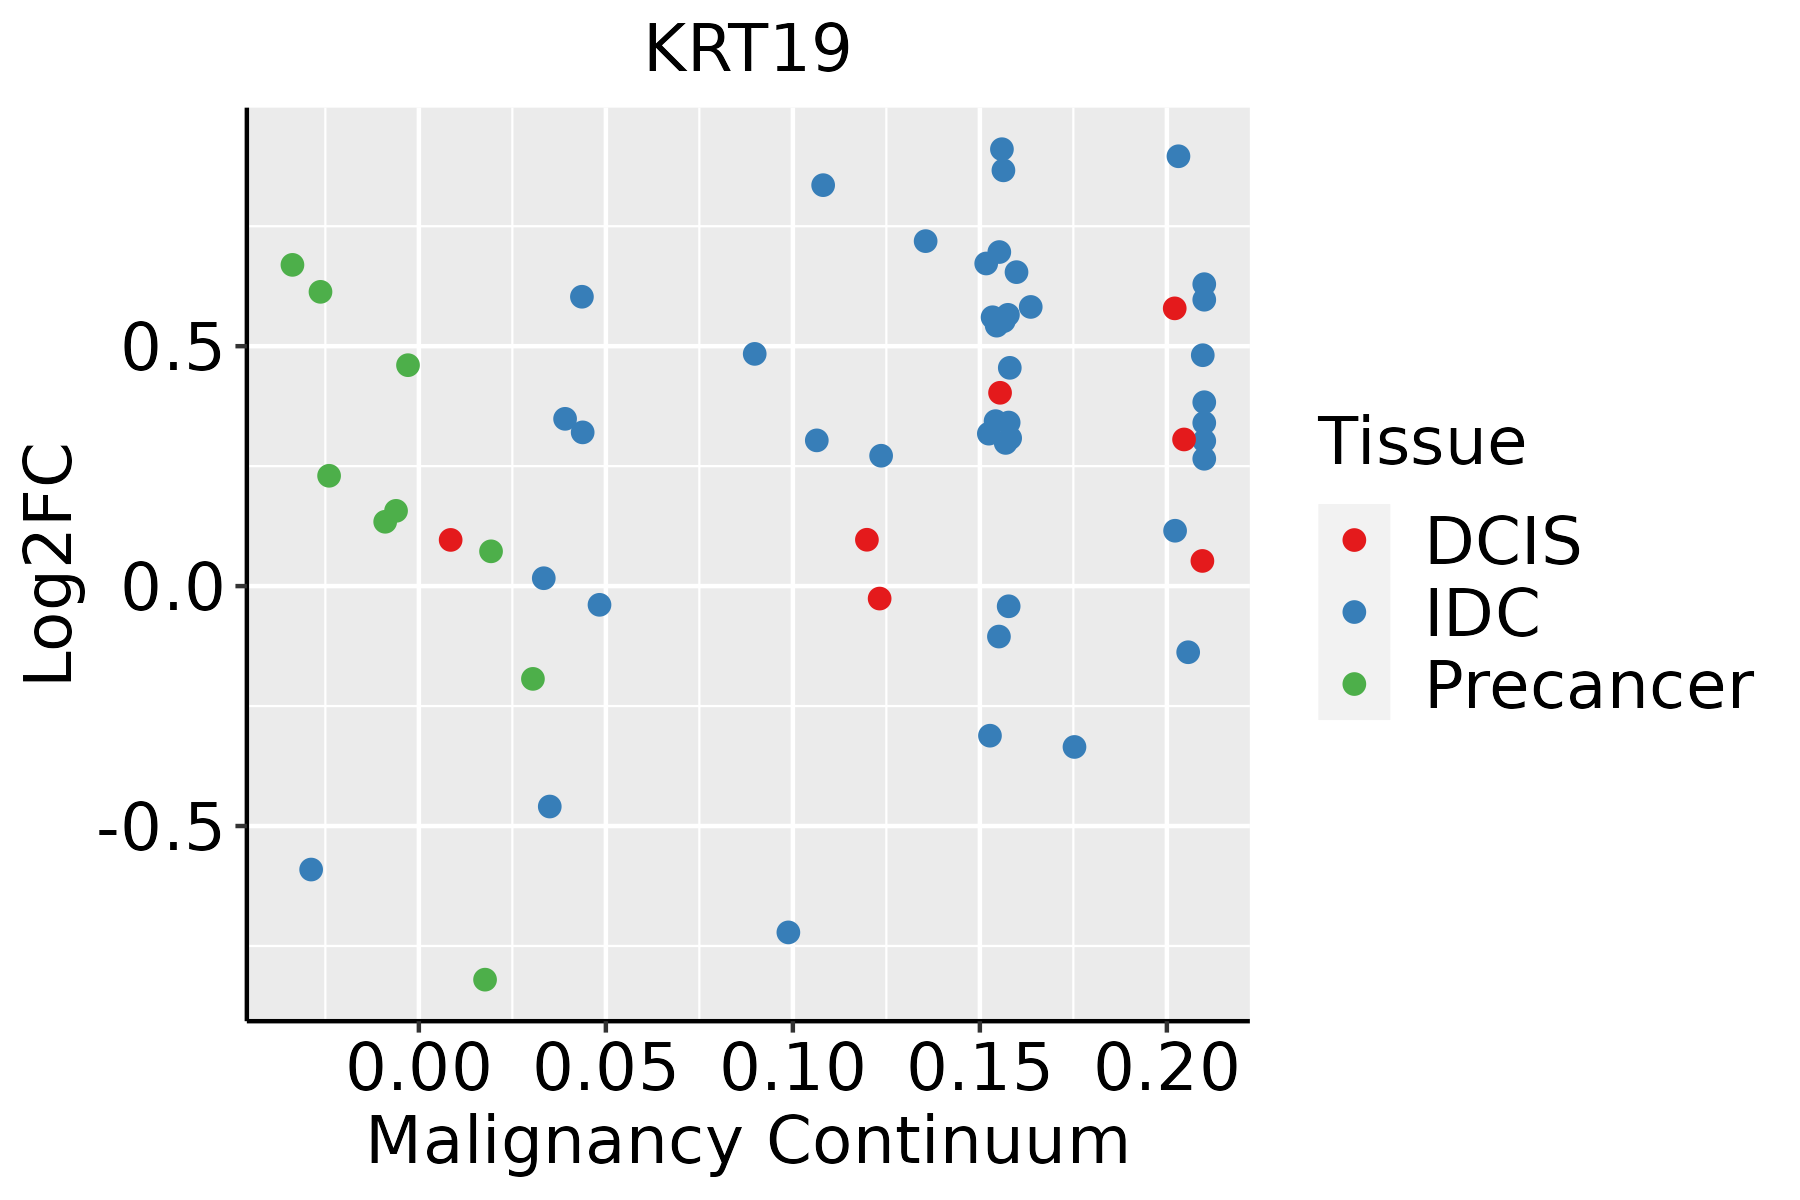 | IDC: Invasive ductal carcinoma |
| DCIS: Ductal carcinoma in situ | ||
| Precancer(BRCA1-mut): Precancerous lesion from BRCA1 mutation carriers | ||
| Cervix | 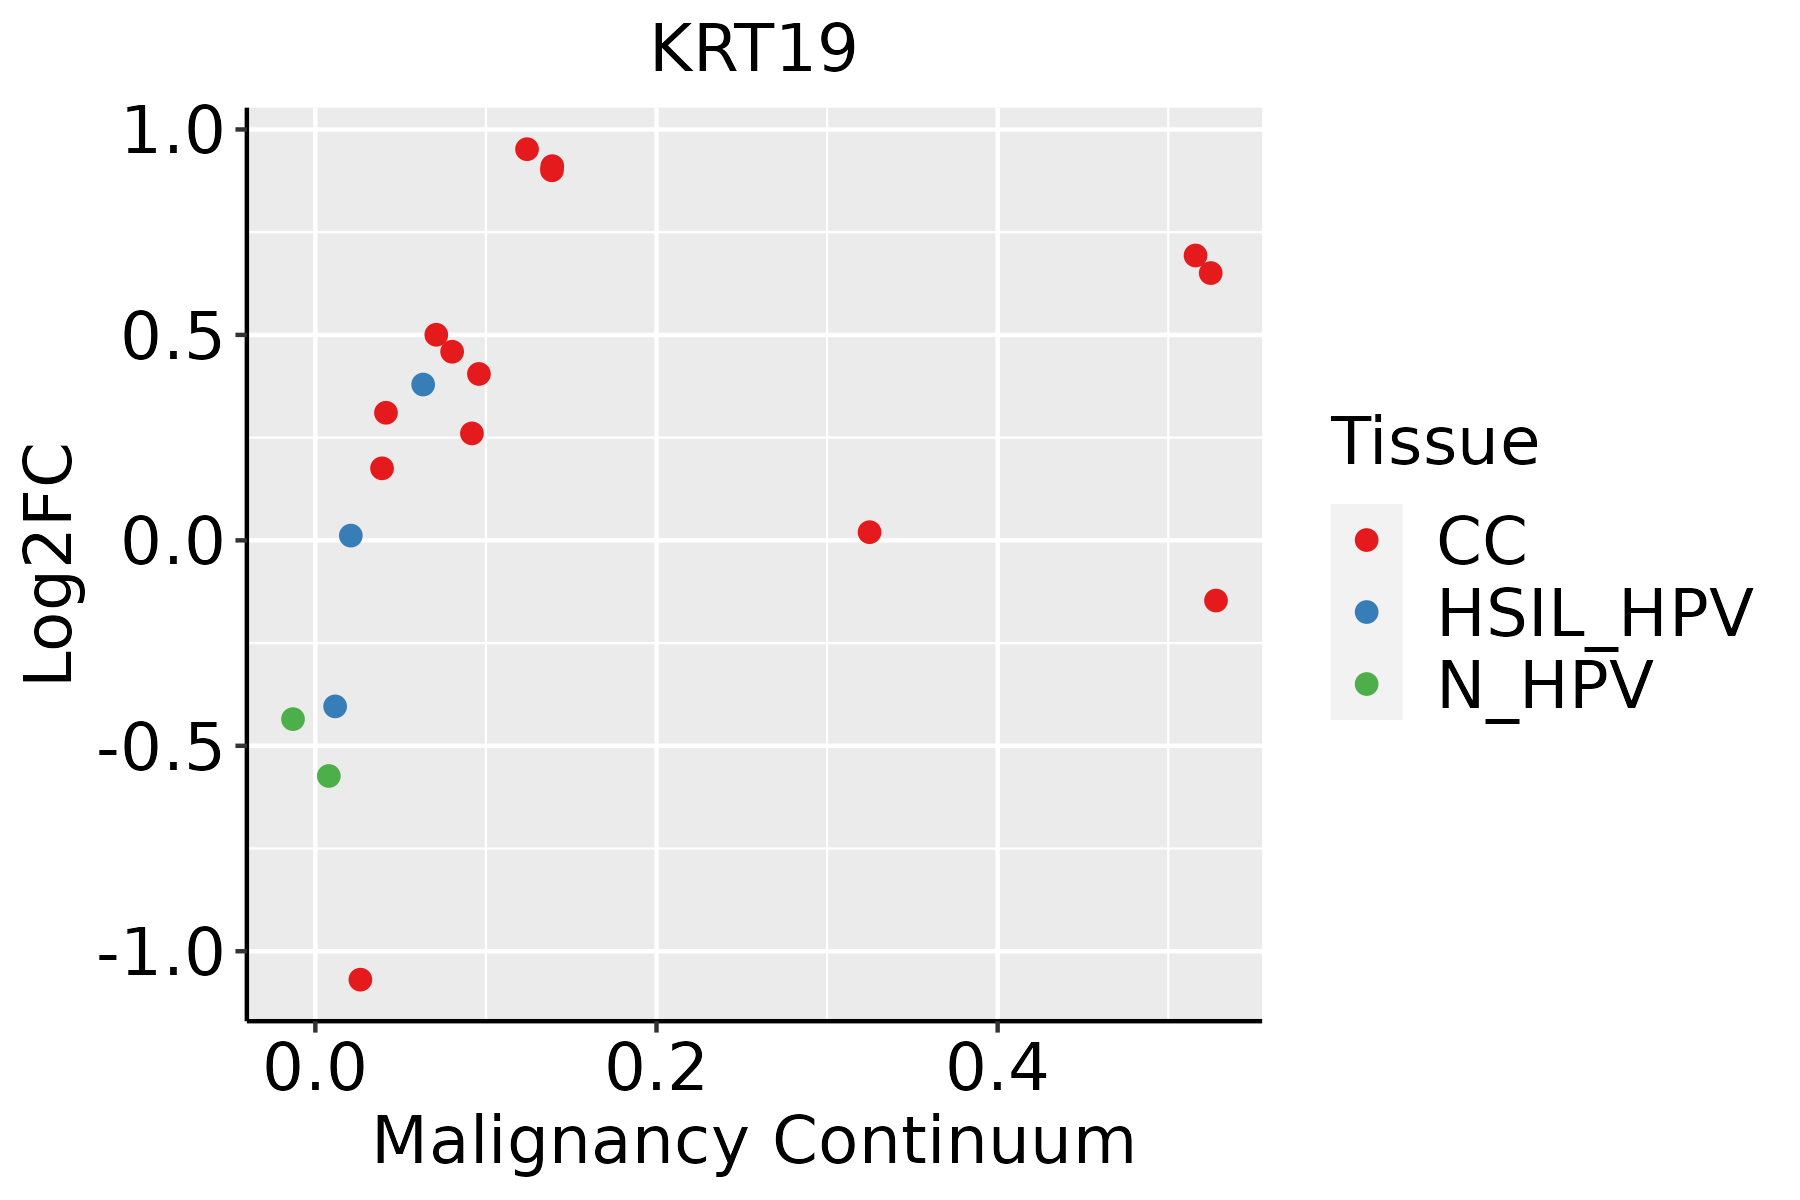 | CC: Cervix cancer |
| HSIL_HPV: HPV-infected high-grade squamous intraepithelial lesions | ||
| N_HPV: HPV-infected normal cervix | ||
| Colorectum (GSE201348) |  | FAP: Familial adenomatous polyposis |
| CRC: Colorectal cancer | ||
| Colorectum (HTA11) |  | AD: Adenomas |
| SER: Sessile serrated lesions | ||
| MSI-H: Microsatellite-high colorectal cancer | ||
| MSS: Microsatellite stable colorectal cancer | ||
| Endometrium |  | AEH: Atypical endometrial hyperplasia |
| EEC: Endometrioid Cancer | ||
| Esophagus |  | ESCC: Esophageal squamous cell carcinoma |
| HGIN: High-grade intraepithelial neoplasias | ||
| LGIN: Low-grade intraepithelial neoplasias | ||
| GC | 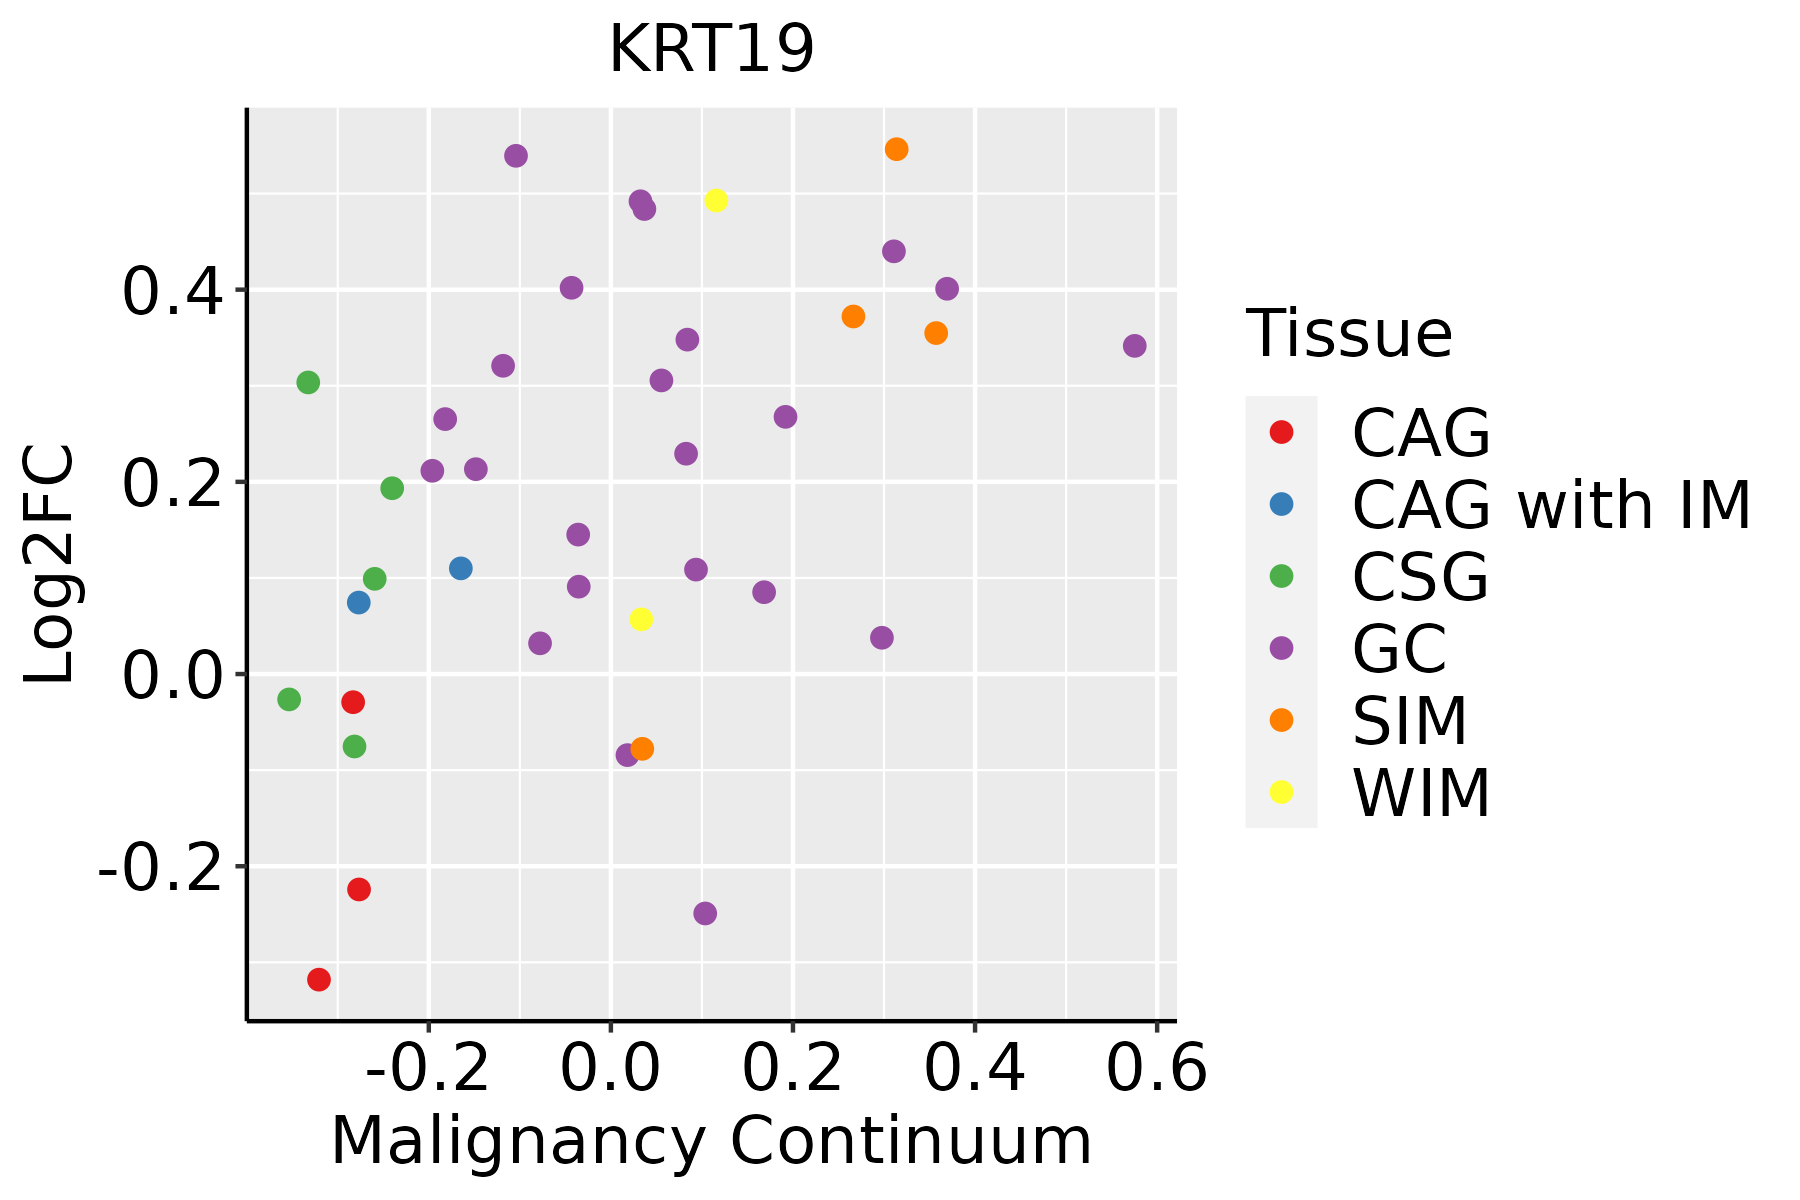 | CAG: Chronic atrophic gastritis |
| CAG with IM: Chronic atrophic gastritis with intestinal metaplasia | ||
| CSG: Chronic superficial gastritis | ||
| GC: Gastric cancer | ||
| SIM: Severe intestinal metaplasia | ||
| WIM: Wild intestinal metaplasia | ||
| Liver | 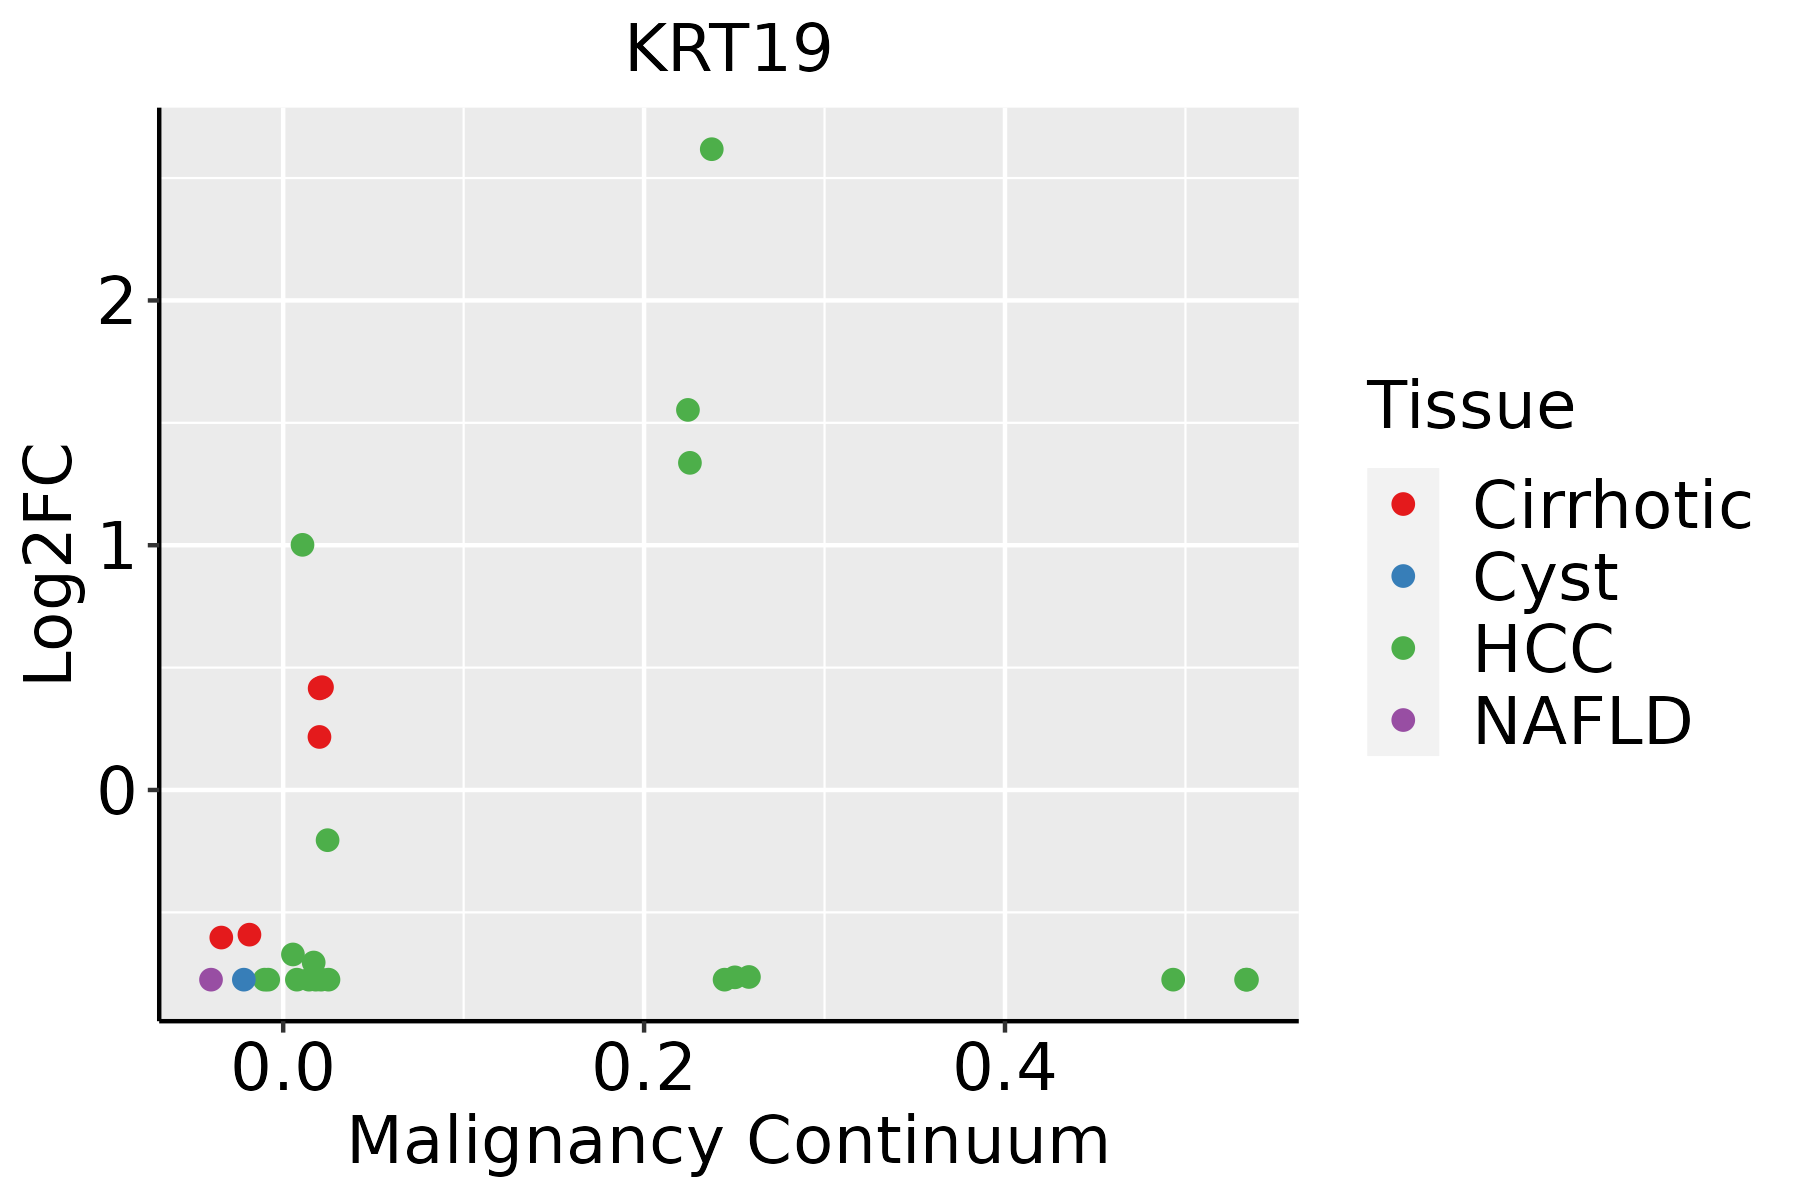 | HCC: Hepatocellular carcinoma |
| NAFLD: Non-alcoholic fatty liver disease | ||
| Lung | 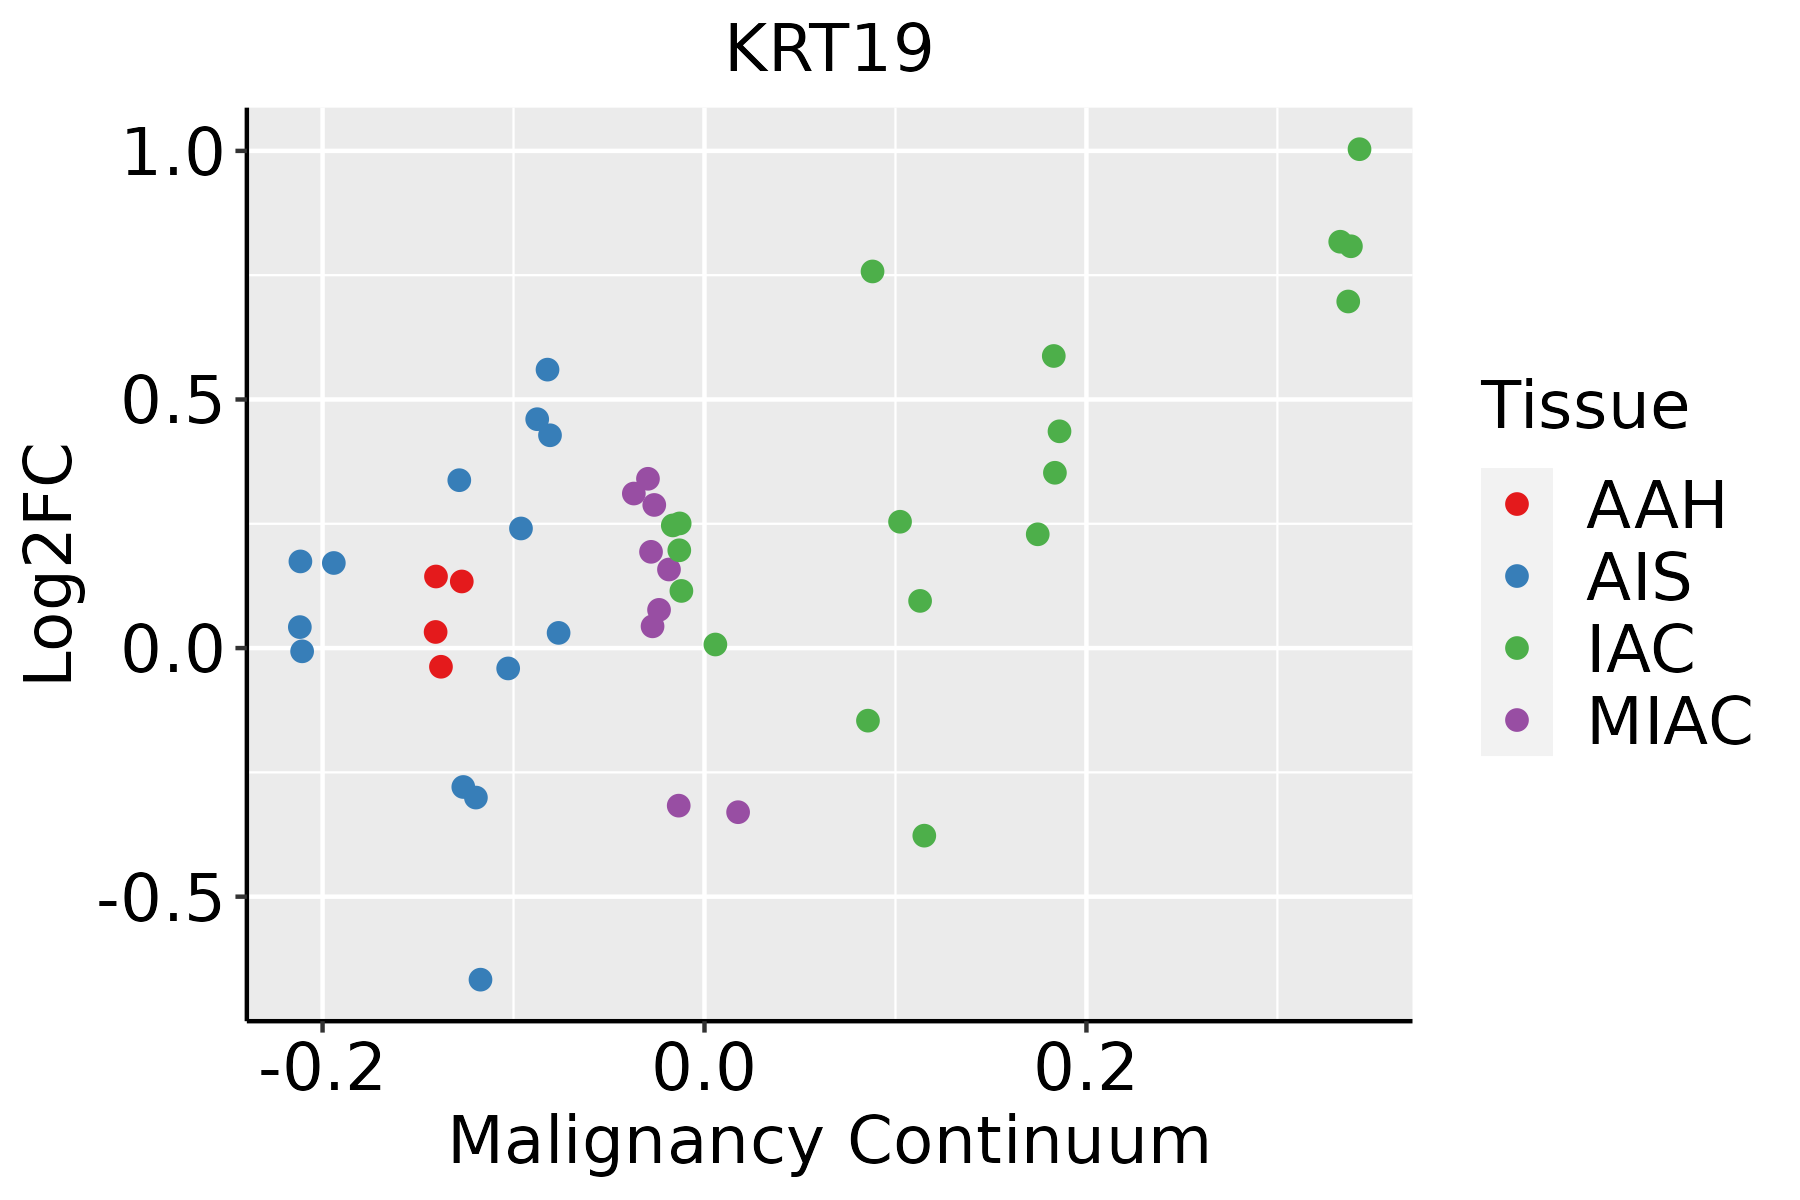 | AAH: Atypical adenomatous hyperplasia |
| AIS: Adenocarcinoma in situ | ||
| IAC: Invasive lung adenocarcinoma | ||
| MIA: Minimally invasive adenocarcinoma | ||
| Oral Cavity |  | EOLP: Erosive Oral lichen planus |
| LP: leukoplakia | ||
| NEOLP: Non-erosive oral lichen planus | ||
| OSCC: Oral squamous cell carcinoma | ||
| Prostate | 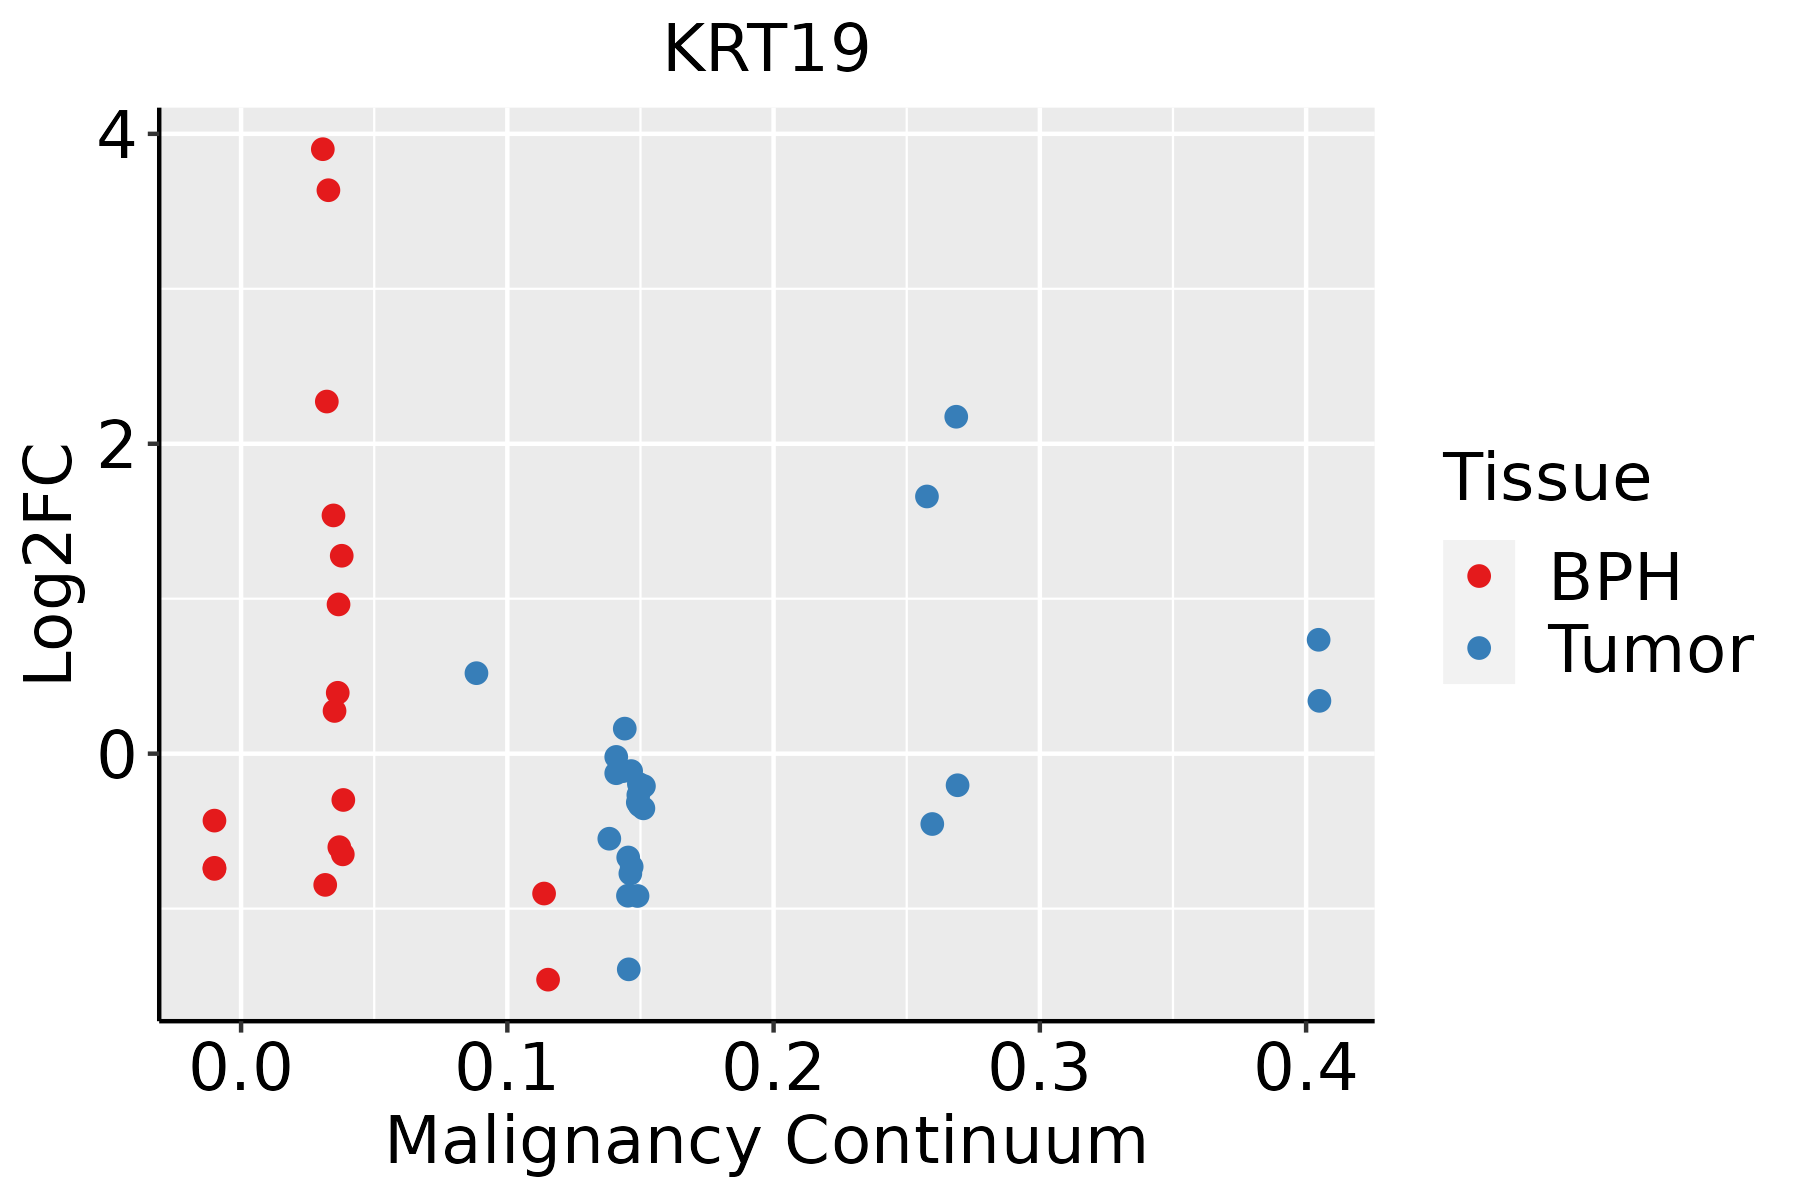 | BPH: Benign Prostatic Hyperplasia |
| Skin | 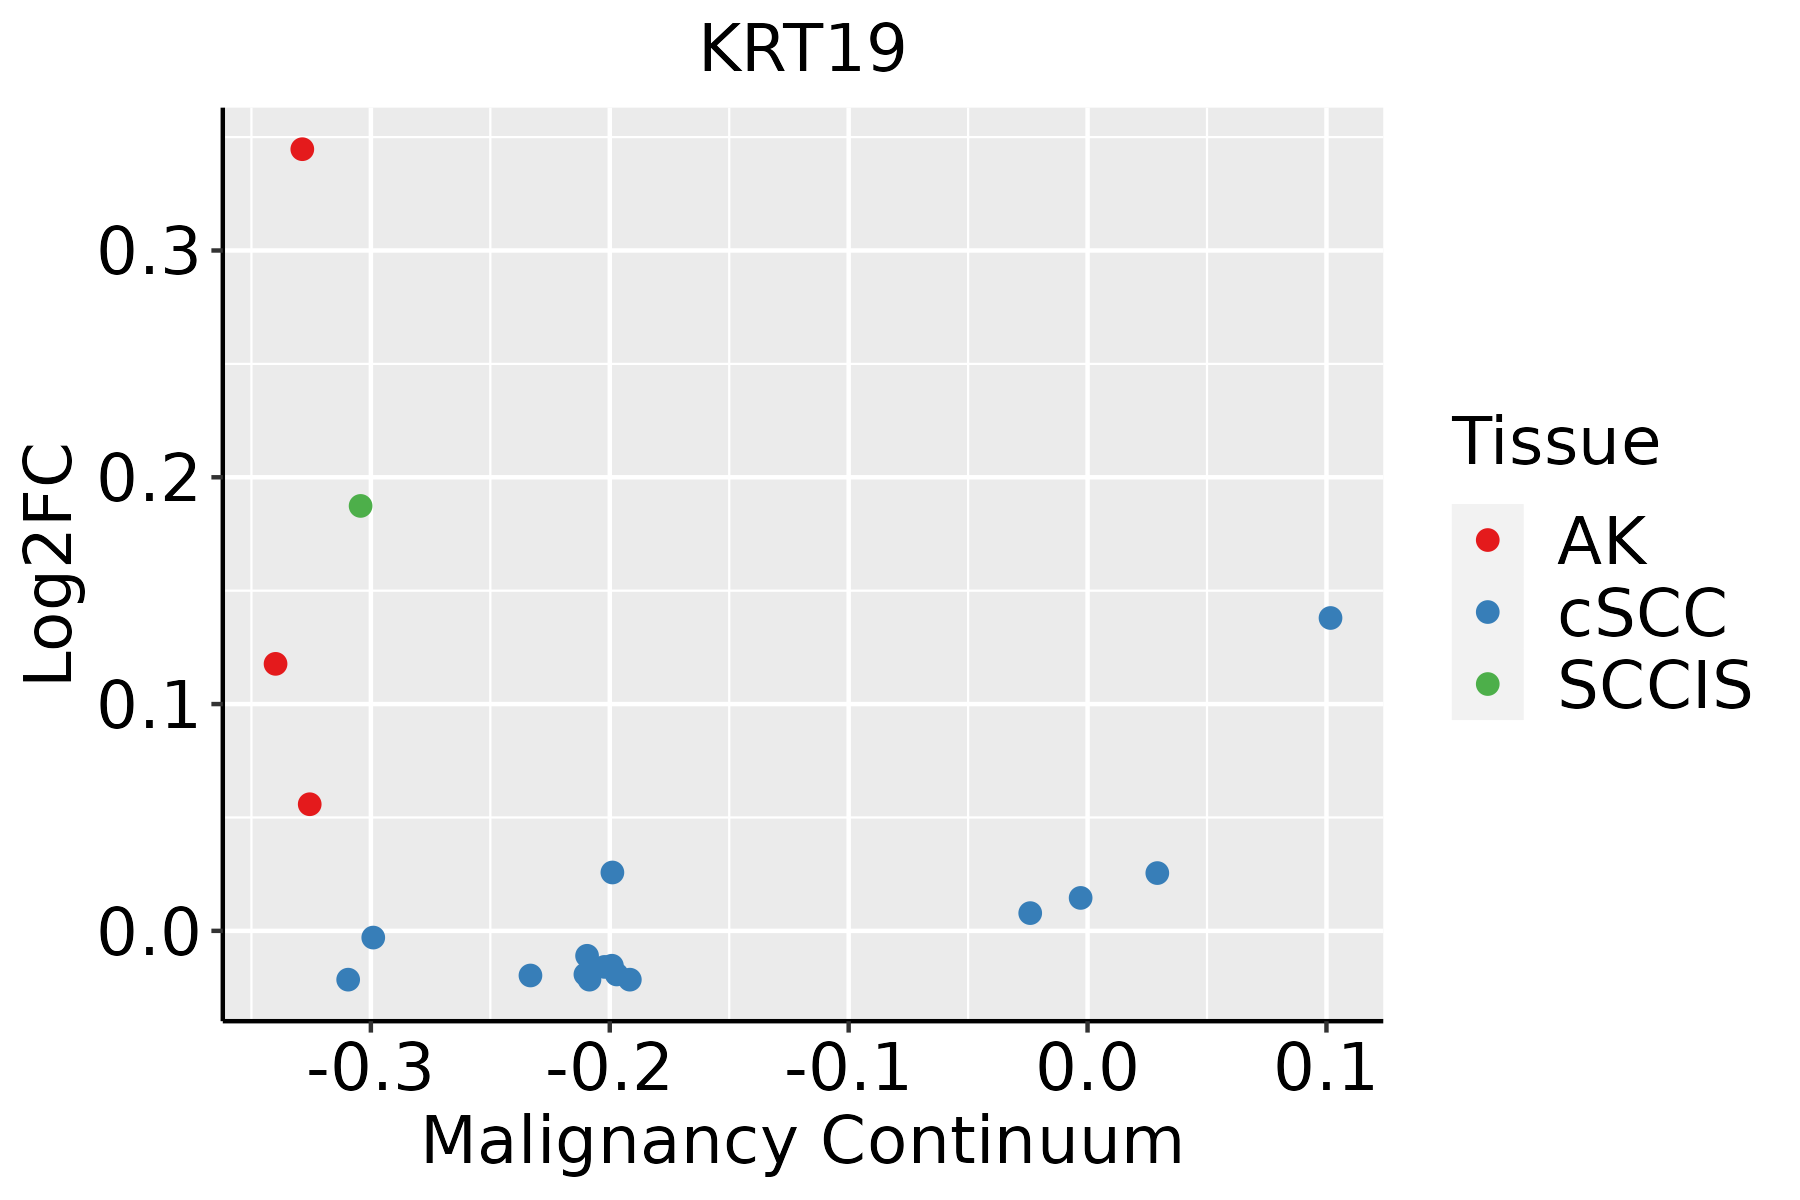 | AK: Actinic keratosis |
| cSCC: Cutaneous squamous cell carcinoma | ||
| SCCIS:squamous cell carcinoma in situ | ||
| Thyroid | 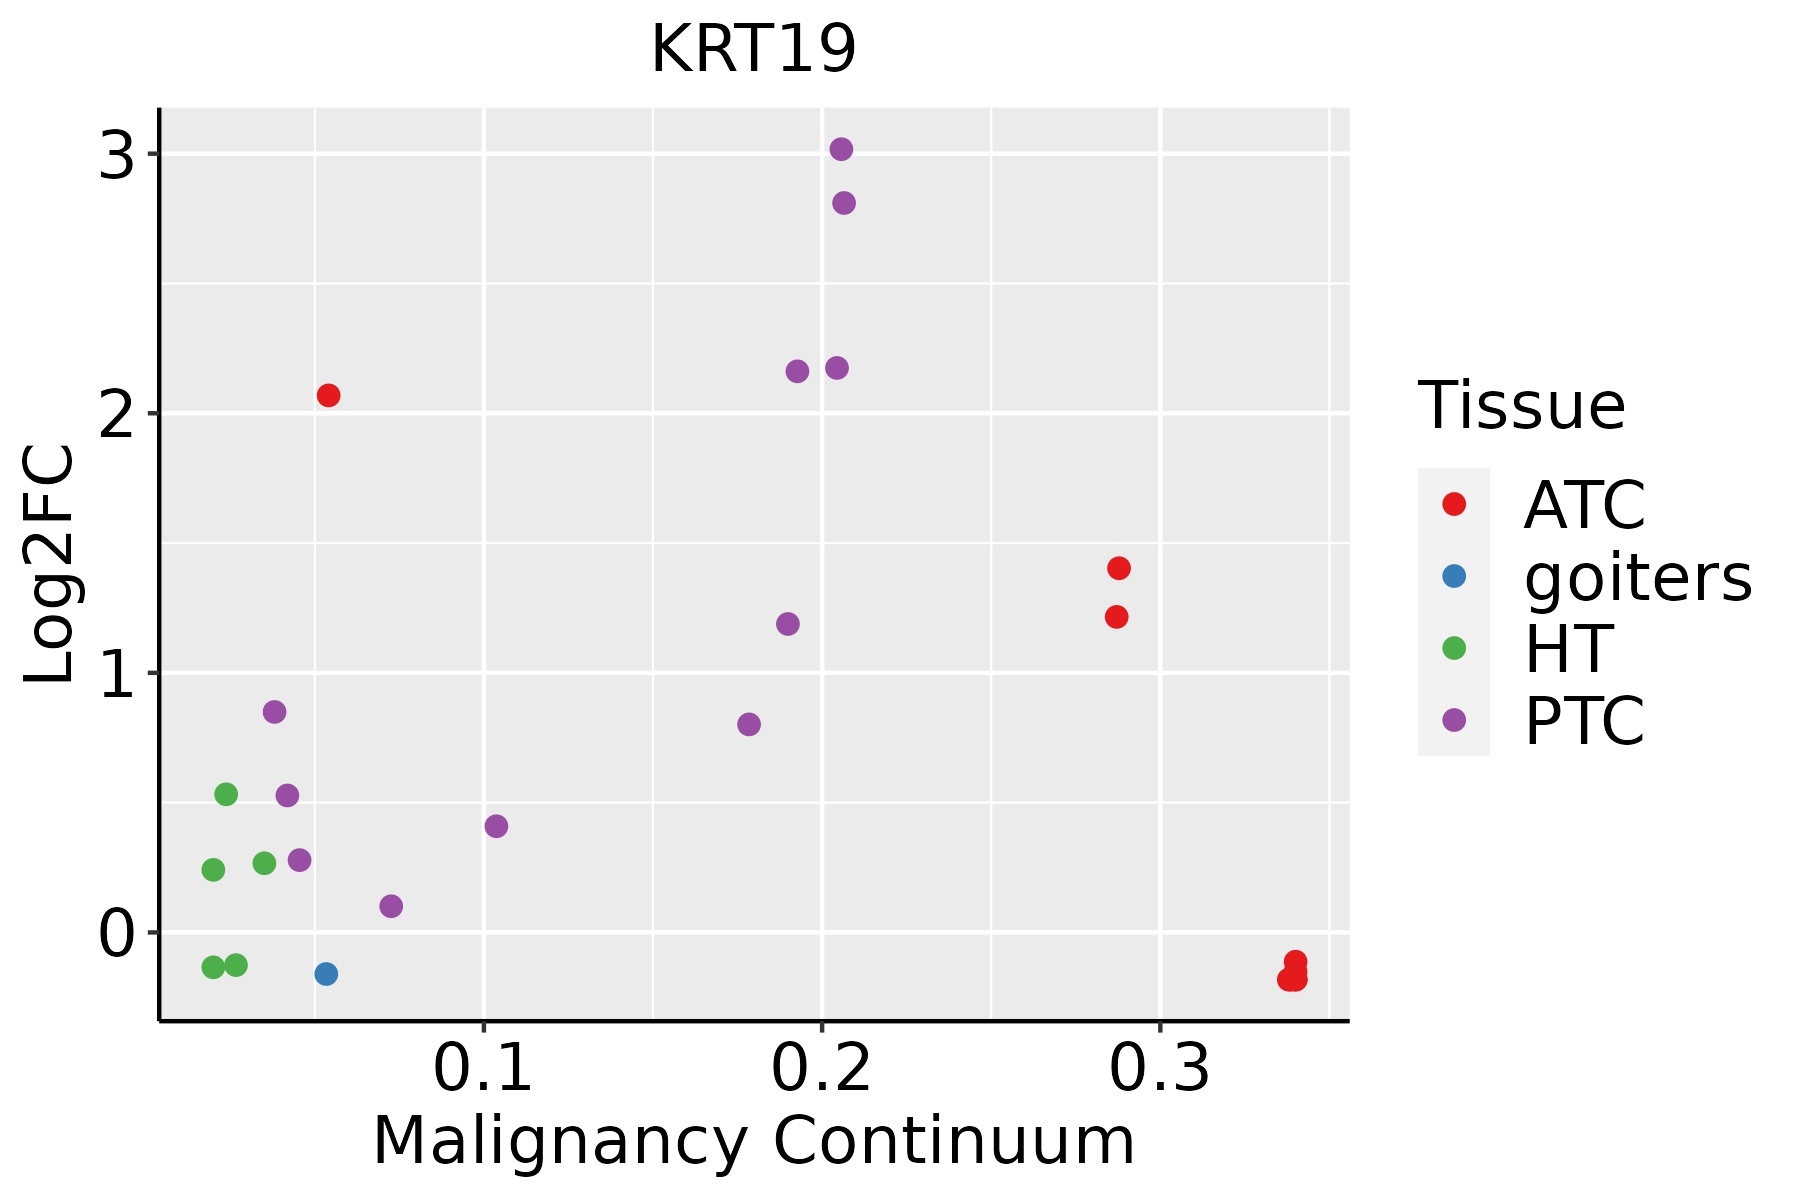 | ATC: Anaplastic thyroid cancer |
| HT: Hashimoto's thyroiditis | ||
| PTC: Papillary thyroid cancer |
| ∗log2FC in expression of this searched gene in stem-like cells from each diseased tissue sample relative to stem-like cells in normal samples in each tissue plotted against the malignancy continuum. Samples are colored based on if they are from different disease stage. |
Top |
Malignant transformation related pathway analysis |
| Find out the enriched GO biological processes and KEGG pathways involved in transition from healthy to precancer to cancer |
| Tissue | Disease Stage | Enriched GO biological Processes |
| Colorectum | AD |  |
| Colorectum | SER |  |
| Colorectum | MSS |  |
| Colorectum | MSI-H |  |
| Colorectum | FAP |  |
| ∗Top 15 enriched GO BP terms are showed in the bar plot of each disease state in each tissue. Each row represents a significant GO biological process which is colored according to the -log10(p.adjust). |
| Page: 1 2 3 4 5 6 7 8 9 |
| GO ID | Tissue | Disease Stage | Description | Gene Ratio | Bg Ratio | pvalue | p.adjust | Count |
| GO:000189016 | Prostate | Tumor | placenta development | 52/3246 | 144/18723 | 4.96e-08 | 1.52e-06 | 52 |
| GO:000189215 | Prostate | Tumor | embryonic placenta development | 34/3246 | 82/18723 | 2.41e-07 | 5.65e-06 | 34 |
| GO:003103216 | Prostate | Tumor | actomyosin structure organization | 63/3246 | 196/18723 | 2.94e-07 | 6.72e-06 | 63 |
| GO:006070611 | Prostate | Tumor | cell differentiation involved in embryonic placenta development | 13/3246 | 25/18723 | 8.09e-05 | 8.19e-04 | 13 |
| GO:004269213 | Prostate | Tumor | muscle cell differentiation | 93/3246 | 384/18723 | 3.45e-04 | 2.73e-03 | 93 |
| GO:005114614 | Prostate | Tumor | striated muscle cell differentiation | 69/3246 | 283/18723 | 1.56e-03 | 9.54e-03 | 69 |
| GO:000721912 | Prostate | Tumor | Notch signaling pathway | 44/3246 | 172/18723 | 4.02e-03 | 2.04e-02 | 44 |
| GO:00550011 | Prostate | Tumor | muscle cell development | 45/3246 | 184/18723 | 8.73e-03 | 3.78e-02 | 45 |
| GO:00485685 | Prostate | Tumor | embryonic organ development | 93/3246 | 427/18723 | 9.84e-03 | 4.18e-02 | 93 |
| GO:000170120 | Skin | AK | in utero embryonic development | 75/1910 | 367/18723 | 3.09e-09 | 2.62e-07 | 75 |
| GO:004860819 | Skin | AK | reproductive structure development | 77/1910 | 424/18723 | 3.56e-07 | 1.36e-05 | 77 |
| GO:006145820 | Skin | AK | reproductive system development | 77/1910 | 427/18723 | 4.76e-07 | 1.74e-05 | 77 |
| GO:000189020 | Skin | AK | placenta development | 33/1910 | 144/18723 | 6.49e-06 | 1.47e-04 | 33 |
| GO:000189220 | Skin | AK | embryonic placenta development | 22/1910 | 82/18723 | 1.65e-05 | 3.16e-04 | 22 |
| GO:00426928 | Skin | AK | muscle cell differentiation | 64/1910 | 384/18723 | 5.51e-05 | 8.38e-04 | 64 |
| GO:00072198 | Skin | AK | Notch signaling pathway | 34/1910 | 172/18723 | 1.20e-04 | 1.50e-03 | 34 |
| GO:003103220 | Skin | AK | actomyosin structure organization | 37/1910 | 196/18723 | 1.67e-04 | 1.94e-03 | 37 |
| GO:00109273 | Skin | AK | cellular component assembly involved in morphogenesis | 20/1910 | 107/18723 | 5.45e-03 | 3.02e-02 | 20 |
| GO:00550014 | Skin | AK | muscle cell development | 30/1910 | 184/18723 | 6.62e-03 | 3.50e-02 | 30 |
| GO:00436276 | Skin | AK | response to estrogen | 15/1910 | 75/18723 | 8.02e-03 | 4.05e-02 | 15 |
| Page: 1 2 3 4 5 6 7 8 9 10 11 12 13 |
| Pathway ID | Tissue | Disease Stage | Description | Gene Ratio | Bg Ratio | pvalue | p.adjust | qvalue | Count |
| hsa0491518 | Breast | Precancer | Estrogen signaling pathway | 28/684 | 138/8465 | 4.10e-06 | 5.39e-05 | 4.13e-05 | 28 |
| hsa0491519 | Breast | Precancer | Estrogen signaling pathway | 28/684 | 138/8465 | 4.10e-06 | 5.39e-05 | 4.13e-05 | 28 |
| hsa0491523 | Breast | IDC | Estrogen signaling pathway | 35/867 | 138/8465 | 2.55e-07 | 5.18e-06 | 3.88e-06 | 35 |
| hsa0491533 | Breast | IDC | Estrogen signaling pathway | 35/867 | 138/8465 | 2.55e-07 | 5.18e-06 | 3.88e-06 | 35 |
| hsa0491542 | Breast | DCIS | Estrogen signaling pathway | 35/846 | 138/8465 | 1.40e-07 | 2.51e-06 | 1.85e-06 | 35 |
| hsa0491552 | Breast | DCIS | Estrogen signaling pathway | 35/846 | 138/8465 | 1.40e-07 | 2.51e-06 | 1.85e-06 | 35 |
| hsa0491520 | Cervix | CC | Estrogen signaling pathway | 44/1267 | 138/8465 | 3.55e-07 | 3.97e-06 | 2.35e-06 | 44 |
| hsa04915110 | Cervix | CC | Estrogen signaling pathway | 44/1267 | 138/8465 | 3.55e-07 | 3.97e-06 | 2.35e-06 | 44 |
| hsa051504 | Cervix | HSIL_HPV | Staphylococcus aureus infection | 21/459 | 96/8465 | 2.93e-08 | 1.43e-06 | 1.16e-06 | 21 |
| hsa0491524 | Cervix | HSIL_HPV | Estrogen signaling pathway | 19/459 | 138/8465 | 1.54e-04 | 1.74e-03 | 1.40e-03 | 19 |
| hsa0515011 | Cervix | HSIL_HPV | Staphylococcus aureus infection | 21/459 | 96/8465 | 2.93e-08 | 1.43e-06 | 1.16e-06 | 21 |
| hsa0491534 | Cervix | HSIL_HPV | Estrogen signaling pathway | 19/459 | 138/8465 | 1.54e-04 | 1.74e-03 | 1.40e-03 | 19 |
| hsa051502 | Cervix | N_HPV | Staphylococcus aureus infection | 15/349 | 96/8465 | 7.81e-06 | 1.01e-04 | 7.90e-05 | 15 |
| hsa0491543 | Cervix | N_HPV | Estrogen signaling pathway | 16/349 | 138/8465 | 1.68e-04 | 1.53e-03 | 1.19e-03 | 16 |
| hsa051503 | Cervix | N_HPV | Staphylococcus aureus infection | 15/349 | 96/8465 | 7.81e-06 | 1.01e-04 | 7.90e-05 | 15 |
| hsa0491553 | Cervix | N_HPV | Estrogen signaling pathway | 16/349 | 138/8465 | 1.68e-04 | 1.53e-03 | 1.19e-03 | 16 |
| hsa04915 | Colorectum | SER | Estrogen signaling pathway | 38/1580 | 138/8465 | 6.51e-03 | 3.68e-02 | 2.67e-02 | 38 |
| hsa049151 | Colorectum | SER | Estrogen signaling pathway | 38/1580 | 138/8465 | 6.51e-03 | 3.68e-02 | 2.67e-02 | 38 |
| hsa049152 | Colorectum | MSS | Estrogen signaling pathway | 48/1875 | 138/8465 | 4.23e-04 | 3.08e-03 | 1.89e-03 | 48 |
| hsa049153 | Colorectum | MSS | Estrogen signaling pathway | 48/1875 | 138/8465 | 4.23e-04 | 3.08e-03 | 1.89e-03 | 48 |
| Page: 1 2 3 |
Top |
Cell-cell communication analysis |
| Identification of potential cell-cell interactions between two cell types and their ligand-receptor pairs for different disease states |
| Ligand | Receptor | LRpair | Pathway | Tissue | Disease Stage |
| Page: 1 |
Top |
Single-cell gene regulatory network inference analysis |
| Find out the significant the regulons (TFs) and the target genes of each regulon across cell types for different disease states |
| TF | Cell Type | Tissue | Disease Stage | Target Gene | RSS | Regulon Activity |
| ∗The dot plots of a searched regulon are shown for all cell subpopulations in each disease state of each tissue based on the regulon specific score inferred using pySCENIC and by calculating the average expression. |
| Page: 1 |
Top |
Somatic mutation of malignant transformation related genes |
| Annotation of somatic variants for genes involved in malignant transformation |
| Hugo Symbol | Variant Class | Variant Classification | dbSNP RS | HGVSc | HGVSp | HGVSp Short | SWISSPROT | BIOTYPE | SIFT | PolyPhen | Tumor Sample Barcode | Tissue | Histology | Sex | Age | Stage | Therapy Types | Drugs | Outcome |
| KRT19 | SNV | Missense_Mutation | c.1063N>A | p.Asp355Asn | p.D355N | P08727 | protein_coding | deleterious(0) | probably_damaging(0.948) | TCGA-AC-A23H-01 | Breast | breast invasive carcinoma | Female | >=65 | I/II | Unknown | Unknown | PD | |
| KRT19 | SNV | Missense_Mutation | rs766547777 | c.1073G>A | p.Arg358Gln | p.R358Q | P08727 | protein_coding | tolerated(0.34) | benign(0.103) | TCGA-AO-A0J6-01 | Breast | breast invasive carcinoma | Female | <65 | I/II | Chemotherapy | doxorubicin | SD |
| KRT19 | SNV | Missense_Mutation | novel | c.964N>C | p.Asp322His | p.D322H | P08727 | protein_coding | deleterious(0) | possibly_damaging(0.516) | TCGA-GM-A3NW-01 | Breast | breast invasive carcinoma | Female | <65 | I/II | Chemotherapy | fluorouracil | SD |
| KRT19 | insertion | Frame_Shift_Ins | novel | c.612dupC | p.Glu205ArgfsTer15 | p.E205Rfs*15 | P08727 | protein_coding | TCGA-A8-A081-01 | Breast | breast invasive carcinoma | Female | >=65 | I/II | Unknown | Unknown | SD | ||
| KRT19 | SNV | Missense_Mutation | rs146228111 | c.527N>A | p.Arg176His | p.R176H | P08727 | protein_coding | deleterious(0.03) | possibly_damaging(0.479) | TCGA-2W-A8YY-01 | Cervix | cervical & endocervical cancer | Female | <65 | I/II | Chemotherapy | cisplatin | CR |
| KRT19 | SNV | Missense_Mutation | novel | c.617G>A | p.Gly206Asp | p.G206D | P08727 | protein_coding | tolerated(0.08) | benign(0.049) | TCGA-VS-A9U6-01 | Cervix | cervical & endocervical cancer | Female | <65 | I/II | Chemotherapy | cisplatin | PD |
| KRT19 | SNV | Missense_Mutation | c.1122G>T | p.Glu374Asp | p.E374D | P08727 | protein_coding | deleterious(0) | probably_damaging(0.988) | TCGA-AA-A010-01 | Colorectum | colon adenocarcinoma | Female | <65 | I/II | Chemotherapy | folinic | CR | |
| KRT19 | SNV | Missense_Mutation | novel | c.655N>A | p.Glu219Lys | p.E219K | P08727 | protein_coding | deleterious(0.01) | probably_damaging(0.999) | TCGA-CA-6717-01 | Colorectum | colon adenocarcinoma | Male | <65 | I/II | Chemotherapy | oxaliplatin | CR |
| KRT19 | SNV | Missense_Mutation | c.178N>T | p.Ala60Ser | p.A60S | P08727 | protein_coding | tolerated(0.33) | benign(0) | TCGA-CM-4743-01 | Colorectum | colon adenocarcinoma | Male | >=65 | I/II | Chemotherapy | capecitabine | SD | |
| KRT19 | SNV | Missense_Mutation | c.355N>A | p.Gln119Lys | p.Q119K | P08727 | protein_coding | tolerated(0.1) | possibly_damaging(0.731) | TCGA-AF-3911-01 | Colorectum | rectum adenocarcinoma | Male | <65 | III/IV | Chemotherapy | 5-fu | PD |
| Page: 1 2 3 4 |
Top |
Related drugs of malignant transformation related genes |
| Identification of chemicals and drugs interact with genes involved in malignant transfromation |
| (DGIdb 4.0) |
| Entrez ID | Symbol | Category | Interaction Types | Drug Claim Name | Drug Name | PMIDs |
| 3880 | KRT19 | DRUGGABLE GENOME | PD-98059 | CHEMBL35482 | 15793288 | |
| 3880 | KRT19 | DRUGGABLE GENOME | DEXAMETHASONE | DEXAMETHASONE | 15793288 |
| Page: 1 |

Copyright 2023-Present -The University of Texas Health Science Center at Houston |