
|
|||||
|
 | |
| |
| |
| |
| |
| |
|
Gene: ICK |
Gene summary for ICK |
| Gene information | Species | Human | Gene symbol | ICK | Gene ID | 22858 |
| Gene name | ciliogenesis associated kinase 1 | |
| Gene Alias | ECO | |
| Cytomap | 6p12.1 | |
| Gene Type | protein-coding | GO ID | GO:0006464 | UniProtAcc | A0A024RD59 |
Top |
Malignant transformation analysis |
| Identification of the aberrant gene expression in precancerous and cancerous lesions by comparing the gene expression of stem-like cells in diseased tissues with normal stem cells |
| Entrez ID | Symbol | Replicates | Species | Organ | Tissue | Adj P-value | Log2FC | Malignancy |
| 22858 | ICK | LZE2D | Human | Esophagus | HGIN | 8.16e-03 | 4.22e-01 | 0.0642 |
| 22858 | ICK | LZE2T | Human | Esophagus | ESCC | 4.21e-05 | 1.13e+00 | 0.082 |
| 22858 | ICK | LZE4T | Human | Esophagus | ESCC | 3.24e-08 | 1.78e-01 | 0.0811 |
| 22858 | ICK | LZE5T | Human | Esophagus | ESCC | 1.81e-03 | 4.51e-01 | 0.0514 |
| 22858 | ICK | LZE7T | Human | Esophagus | ESCC | 4.11e-11 | 6.09e-01 | 0.0667 |
| 22858 | ICK | LZE8T | Human | Esophagus | ESCC | 5.97e-04 | 6.92e-02 | 0.067 |
| 22858 | ICK | LZE20T | Human | Esophagus | ESCC | 5.26e-05 | 2.78e-01 | 0.0662 |
| 22858 | ICK | LZE24T | Human | Esophagus | ESCC | 2.22e-16 | 4.97e-01 | 0.0596 |
| 22858 | ICK | LZE21T | Human | Esophagus | ESCC | 3.36e-07 | 3.86e-01 | 0.0655 |
| 22858 | ICK | P1T-E | Human | Esophagus | ESCC | 2.28e-07 | 4.15e-01 | 0.0875 |
| 22858 | ICK | P2T-E | Human | Esophagus | ESCC | 1.43e-15 | 3.08e-01 | 0.1177 |
| 22858 | ICK | P4T-E | Human | Esophagus | ESCC | 6.71e-31 | 7.56e-01 | 0.1323 |
| 22858 | ICK | P5T-E | Human | Esophagus | ESCC | 2.98e-03 | 7.61e-02 | 0.1327 |
| 22858 | ICK | P8T-E | Human | Esophagus | ESCC | 9.58e-14 | 2.75e-01 | 0.0889 |
| 22858 | ICK | P9T-E | Human | Esophagus | ESCC | 9.95e-20 | 4.63e-01 | 0.1131 |
| 22858 | ICK | P10T-E | Human | Esophagus | ESCC | 7.51e-16 | 3.66e-01 | 0.116 |
| 22858 | ICK | P11T-E | Human | Esophagus | ESCC | 2.23e-04 | 1.88e-01 | 0.1426 |
| 22858 | ICK | P12T-E | Human | Esophagus | ESCC | 8.75e-31 | 8.12e-01 | 0.1122 |
| 22858 | ICK | P15T-E | Human | Esophagus | ESCC | 1.10e-14 | 2.92e-01 | 0.1149 |
| 22858 | ICK | P16T-E | Human | Esophagus | ESCC | 8.31e-19 | 4.04e-01 | 0.1153 |
| Page: 1 2 3 4 5 |
| Tissue | Expression Dynamics | Abbreviation |
| Esophagus | 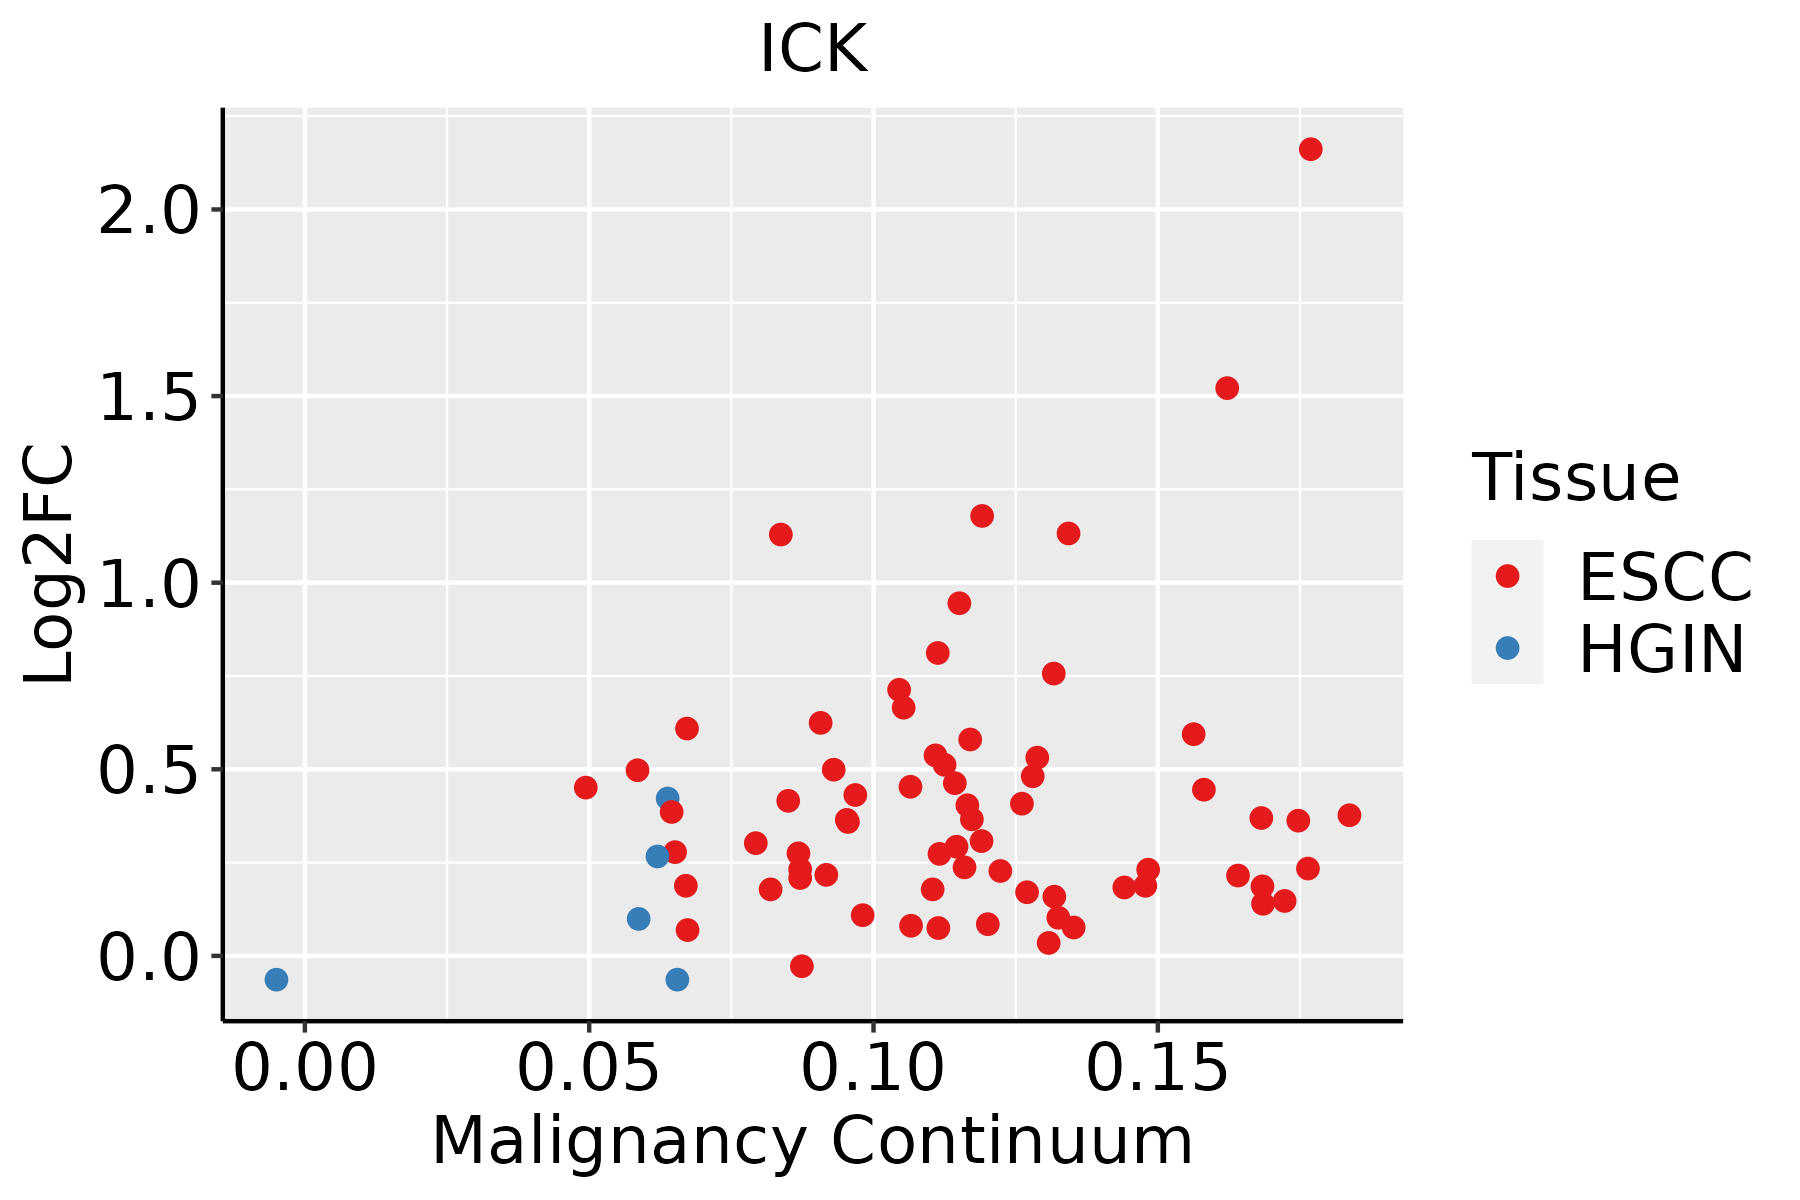 | ESCC: Esophageal squamous cell carcinoma |
| HGIN: High-grade intraepithelial neoplasias | ||
| LGIN: Low-grade intraepithelial neoplasias | ||
| Liver | 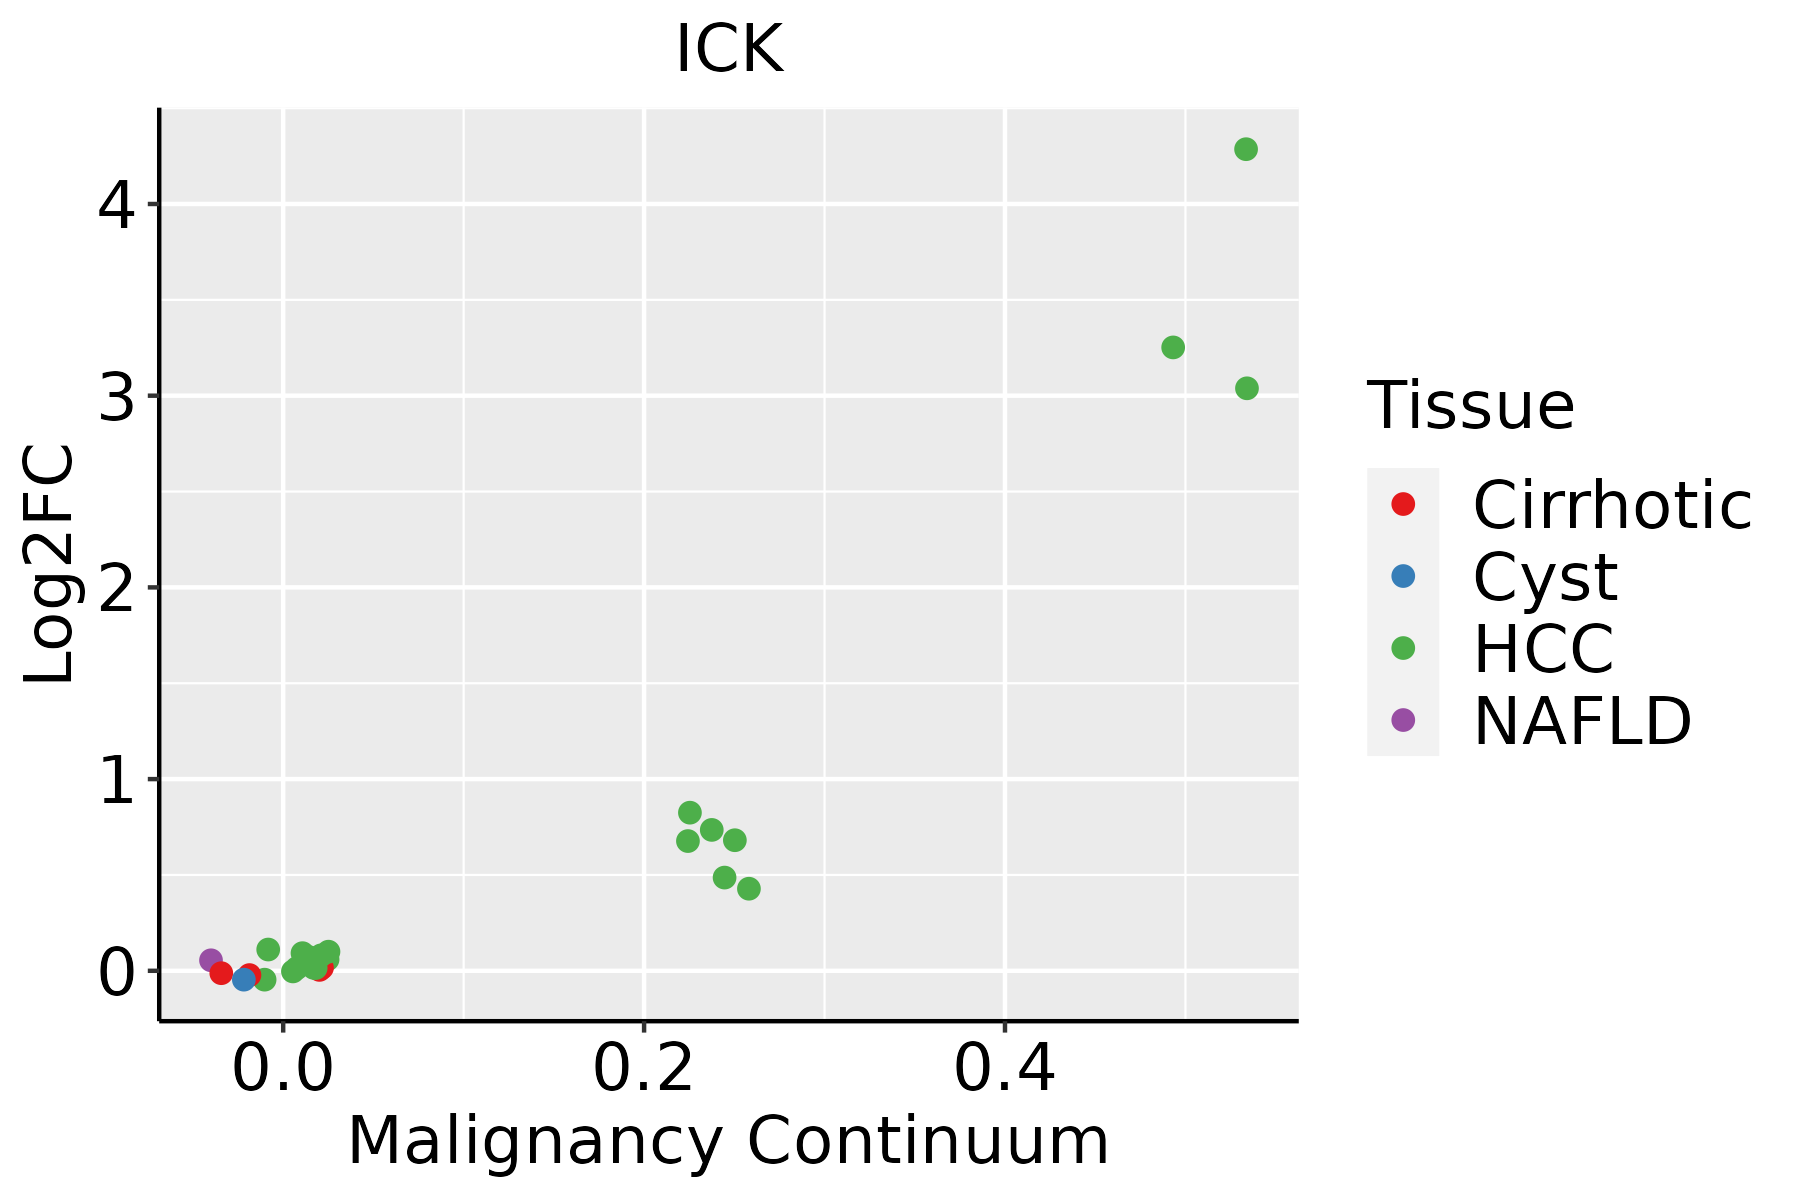 | HCC: Hepatocellular carcinoma |
| NAFLD: Non-alcoholic fatty liver disease | ||
| Oral Cavity |  | EOLP: Erosive Oral lichen planus |
| LP: leukoplakia | ||
| NEOLP: Non-erosive oral lichen planus | ||
| OSCC: Oral squamous cell carcinoma | ||
| Prostate | 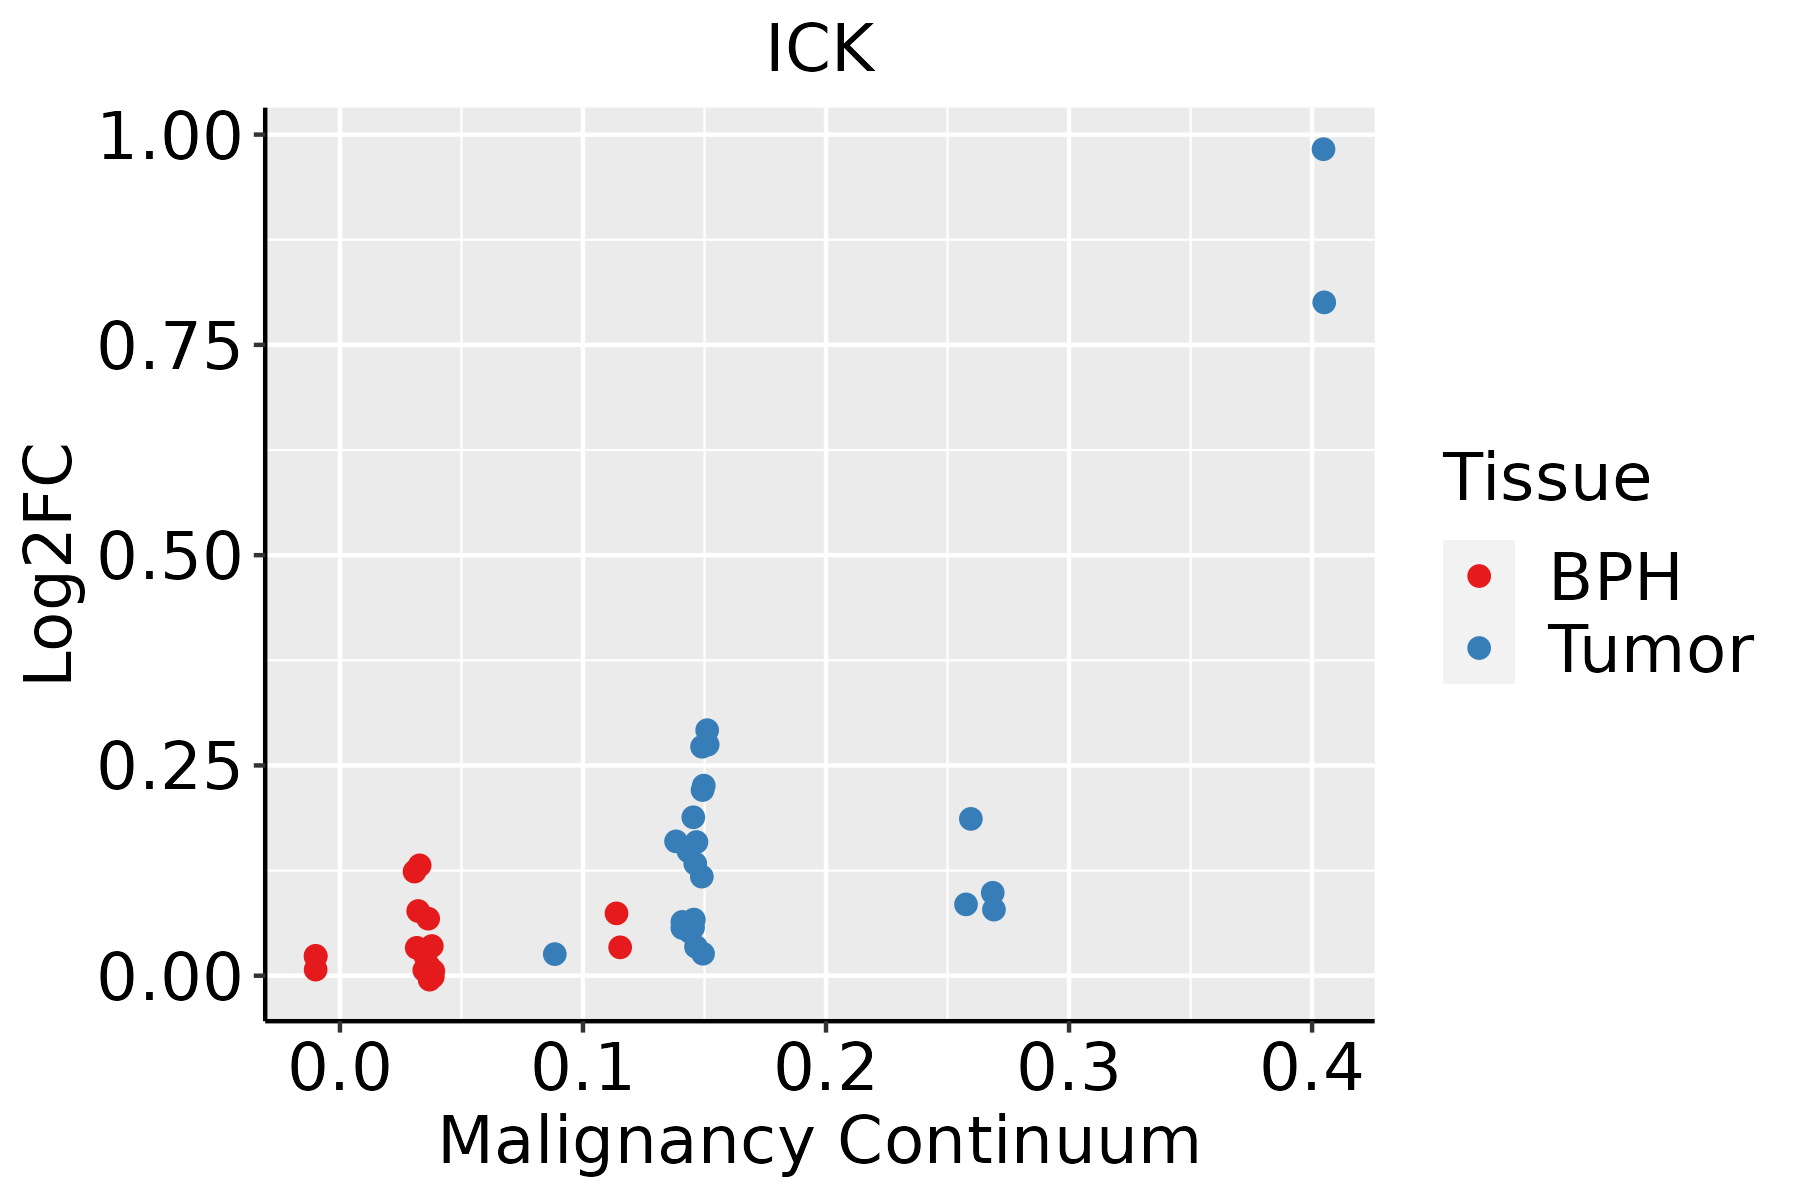 | BPH: Benign Prostatic Hyperplasia |
| Thyroid | 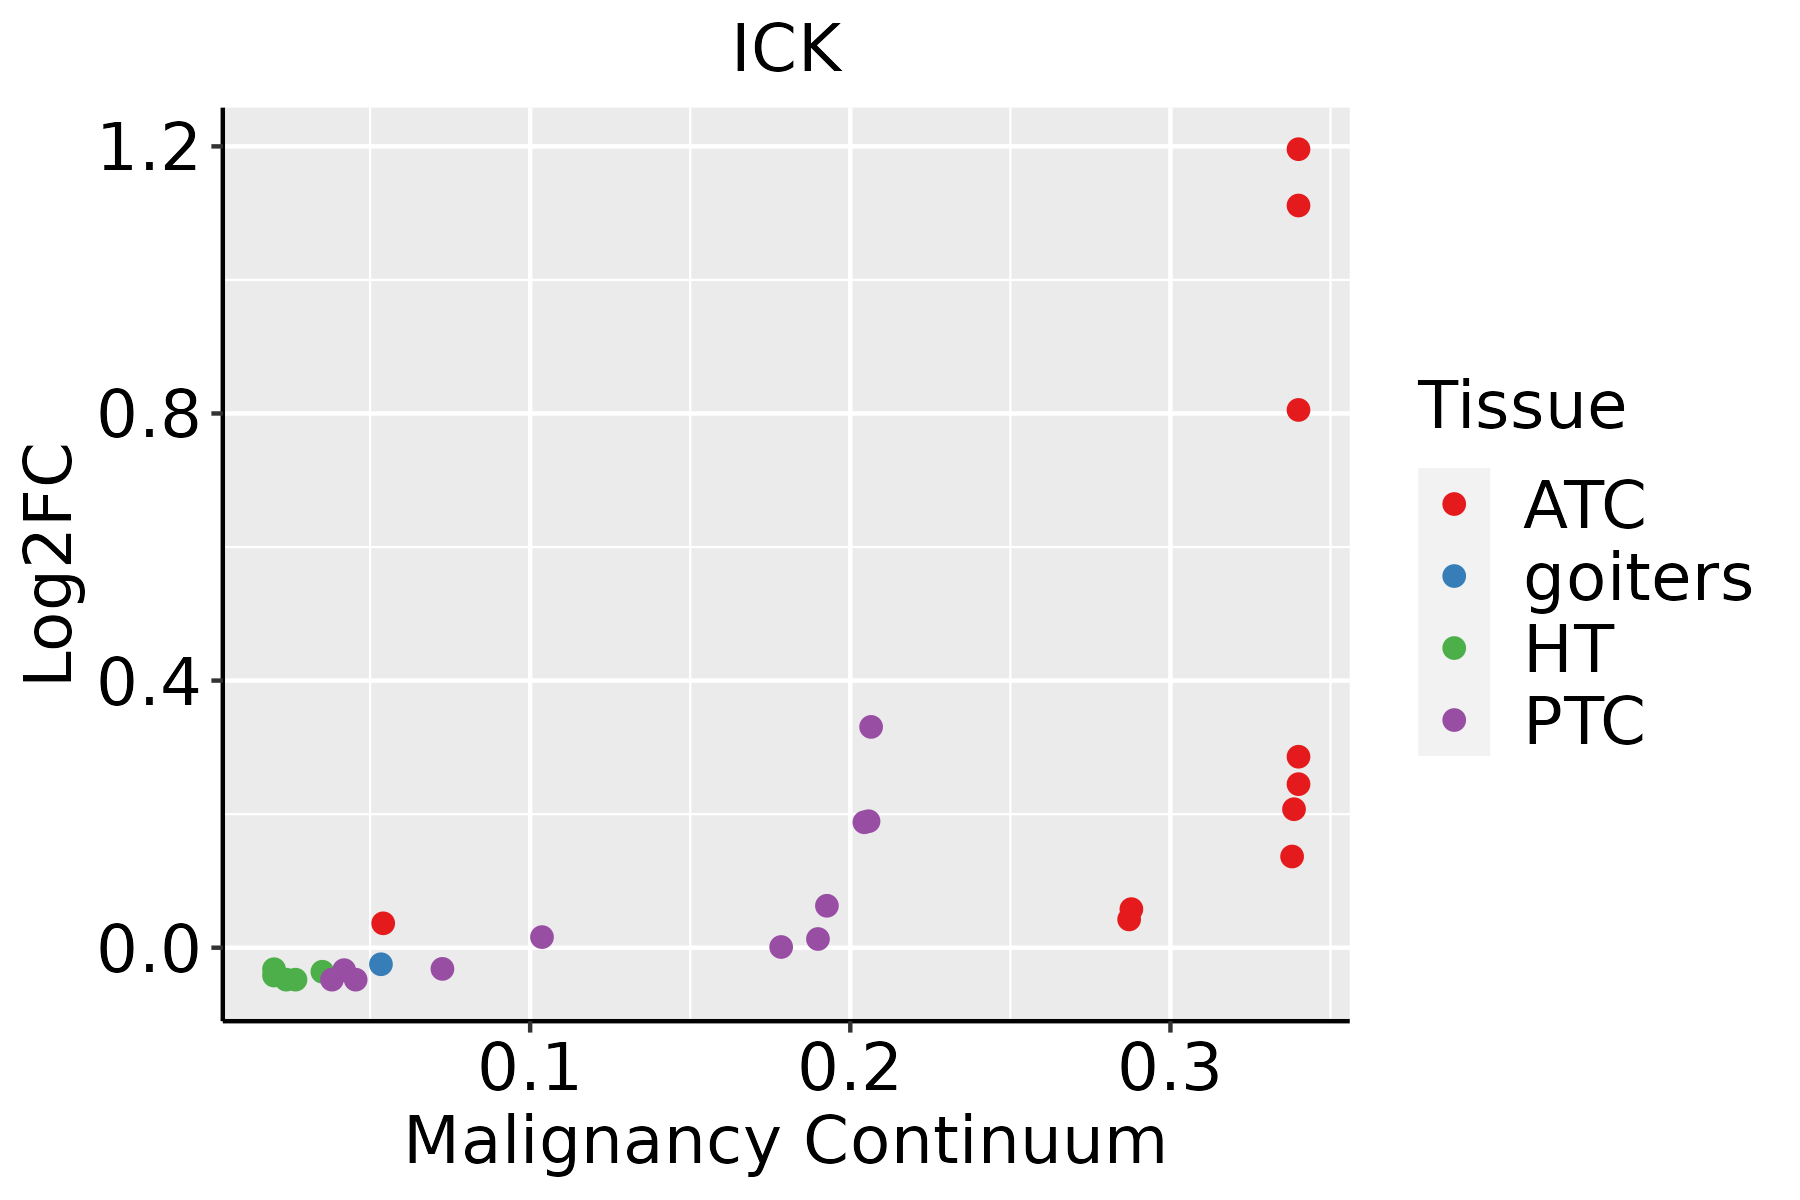 | ATC: Anaplastic thyroid cancer |
| HT: Hashimoto's thyroiditis | ||
| PTC: Papillary thyroid cancer |
| ∗log2FC in expression of this searched gene in stem-like cells from each diseased tissue sample relative to stem-like cells in normal samples in each tissue plotted against the malignancy continuum. Samples are colored based on if they are from different disease stage. |
Top |
Malignant transformation related pathway analysis |
| Find out the enriched GO biological processes and KEGG pathways involved in transition from healthy to precancer to cancer |
| Tissue | Disease Stage | Enriched GO biological Processes |
| Colorectum | AD |  |
| Colorectum | SER |  |
| Colorectum | MSS |  |
| Colorectum | MSI-H |  |
| Colorectum | FAP |  |
| ∗Top 15 enriched GO BP terms are showed in the bar plot of each disease state in each tissue. Each row represents a significant GO biological process which is colored according to the -log10(p.adjust). |
| Page: 1 2 3 4 5 6 7 8 9 |
| GO ID | Tissue | Disease Stage | Description | Gene Ratio | Bg Ratio | pvalue | p.adjust | Count |
| GO:000183817 | Thyroid | PTC | embryonic epithelial tube formation | 64/5968 | 121/18723 | 1.27e-06 | 1.83e-05 | 64 |
| GO:00313989 | Thyroid | PTC | positive regulation of protein ubiquitination | 63/5968 | 119/18723 | 1.47e-06 | 2.08e-05 | 63 |
| GO:001402016 | Thyroid | PTC | primary neural tube formation | 52/5968 | 94/18723 | 2.14e-06 | 2.89e-05 | 52 |
| GO:002191514 | Thyroid | PTC | neural tube development | 76/5968 | 152/18723 | 2.40e-06 | 3.17e-05 | 76 |
| GO:000184310 | Thyroid | PTC | neural tube closure | 49/5968 | 88/18723 | 3.24e-06 | 4.20e-05 | 49 |
| GO:00606069 | Thyroid | PTC | tube closure | 49/5968 | 89/18723 | 4.99e-06 | 6.08e-05 | 49 |
| GO:003514819 | Thyroid | PTC | tube formation | 73/5968 | 148/18723 | 7.04e-06 | 8.31e-05 | 73 |
| GO:006056219 | Thyroid | PTC | epithelial tube morphogenesis | 141/5968 | 325/18723 | 7.52e-06 | 8.73e-05 | 141 |
| GO:007217515 | Thyroid | PTC | epithelial tube formation | 66/5968 | 132/18723 | 1.08e-05 | 1.19e-04 | 66 |
| GO:00163318 | Thyroid | PTC | morphogenesis of embryonic epithelium | 71/5968 | 147/18723 | 2.31e-05 | 2.29e-04 | 71 |
| GO:20007367 | Thyroid | PTC | regulation of stem cell differentiation | 32/5968 | 58/18723 | 2.01e-04 | 1.50e-03 | 32 |
| GO:200073716 | Thyroid | PTC | negative regulation of stem cell differentiation | 16/5968 | 23/18723 | 2.31e-04 | 1.67e-03 | 16 |
| GO:003017810 | Thyroid | PTC | negative regulation of Wnt signaling pathway | 74/5968 | 170/18723 | 8.99e-04 | 5.48e-03 | 74 |
| GO:004886318 | Thyroid | PTC | stem cell differentiation | 85/5968 | 206/18723 | 2.71e-03 | 1.36e-02 | 85 |
| GO:00900907 | Thyroid | PTC | negative regulation of canonical Wnt signaling pathway | 59/5968 | 137/18723 | 3.76e-03 | 1.80e-02 | 59 |
| GO:00017389 | Thyroid | PTC | morphogenesis of a polarized epithelium | 41/5968 | 94/18723 | 1.10e-02 | 4.38e-02 | 41 |
| GO:00608402 | Thyroid | PTC | artery development | 43/5968 | 100/18723 | 1.25e-02 | 4.88e-02 | 43 |
| GO:001049832 | Thyroid | ATC | proteasomal protein catabolic process | 309/6293 | 490/18723 | 1.78e-41 | 1.13e-37 | 309 |
| GO:0043161210 | Thyroid | ATC | proteasome-mediated ubiquitin-dependent protein catabolic process | 265/6293 | 412/18723 | 7.09e-38 | 1.49e-34 | 265 |
| GO:0009896210 | Thyroid | ATC | positive regulation of catabolic process | 290/6293 | 492/18723 | 2.15e-31 | 1.94e-28 | 290 |
| Page: 1 2 3 4 5 6 7 8 9 10 11 12 13 14 |
| Pathway ID | Tissue | Disease Stage | Description | Gene Ratio | Bg Ratio | pvalue | p.adjust | qvalue | Count |
| Page: 1 |
Top |
Cell-cell communication analysis |
| Identification of potential cell-cell interactions between two cell types and their ligand-receptor pairs for different disease states |
| Ligand | Receptor | LRpair | Pathway | Tissue | Disease Stage |
| Page: 1 |
Top |
Single-cell gene regulatory network inference analysis |
| Find out the significant the regulons (TFs) and the target genes of each regulon across cell types for different disease states |
| TF | Cell Type | Tissue | Disease Stage | Target Gene | RSS | Regulon Activity |
| ∗The dot plots of a searched regulon are shown for all cell subpopulations in each disease state of each tissue based on the regulon specific score inferred using pySCENIC and by calculating the average expression. |
| Page: 1 |
Top |
Somatic mutation of malignant transformation related genes |
| Annotation of somatic variants for genes involved in malignant transformation |
| Hugo Symbol | Variant Class | Variant Classification | dbSNP RS | HGVSc | HGVSp | HGVSp Short | SWISSPROT | BIOTYPE | SIFT | PolyPhen | Tumor Sample Barcode | Tissue | Histology | Sex | Age | Stage | Therapy Types | Drugs | Outcome |
| ICK | SNV | Missense_Mutation | novel | c.1348G>C | p.Glu450Gln | p.E450Q | Q9UPZ9 | protein_coding | tolerated(0.15) | benign(0.015) | TCGA-3C-AALI-01 | Breast | breast invasive carcinoma | Female | <65 | I/II | Unspecific | Poly E | Complete Response |
| ICK | SNV | Missense_Mutation | novel | c.1126N>C | p.Ser376Pro | p.S376P | Q9UPZ9 | protein_coding | tolerated(0.14) | benign(0.009) | TCGA-A2-A1G4-01 | Breast | breast invasive carcinoma | Female | >=65 | III/IV | Chemotherapy | adriamycin | SD |
| ICK | SNV | Missense_Mutation | novel | c.1126T>C | p.Ser376Pro | p.S376P | Q9UPZ9 | protein_coding | tolerated(0.14) | benign(0.009) | TCGA-A8-A06R-01 | Breast | breast invasive carcinoma | Female | >=65 | I/II | Chemotherapy | 5-fluorouracil | CR |
| ICK | SNV | Missense_Mutation | c.613G>A | p.Glu205Lys | p.E205K | Q9UPZ9 | protein_coding | deleterious(0) | probably_damaging(0.969) | TCGA-AC-A23H-01 | Breast | breast invasive carcinoma | Female | >=65 | I/II | Unknown | Unknown | PD | |
| ICK | SNV | Missense_Mutation | rs561765544 | c.995G>A | p.Arg332Gln | p.R332Q | Q9UPZ9 | protein_coding | tolerated(0.52) | benign(0.007) | TCGA-AN-A046-01 | Breast | breast invasive carcinoma | Female | >=65 | I/II | Unknown | Unknown | SD |
| ICK | SNV | Missense_Mutation | c.932N>T | p.Ala311Val | p.A311V | Q9UPZ9 | protein_coding | tolerated(0.31) | benign(0.001) | TCGA-AR-A0U0-01 | Breast | breast invasive carcinoma | Female | >=65 | I/II | Unknown | Unknown | SD | |
| ICK | SNV | Missense_Mutation | novel | c.1126N>C | p.Ser376Pro | p.S376P | Q9UPZ9 | protein_coding | tolerated(0.14) | benign(0.009) | TCGA-BH-A1FH-01 | Breast | breast invasive carcinoma | Female | <65 | III/IV | Unknown | Unknown | PD |
| ICK | SNV | Missense_Mutation | novel | c.1126T>C | p.Ser376Pro | p.S376P | Q9UPZ9 | protein_coding | tolerated(0.14) | benign(0.009) | TCGA-C8-A273-01 | Breast | breast invasive carcinoma | Female | <65 | I/II | Hormone Therapy | tamoxiphen | SD |
| ICK | SNV | Missense_Mutation | novel | c.1126N>C | p.Ser376Pro | p.S376P | Q9UPZ9 | protein_coding | tolerated(0.14) | benign(0.009) | TCGA-D8-A1JT-01 | Breast | breast invasive carcinoma | Female | >=65 | I/II | Hormone Therapy | arimidex | SD |
| ICK | SNV | Missense_Mutation | novel | c.1126N>C | p.Ser376Pro | p.S376P | Q9UPZ9 | protein_coding | tolerated(0.14) | benign(0.009) | TCGA-D8-A1XG-01 | Breast | breast invasive carcinoma | Female | >=65 | III/IV | Unknown | Unknown | SD |
| Page: 1 2 3 4 5 6 7 |
Top |
Related drugs of malignant transformation related genes |
| Identification of chemicals and drugs interact with genes involved in malignant transfromation |
| (DGIdb 4.0) |
| Entrez ID | Symbol | Category | Interaction Types | Drug Claim Name | Drug Name | PMIDs |
| Page: 1 |

Copyright 2023-Present -The University of Texas Health Science Center at Houston |