
|
|||||
|
 | |
| |
| |
| |
| |
| |
|
Gene: HSF1 |
Gene summary for HSF1 |
| Gene information | Species | Human | Gene symbol | HSF1 | Gene ID | 3297 |
| Gene name | heat shock transcription factor 1 | |
| Gene Alias | HSTF1 | |
| Cytomap | 8q24.3 | |
| Gene Type | protein-coding | GO ID | GO:0000122 | UniProtAcc | Q00613 |
Top |
Malignant transformation analysis |
| Identification of the aberrant gene expression in precancerous and cancerous lesions by comparing the gene expression of stem-like cells in diseased tissues with normal stem cells |
| Entrez ID | Symbol | Replicates | Species | Organ | Tissue | Adj P-value | Log2FC | Malignancy |
| 3297 | HSF1 | LZE2T | Human | Esophagus | ESCC | 4.98e-08 | 5.04e-01 | 0.082 |
| 3297 | HSF1 | LZE4T | Human | Esophagus | ESCC | 6.05e-13 | 3.94e-01 | 0.0811 |
| 3297 | HSF1 | LZE7T | Human | Esophagus | ESCC | 2.10e-08 | 2.08e-01 | 0.0667 |
| 3297 | HSF1 | LZE8T | Human | Esophagus | ESCC | 3.10e-03 | -1.25e-02 | 0.067 |
| 3297 | HSF1 | LZE20T | Human | Esophagus | ESCC | 1.77e-18 | 6.79e-01 | 0.0662 |
| 3297 | HSF1 | LZE22D1 | Human | Esophagus | HGIN | 6.83e-04 | 2.51e-01 | 0.0595 |
| 3297 | HSF1 | LZE22T | Human | Esophagus | ESCC | 5.60e-07 | 6.26e-01 | 0.068 |
| 3297 | HSF1 | LZE24T | Human | Esophagus | ESCC | 2.22e-32 | 1.05e+00 | 0.0596 |
| 3297 | HSF1 | LZE21T | Human | Esophagus | ESCC | 4.16e-04 | 3.38e-01 | 0.0655 |
| 3297 | HSF1 | P1T-E | Human | Esophagus | ESCC | 6.81e-11 | 6.35e-01 | 0.0875 |
| 3297 | HSF1 | P2T-E | Human | Esophagus | ESCC | 2.04e-65 | 1.02e+00 | 0.1177 |
| 3297 | HSF1 | P4T-E | Human | Esophagus | ESCC | 2.81e-34 | 8.57e-01 | 0.1323 |
| 3297 | HSF1 | P5T-E | Human | Esophagus | ESCC | 1.17e-61 | 1.10e+00 | 0.1327 |
| 3297 | HSF1 | P8T-E | Human | Esophagus | ESCC | 3.92e-40 | 6.49e-01 | 0.0889 |
| 3297 | HSF1 | P9T-E | Human | Esophagus | ESCC | 3.72e-42 | 8.50e-01 | 0.1131 |
| 3297 | HSF1 | P10T-E | Human | Esophagus | ESCC | 1.65e-45 | 7.52e-01 | 0.116 |
| 3297 | HSF1 | P11T-E | Human | Esophagus | ESCC | 3.03e-19 | 9.40e-01 | 0.1426 |
| 3297 | HSF1 | P12T-E | Human | Esophagus | ESCC | 3.85e-56 | 1.11e+00 | 0.1122 |
| 3297 | HSF1 | P15T-E | Human | Esophagus | ESCC | 6.21e-63 | 1.30e+00 | 0.1149 |
| 3297 | HSF1 | P16T-E | Human | Esophagus | ESCC | 1.73e-90 | 1.57e+00 | 0.1153 |
| Page: 1 2 3 4 5 6 7 |
| Tissue | Expression Dynamics | Abbreviation |
| Esophagus |  | ESCC: Esophageal squamous cell carcinoma |
| HGIN: High-grade intraepithelial neoplasias | ||
| LGIN: Low-grade intraepithelial neoplasias | ||
| Liver |  | HCC: Hepatocellular carcinoma |
| NAFLD: Non-alcoholic fatty liver disease | ||
| Oral Cavity | 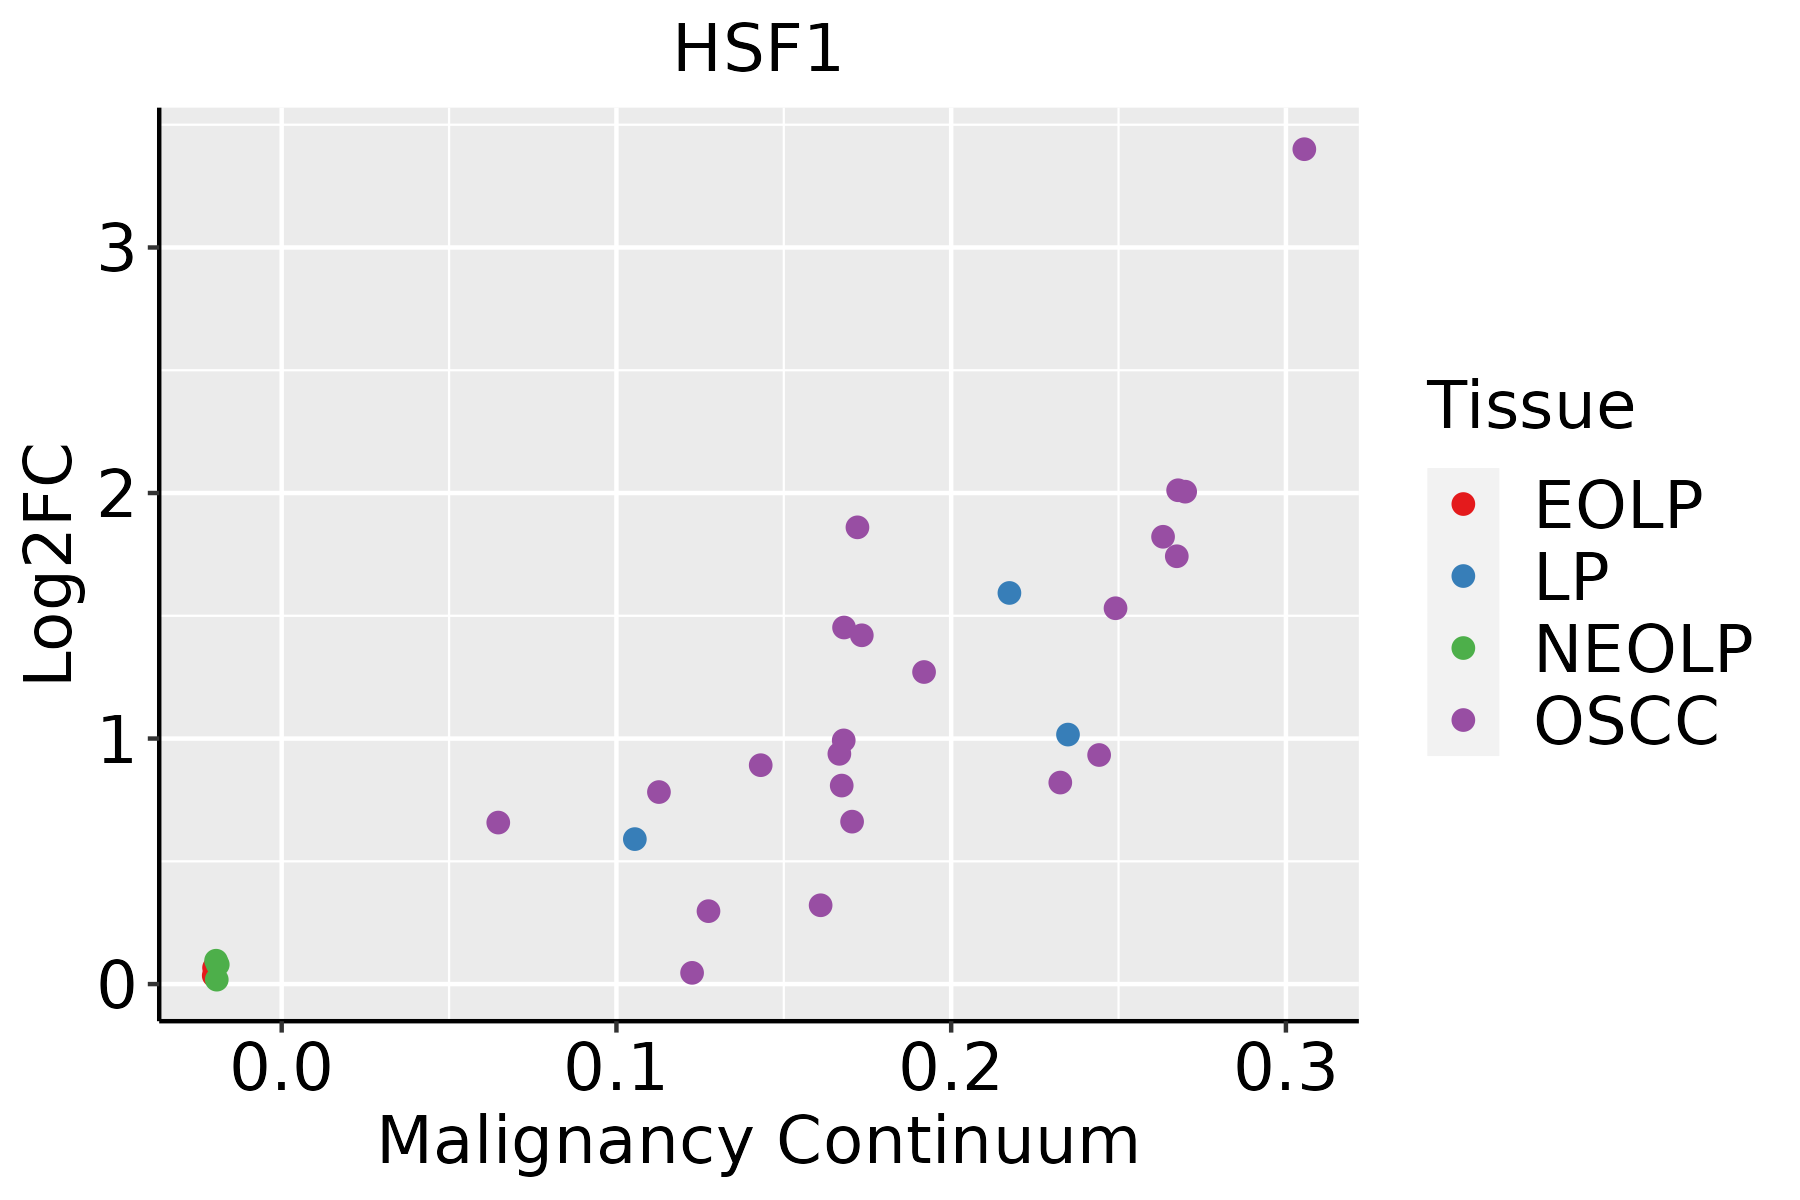 | EOLP: Erosive Oral lichen planus |
| LP: leukoplakia | ||
| NEOLP: Non-erosive oral lichen planus | ||
| OSCC: Oral squamous cell carcinoma | ||
| Skin | 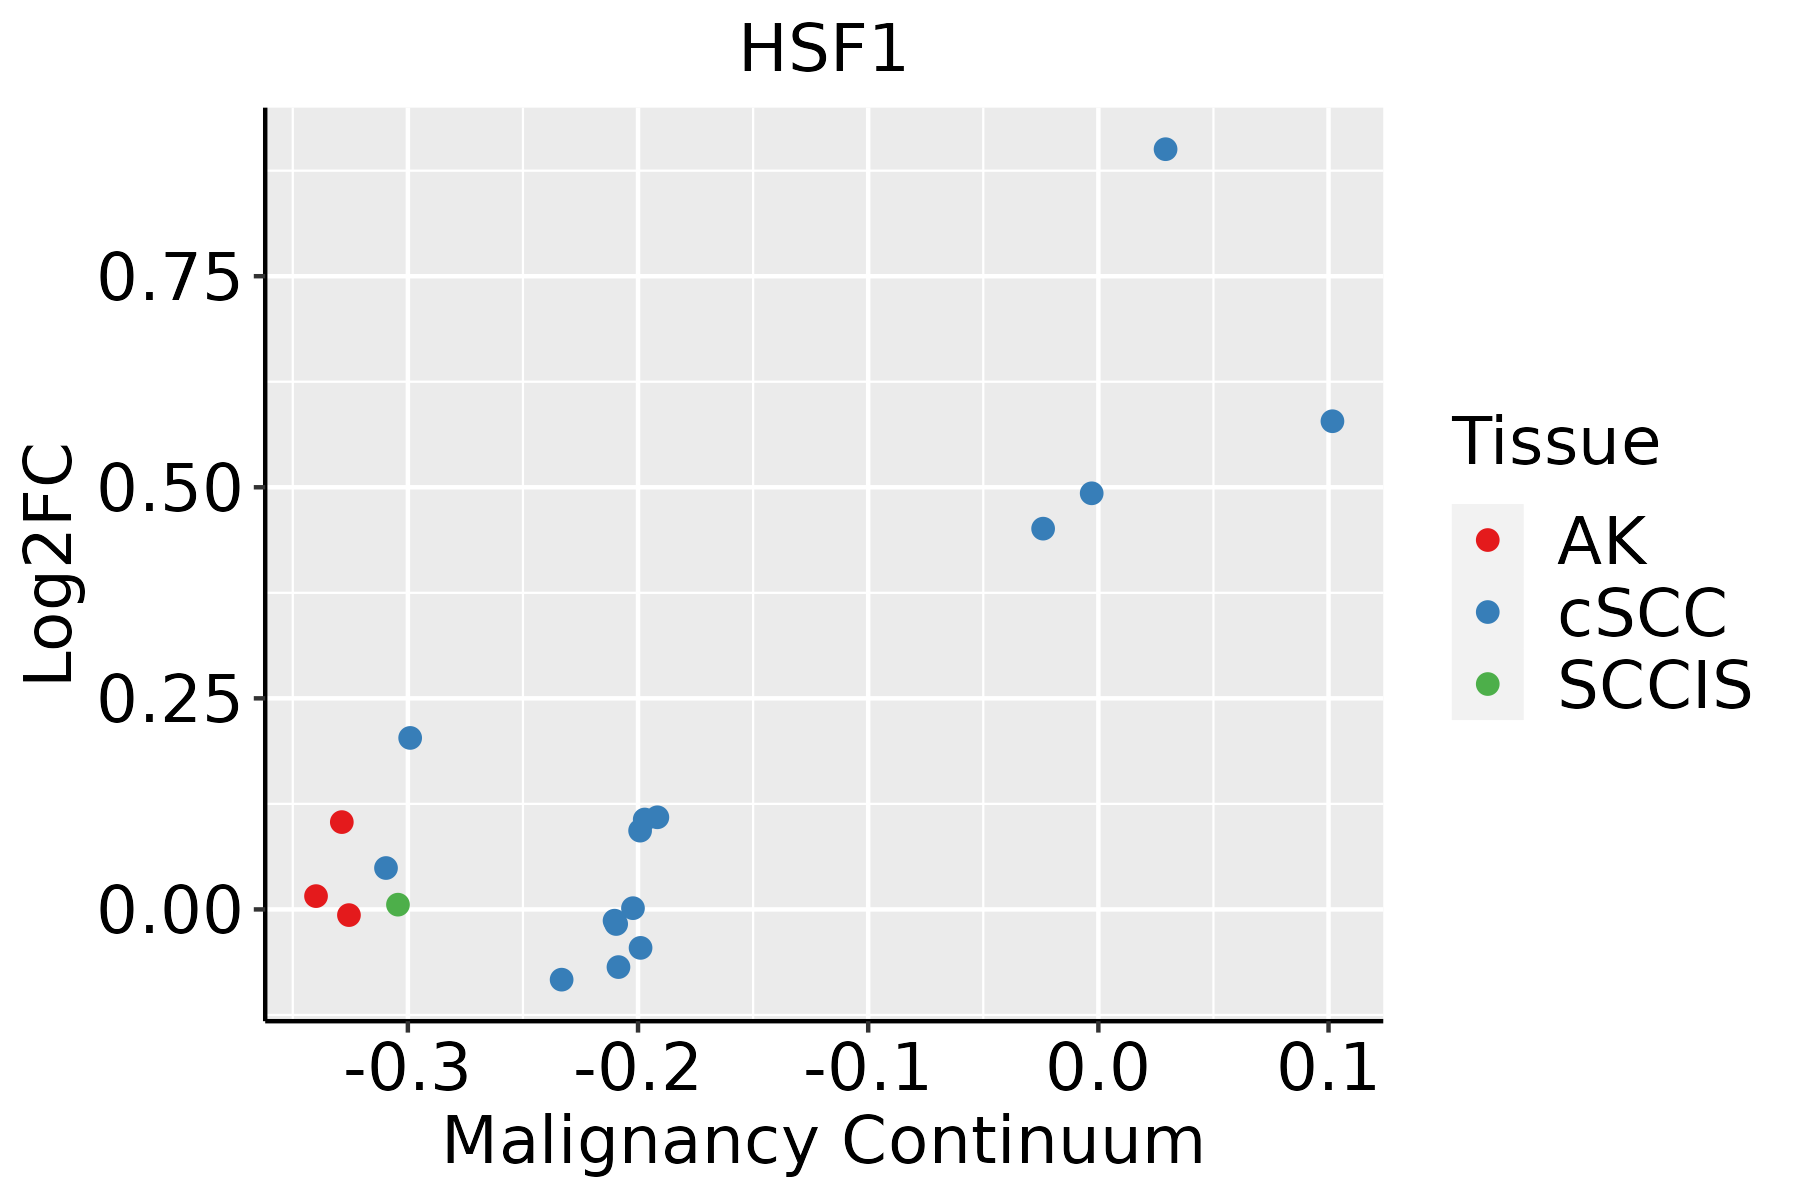 | AK: Actinic keratosis |
| cSCC: Cutaneous squamous cell carcinoma | ||
| SCCIS:squamous cell carcinoma in situ | ||
| Thyroid |  | ATC: Anaplastic thyroid cancer |
| HT: Hashimoto's thyroiditis | ||
| PTC: Papillary thyroid cancer |
| ∗log2FC in expression of this searched gene in stem-like cells from each diseased tissue sample relative to stem-like cells in normal samples in each tissue plotted against the malignancy continuum. Samples are colored based on if they are from different disease stage. |
Top |
Malignant transformation related pathway analysis |
| Find out the enriched GO biological processes and KEGG pathways involved in transition from healthy to precancer to cancer |
| Tissue | Disease Stage | Enriched GO biological Processes |
| Colorectum | AD |  |
| Colorectum | SER |  |
| Colorectum | MSS |  |
| Colorectum | MSI-H |  |
| Colorectum | FAP |  |
| ∗Top 15 enriched GO BP terms are showed in the bar plot of each disease state in each tissue. Each row represents a significant GO biological process which is colored according to the -log10(p.adjust). |
| Page: 1 2 3 4 5 6 7 8 9 |
| GO ID | Tissue | Disease Stage | Description | Gene Ratio | Bg Ratio | pvalue | p.adjust | Count |
| GO:190121516 | Esophagus | ESCC | negative regulation of neuron death | 115/8552 | 208/18723 | 3.24e-03 | 1.34e-02 | 115 |
| GO:007084119 | Esophagus | ESCC | inclusion body assembly | 18/8552 | 24/18723 | 3.43e-03 | 1.41e-02 | 18 |
| GO:000929911 | Esophagus | ESCC | mRNA transcription | 13/8552 | 16/18723 | 4.05e-03 | 1.62e-02 | 13 |
| GO:000276311 | Esophagus | ESCC | positive regulation of myeloid leukocyte differentiation | 37/8552 | 58/18723 | 4.12e-03 | 1.64e-02 | 37 |
| GO:007127615 | Esophagus | ESCC | cellular response to cadmium ion | 27/8552 | 40/18723 | 4.39e-03 | 1.73e-02 | 27 |
| GO:000276115 | Esophagus | ESCC | regulation of myeloid leukocyte differentiation | 69/8552 | 120/18723 | 6.00e-03 | 2.21e-02 | 69 |
| GO:01201624 | Esophagus | ESCC | positive regulation of cold-induced thermogenesis | 57/8552 | 97/18723 | 6.43e-03 | 2.35e-02 | 57 |
| GO:007122215 | Esophagus | ESCC | cellular response to lipopolysaccharide | 113/8552 | 209/18723 | 8.79e-03 | 3.10e-02 | 113 |
| GO:007121617 | Esophagus | ESCC | cellular response to biotic stimulus | 131/8552 | 246/18723 | 9.85e-03 | 3.39e-02 | 131 |
| GO:190003412 | Esophagus | ESCC | regulation of cellular response to heat | 13/8552 | 17/18723 | 1.00e-02 | 3.42e-02 | 13 |
| GO:01061066 | Esophagus | ESCC | cold-induced thermogenesis | 80/8552 | 144/18723 | 1.07e-02 | 3.65e-02 | 80 |
| GO:01201616 | Esophagus | ESCC | regulation of cold-induced thermogenesis | 80/8552 | 144/18723 | 1.07e-02 | 3.65e-02 | 80 |
| GO:004668817 | Esophagus | ESCC | response to copper ion | 27/8552 | 42/18723 | 1.16e-02 | 3.90e-02 | 27 |
| GO:000989612 | Liver | Cirrhotic | positive regulation of catabolic process | 215/4634 | 492/18723 | 1.13e-20 | 3.56e-18 | 215 |
| GO:190136111 | Liver | Cirrhotic | organic cyclic compound catabolic process | 213/4634 | 495/18723 | 1.58e-19 | 3.67e-17 | 213 |
| GO:003133112 | Liver | Cirrhotic | positive regulation of cellular catabolic process | 190/4634 | 427/18723 | 1.94e-19 | 4.18e-17 | 190 |
| GO:000697912 | Liver | Cirrhotic | response to oxidative stress | 196/4634 | 446/18723 | 2.80e-19 | 5.86e-17 | 196 |
| GO:001943911 | Liver | Cirrhotic | aromatic compound catabolic process | 202/4634 | 467/18723 | 6.93e-19 | 1.28e-16 | 202 |
| GO:190331111 | Liver | Cirrhotic | regulation of mRNA metabolic process | 140/4634 | 288/18723 | 1.07e-18 | 1.91e-16 | 140 |
| GO:00359667 | Liver | Cirrhotic | response to topologically incorrect protein | 91/4634 | 159/18723 | 2.07e-18 | 3.60e-16 | 91 |
| Page: 1 2 3 4 5 6 7 8 9 10 11 12 13 14 15 16 17 18 19 20 21 22 23 24 25 26 27 28 29 30 31 32 33 34 35 36 37 38 39 40 41 42 43 44 45 46 47 48 49 50 51 |
| Pathway ID | Tissue | Disease Stage | Description | Gene Ratio | Bg Ratio | pvalue | p.adjust | qvalue | Count |
| hsa0513427 | Esophagus | HGIN | Legionellosis | 18/1383 | 57/8465 | 3.20e-03 | 2.54e-02 | 2.02e-02 | 18 |
| hsa05134112 | Esophagus | HGIN | Legionellosis | 18/1383 | 57/8465 | 3.20e-03 | 2.54e-02 | 2.02e-02 | 18 |
| hsa0513428 | Esophagus | ESCC | Legionellosis | 42/4205 | 57/8465 | 1.83e-04 | 6.90e-04 | 3.53e-04 | 42 |
| hsa0513436 | Esophagus | ESCC | Legionellosis | 42/4205 | 57/8465 | 1.83e-04 | 6.90e-04 | 3.53e-04 | 42 |
| hsa0513412 | Liver | Cirrhotic | Legionellosis | 28/2530 | 57/8465 | 1.71e-03 | 8.01e-03 | 4.94e-03 | 28 |
| hsa0513413 | Liver | Cirrhotic | Legionellosis | 28/2530 | 57/8465 | 1.71e-03 | 8.01e-03 | 4.94e-03 | 28 |
| hsa0513425 | Oral cavity | OSCC | Legionellosis | 42/3704 | 57/8465 | 4.18e-06 | 2.15e-05 | 1.10e-05 | 42 |
| hsa05134111 | Oral cavity | OSCC | Legionellosis | 42/3704 | 57/8465 | 4.18e-06 | 2.15e-05 | 1.10e-05 | 42 |
| hsa0513426 | Oral cavity | LP | Legionellosis | 33/2418 | 57/8465 | 3.29e-06 | 3.23e-05 | 2.08e-05 | 33 |
| hsa0513435 | Oral cavity | LP | Legionellosis | 33/2418 | 57/8465 | 3.29e-06 | 3.23e-05 | 2.08e-05 | 33 |
| Page: 1 |
Top |
Cell-cell communication analysis |
| Identification of potential cell-cell interactions between two cell types and their ligand-receptor pairs for different disease states |
| Ligand | Receptor | LRpair | Pathway | Tissue | Disease Stage |
| Page: 1 |
Top |
Single-cell gene regulatory network inference analysis |
| Find out the significant the regulons (TFs) and the target genes of each regulon across cell types for different disease states |
| TF | Cell Type | Tissue | Disease Stage | Target Gene | RSS | Regulon Activity |
| HSF1 | PERI | Lung | ADJ | CCDC36,TTPAL,ARHGEF37, etc. | 5.45e-03 |  |
| HSF1 | ICAF | Lung | ADJ | CCDC36,TTPAL,ARHGEF37, etc. | 0.00e+00 | |
| HSF1 | ADIPO | Lung | Healthy | CCDC36,TTPAL,ARHGEF37, etc. | 4.40e-03 |  |
| HSF1 | MYOFIB | Lung | Healthy | CCDC36,TTPAL,ARHGEF37, etc. | 2.22e-16 | |
| HSF1 | GRA | Oral cavity | NEOLP | GRINA,SNX3,CD164, etc. | 1.18e-02 |  |
| HSF1 | NUER | Prostate | ADJ | IP6K2,TBX19,WWP2, etc. | 4.00e-02 |  |
| HSF1 | BAS | Prostate | ADJ | IP6K2,TBX19,WWP2, etc. | 2.34e-02 | |
| HSF1 | BAS | Prostate | BPH | IP6K2,TBX19,WWP2, etc. | 2.26e-01 |  |
| HSF1 | BAS | Prostate | Tumor | IP6K2,TBX19,WWP2, etc. | 4.87e-02 |  |
| HSF1 | NKT | Prostate | BPH | TCAIM,KRT17,CLTB, etc. | 1.32e-01 | |
| ∗The dot plots of a searched regulon are shown for all cell subpopulations in each disease state of each tissue based on the regulon specific score inferred using pySCENIC and by calculating the average expression. |
| Page: 1 2 3 |
Top |
Somatic mutation of malignant transformation related genes |
| Annotation of somatic variants for genes involved in malignant transformation |
| Hugo Symbol | Variant Class | Variant Classification | dbSNP RS | HGVSc | HGVSp | HGVSp Short | SWISSPROT | BIOTYPE | SIFT | PolyPhen | Tumor Sample Barcode | Tissue | Histology | Sex | Age | Stage | Therapy Types | Drugs | Outcome |
| HSF1 | SNV | Missense_Mutation | c.1477N>A | p.Glu493Lys | p.E493K | Q00613 | protein_coding | deleterious(0) | probably_damaging(1) | TCGA-A2-A0SY-01 | Breast | breast invasive carcinoma | Female | <65 | III/IV | Hormone Therapy | arimidex | SD | |
| HSF1 | SNV | Missense_Mutation | rs781942523 | c.526N>T | p.Arg176Trp | p.R176W | Q00613 | protein_coding | deleterious(0.01) | benign(0.063) | TCGA-AN-A046-01 | Breast | breast invasive carcinoma | Female | >=65 | I/II | Unknown | Unknown | SD |
| HSF1 | SNV | Missense_Mutation | rs781942523 | c.526C>T | p.Arg176Trp | p.R176W | Q00613 | protein_coding | deleterious(0.01) | benign(0.063) | TCGA-C8-A3M7-01 | Breast | breast invasive carcinoma | Female | <65 | III/IV | Unknown | Unknown | PD |
| HSF1 | SNV | Missense_Mutation | c.606N>G | p.Ile202Met | p.I202M | Q00613 | protein_coding | deleterious(0.02) | probably_damaging(0.925) | TCGA-E2-A156-01 | Breast | breast invasive carcinoma | Female | <65 | I/II | Hormone Therapy | arimidex | SD | |
| HSF1 | SNV | Missense_Mutation | c.141C>G | p.Phe47Leu | p.F47L | Q00613 | protein_coding | tolerated(0.14) | benign(0.053) | TCGA-E2-A1B6-01 | Breast | breast invasive carcinoma | Female | <65 | I/II | Unspecific | Adriamycin | SD | |
| HSF1 | SNV | Missense_Mutation | rs377258216 | c.1051N>A | p.Ala351Thr | p.A351T | Q00613 | protein_coding | tolerated(0.49) | benign(0.001) | TCGA-EX-A8YF-01 | Cervix | cervical & endocervical cancer | Female | <65 | I/II | Unknown | Unknown | PD |
| HSF1 | SNV | Missense_Mutation | c.582N>G | p.Ile194Met | p.I194M | Q00613 | protein_coding | deleterious(0.02) | possibly_damaging(0.779) | TCGA-JW-A5VL-01 | Cervix | cervical & endocervical cancer | Female | <65 | I/II | Unknown | Unknown | SD | |
| HSF1 | SNV | Missense_Mutation | rs782078876 | c.1409C>T | p.Ala470Val | p.A470V | Q00613 | protein_coding | deleterious(0.02) | probably_damaging(0.962) | TCGA-A6-5661-01 | Colorectum | colon adenocarcinoma | Female | >=65 | I/II | Unknown | Unknown | SD |
| HSF1 | SNV | Missense_Mutation | c.1259N>T | p.Pro420Leu | p.P420L | Q00613 | protein_coding | deleterious(0.03) | possibly_damaging(0.851) | TCGA-CM-6165-01 | Colorectum | colon adenocarcinoma | Male | >=65 | I/II | Unknown | Unknown | SD | |
| HSF1 | SNV | Missense_Mutation | c.257N>G | p.Gln86Arg | p.Q86R | Q00613 | protein_coding | deleterious(0.03) | probably_damaging(0.999) | TCGA-DM-A1HB-01 | Colorectum | colon adenocarcinoma | Male | >=65 | III/IV | Unknown | Unknown | SD |
| Page: 1 2 3 4 |
Top |
Related drugs of malignant transformation related genes |
| Identification of chemicals and drugs interact with genes involved in malignant transfromation |
| (DGIdb 4.0) |
| Entrez ID | Symbol | Category | Interaction Types | Drug Claim Name | Drug Name | PMIDs |
| 3297 | HSF1 | TRANSCRIPTION FACTOR, DNA REPAIR | QUERCETIN | QUERCETIN | 19296652 | |
| 3297 | HSF1 | TRANSCRIPTION FACTOR, DNA REPAIR | CYCLOHEXIMIDE | CYCLOHEXIMIDE | ||
| 3297 | HSF1 | TRANSCRIPTION FACTOR, DNA REPAIR | BIMOCLOMOL | BIMOCLOMOL | ||
| 3297 | HSF1 | TRANSCRIPTION FACTOR, DNA REPAIR | HSP70 | 9499401,9822662 |
| Page: 1 |

Copyright 2023-Present -The University of Texas Health Science Center at Houston |