
|
|||||
|
 | |
| |
| |
| |
| |
| |
|
Gene: HSD17B12 |
Gene summary for HSD17B12 |
| Gene information | Species | Human | Gene symbol | HSD17B12 | Gene ID | 51144 |
| Gene name | hydroxysteroid 17-beta dehydrogenase 12 | |
| Gene Alias | KAR | |
| Cytomap | 11p11.2 | |
| Gene Type | protein-coding | GO ID | GO:0006082 | UniProtAcc | Q53GQ0 |
Top |
Malignant transformation analysis |
| Identification of the aberrant gene expression in precancerous and cancerous lesions by comparing the gene expression of stem-like cells in diseased tissues with normal stem cells |
| Entrez ID | Symbol | Replicates | Species | Organ | Tissue | Adj P-value | Log2FC | Malignancy |
| 51144 | HSD17B12 | CA_HPV_1 | Human | Cervix | CC | 8.79e-05 | -2.47e-01 | 0.0264 |
| 51144 | HSD17B12 | CCI_1 | Human | Cervix | CC | 4.46e-04 | -5.02e-01 | 0.528 |
| 51144 | HSD17B12 | CCI_3 | Human | Cervix | CC | 5.56e-03 | -4.46e-01 | 0.516 |
| 51144 | HSD17B12 | CCII_1 | Human | Cervix | CC | 7.66e-13 | -5.23e-01 | 0.3249 |
| 51144 | HSD17B12 | sample1 | Human | Cervix | CC | 1.04e-02 | -4.21e-01 | 0.0959 |
| 51144 | HSD17B12 | H2 | Human | Cervix | HSIL_HPV | 2.00e-02 | -2.34e-01 | 0.0632 |
| 51144 | HSD17B12 | T1 | Human | Cervix | CC | 2.80e-09 | -4.29e-01 | 0.0918 |
| 51144 | HSD17B12 | HTA11_3410_2000001011 | Human | Colorectum | AD | 2.46e-44 | -1.00e+00 | 0.0155 |
| 51144 | HSD17B12 | HTA11_2487_2000001011 | Human | Colorectum | SER | 1.54e-24 | -9.35e-01 | -0.1808 |
| 51144 | HSD17B12 | HTA11_2951_2000001011 | Human | Colorectum | AD | 2.70e-03 | -7.99e-01 | 0.0216 |
| 51144 | HSD17B12 | HTA11_1938_2000001011 | Human | Colorectum | AD | 5.19e-12 | -7.97e-01 | -0.0811 |
| 51144 | HSD17B12 | HTA11_78_2000001011 | Human | Colorectum | AD | 8.12e-15 | -7.05e-01 | -0.1088 |
| 51144 | HSD17B12 | HTA11_347_2000001011 | Human | Colorectum | AD | 9.95e-15 | -5.57e-01 | -0.1954 |
| 51144 | HSD17B12 | HTA11_2112_2000001011 | Human | Colorectum | SER | 1.37e-04 | -8.72e-01 | -0.2196 |
| 51144 | HSD17B12 | HTA11_3361_2000001011 | Human | Colorectum | AD | 3.32e-20 | -9.64e-01 | -0.1207 |
| 51144 | HSD17B12 | HTA11_83_2000001011 | Human | Colorectum | SER | 3.58e-13 | -8.33e-01 | -0.1526 |
| 51144 | HSD17B12 | HTA11_696_2000001011 | Human | Colorectum | AD | 6.51e-43 | -8.88e-01 | -0.1464 |
| 51144 | HSD17B12 | HTA11_866_2000001011 | Human | Colorectum | AD | 2.64e-44 | -9.07e-01 | -0.1001 |
| 51144 | HSD17B12 | HTA11_1391_2000001011 | Human | Colorectum | AD | 2.20e-28 | -8.56e-01 | -0.059 |
| 51144 | HSD17B12 | HTA11_2992_2000001011 | Human | Colorectum | SER | 3.14e-04 | -6.95e-01 | -0.1706 |
| Page: 1 2 3 4 5 6 7 8 9 10 |
| Tissue | Expression Dynamics | Abbreviation |
| Cervix |  | CC: Cervix cancer |
| HSIL_HPV: HPV-infected high-grade squamous intraepithelial lesions | ||
| N_HPV: HPV-infected normal cervix | ||
| Colorectum (GSE201348) |  | FAP: Familial adenomatous polyposis |
| CRC: Colorectal cancer | ||
| Colorectum (HTA11) |  | AD: Adenomas |
| SER: Sessile serrated lesions | ||
| MSI-H: Microsatellite-high colorectal cancer | ||
| MSS: Microsatellite stable colorectal cancer | ||
| Esophagus | 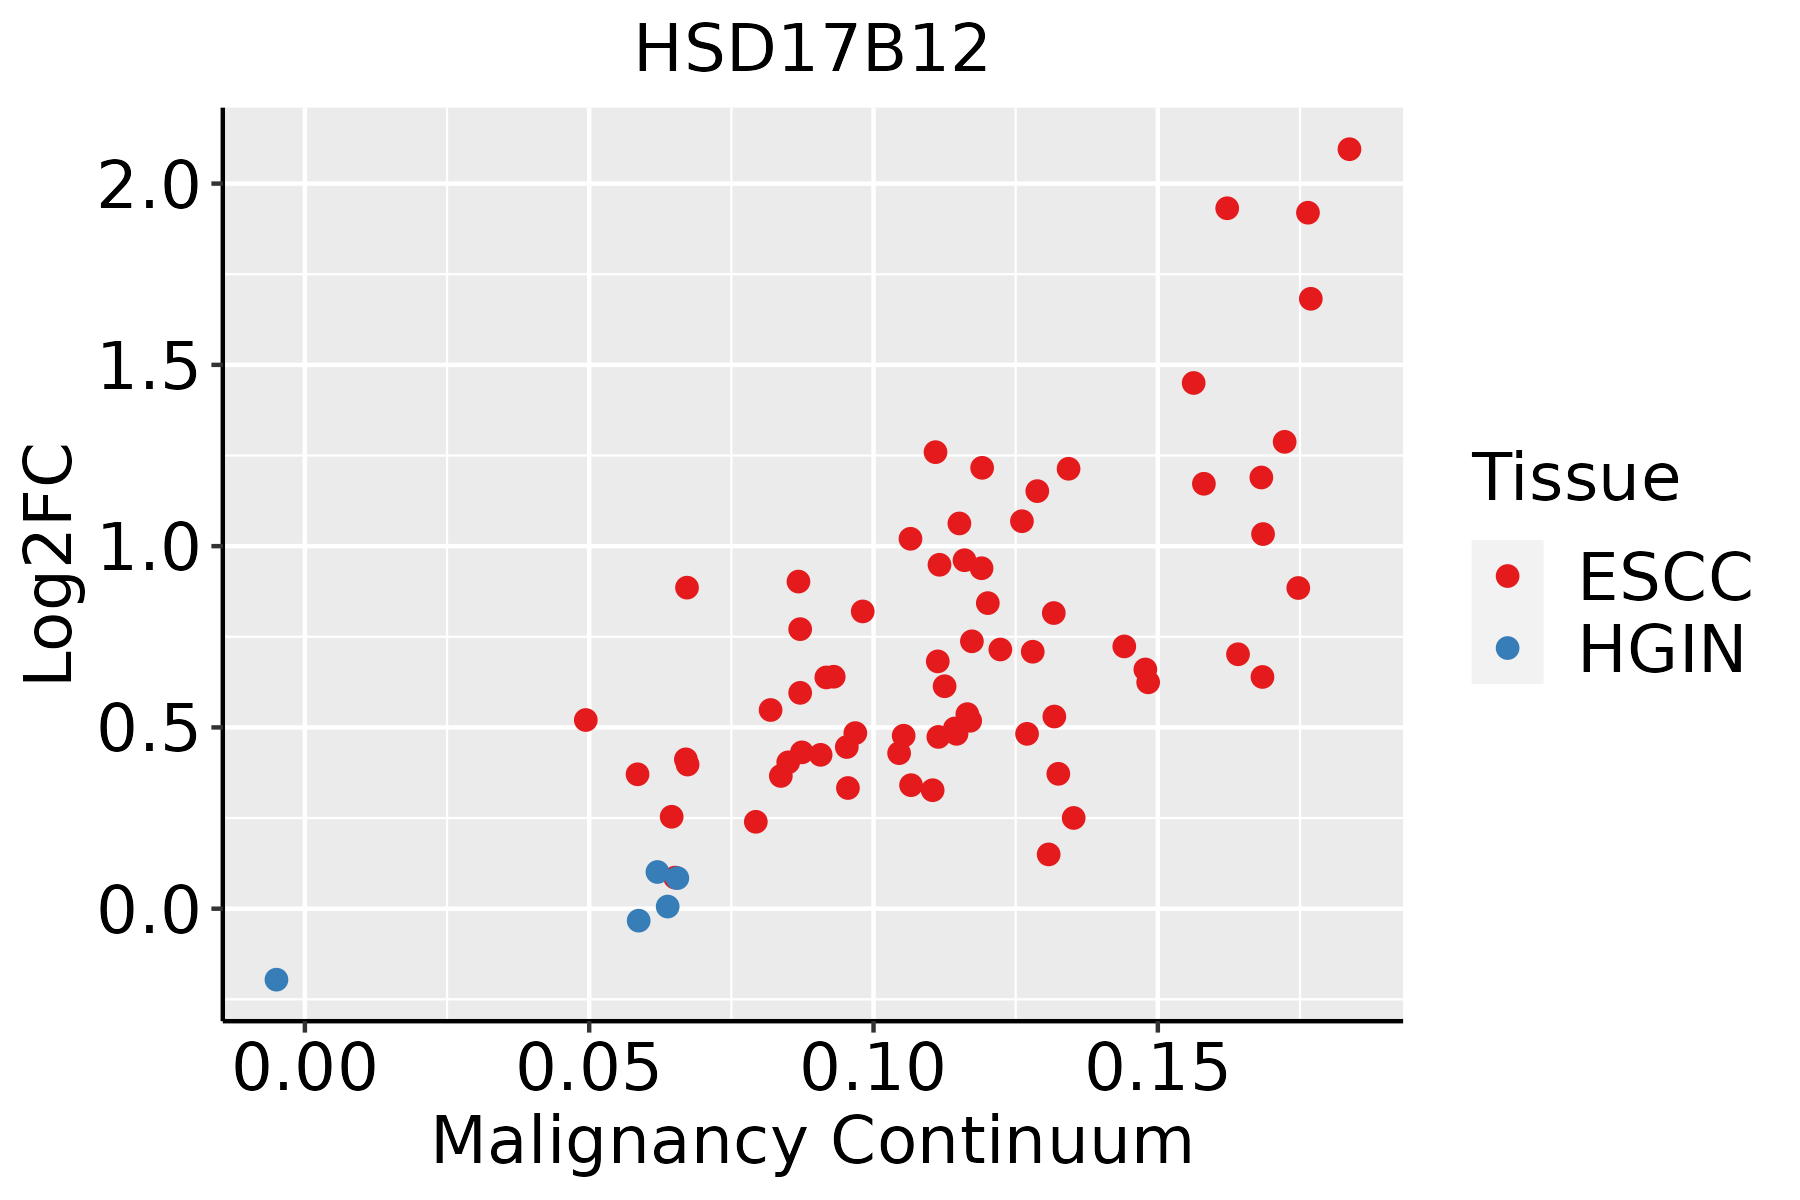 | ESCC: Esophageal squamous cell carcinoma |
| HGIN: High-grade intraepithelial neoplasias | ||
| LGIN: Low-grade intraepithelial neoplasias | ||
| Liver | 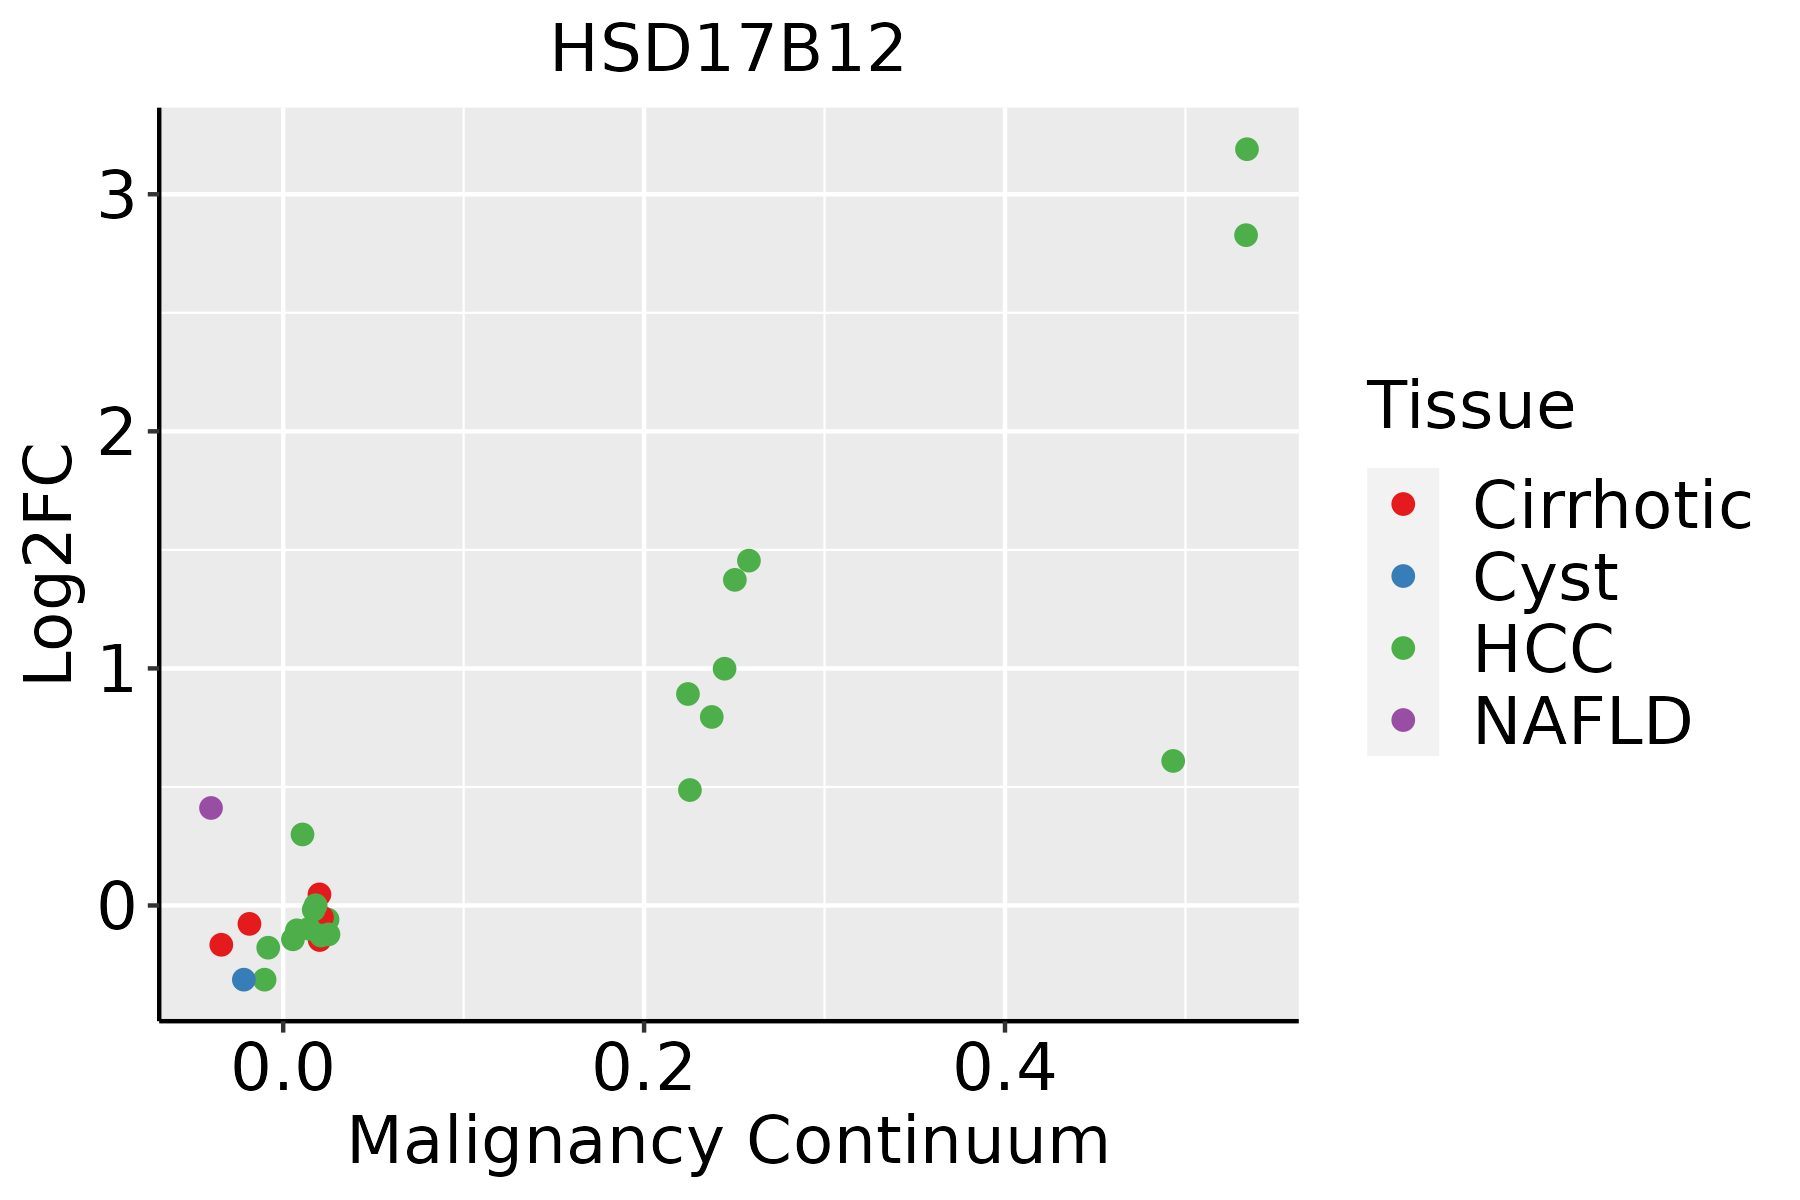 | HCC: Hepatocellular carcinoma |
| NAFLD: Non-alcoholic fatty liver disease | ||
| Oral Cavity | 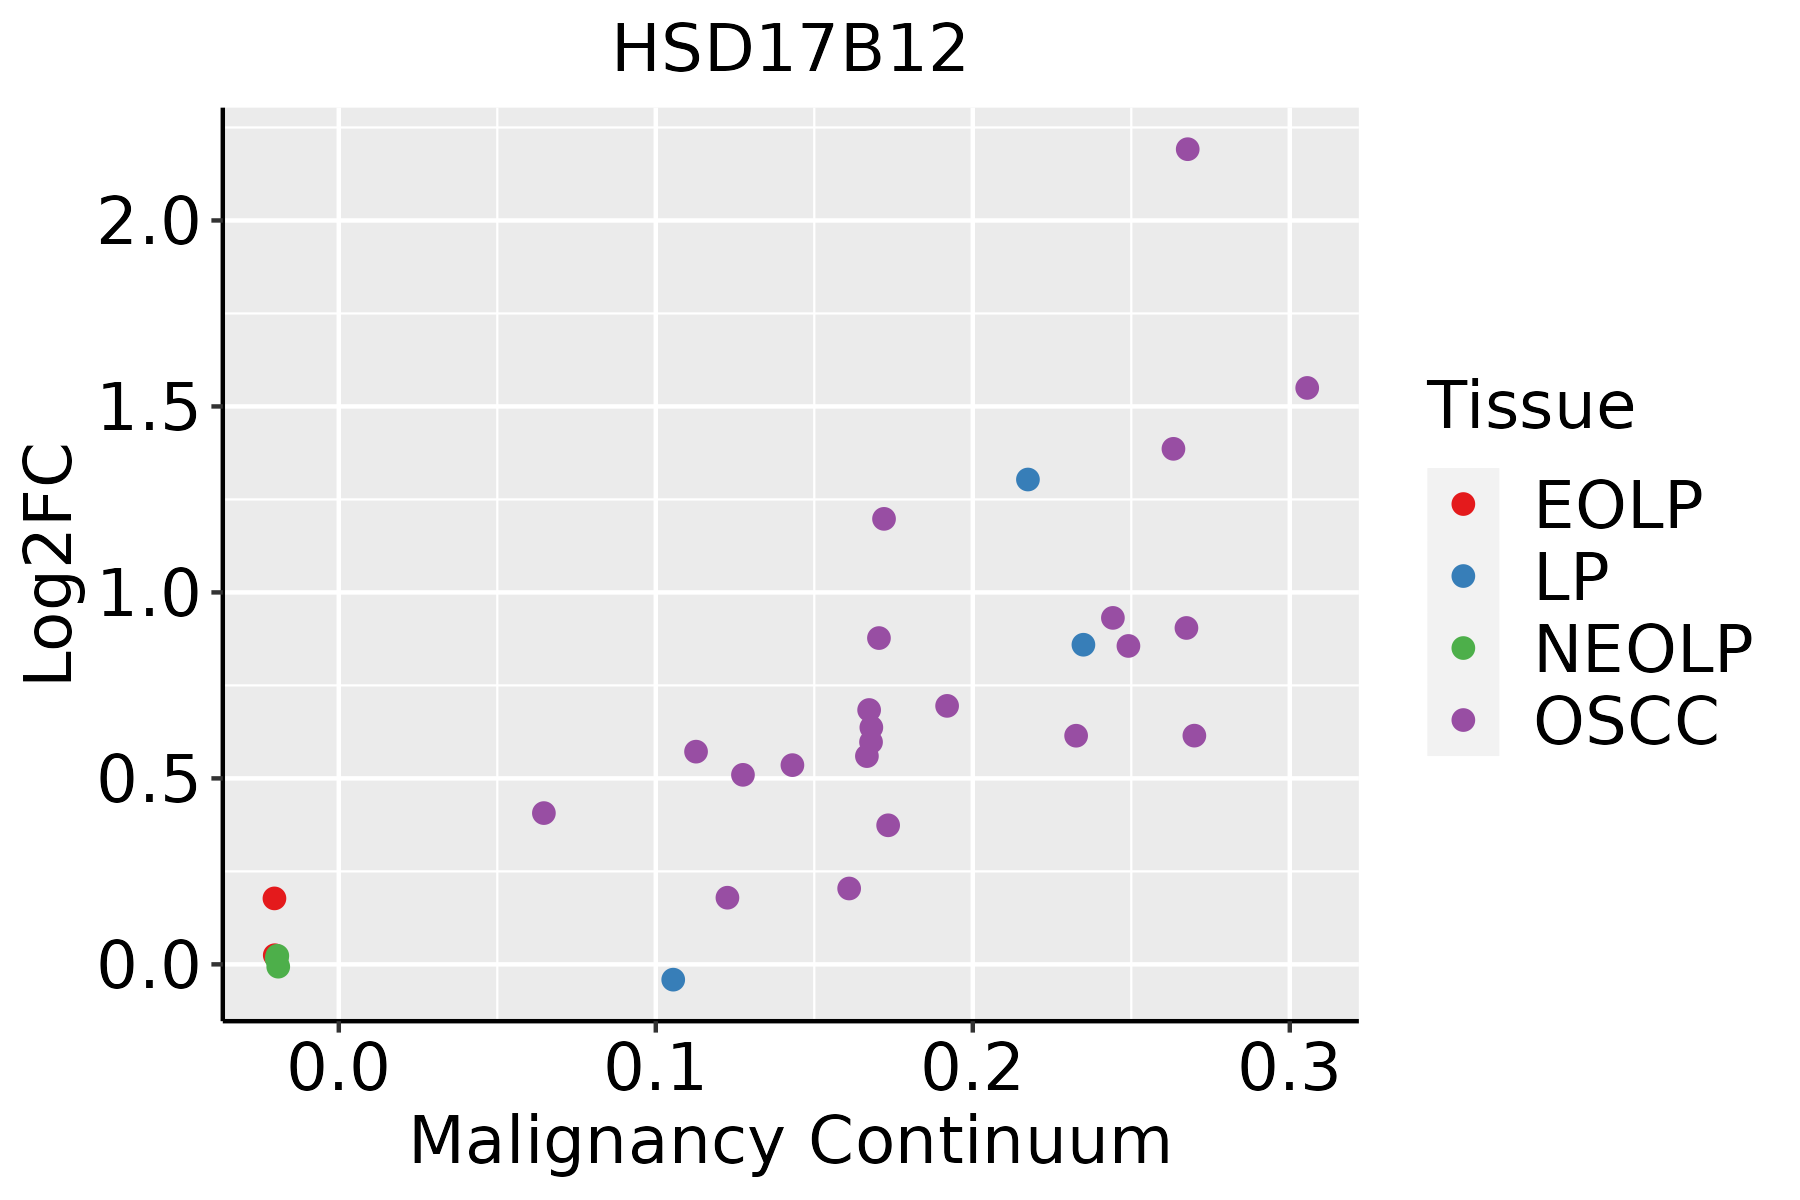 | EOLP: Erosive Oral lichen planus |
| LP: leukoplakia | ||
| NEOLP: Non-erosive oral lichen planus | ||
| OSCC: Oral squamous cell carcinoma | ||
| Prostate |  | BPH: Benign Prostatic Hyperplasia |
| Skin | 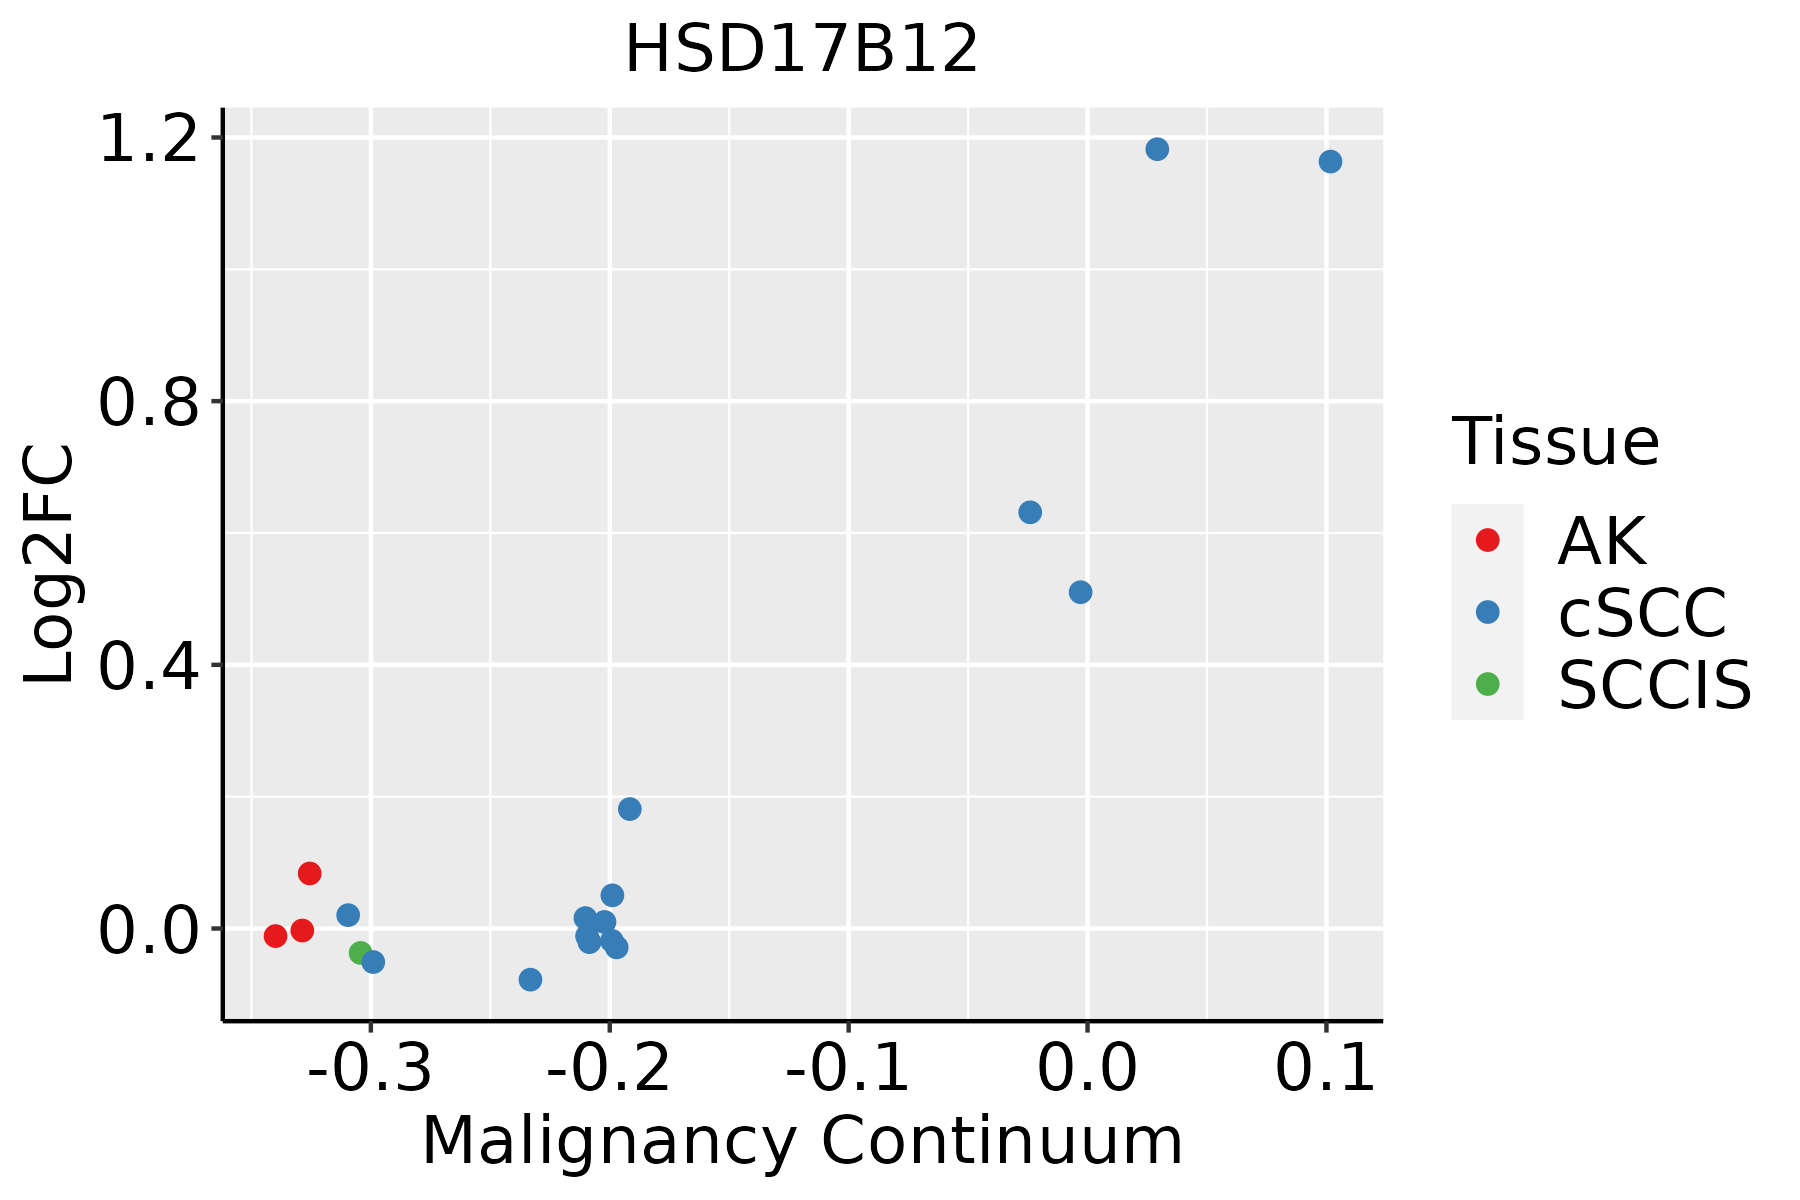 | AK: Actinic keratosis |
| cSCC: Cutaneous squamous cell carcinoma | ||
| SCCIS:squamous cell carcinoma in situ | ||
| Thyroid | 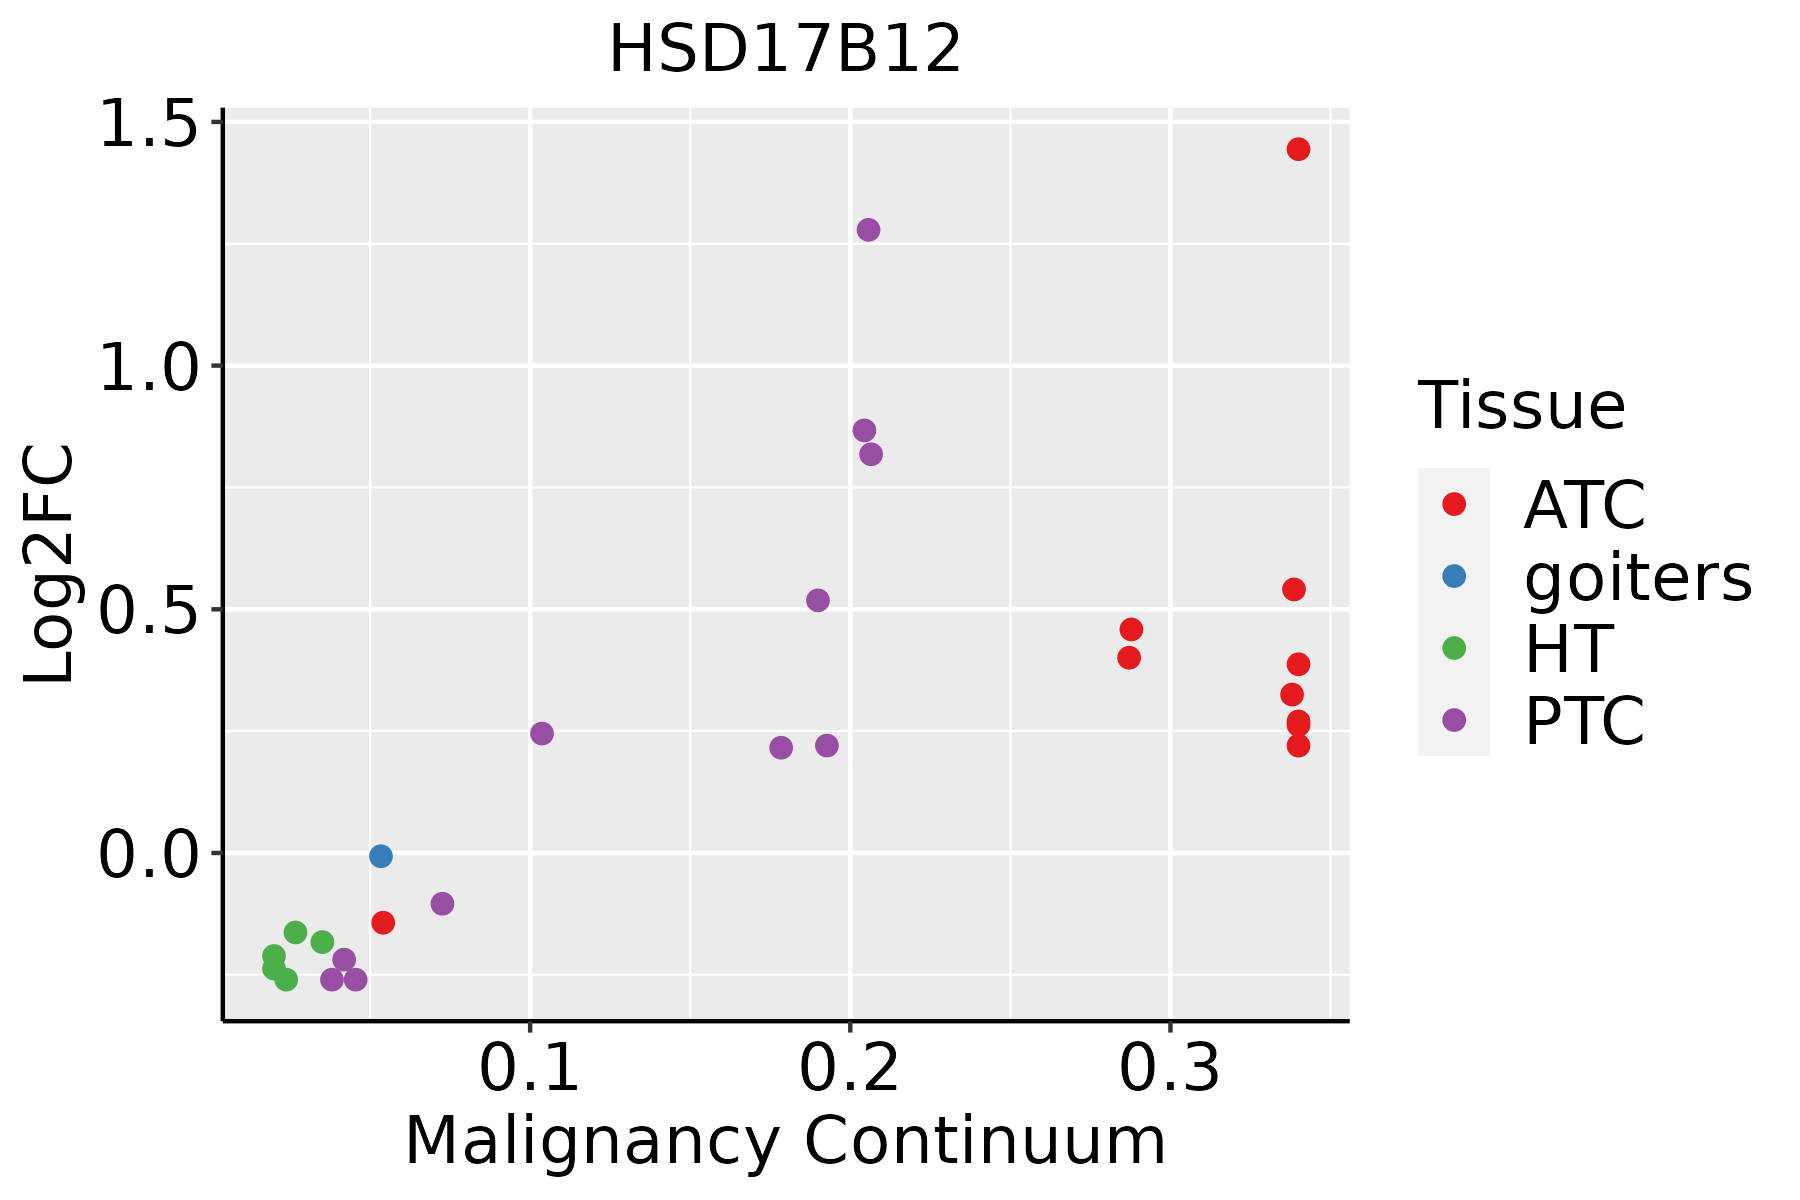 | ATC: Anaplastic thyroid cancer |
| HT: Hashimoto's thyroiditis | ||
| PTC: Papillary thyroid cancer |
| ∗log2FC in expression of this searched gene in stem-like cells from each diseased tissue sample relative to stem-like cells in normal samples in each tissue plotted against the malignancy continuum. Samples are colored based on if they are from different disease stage. |
Top |
Malignant transformation related pathway analysis |
| Find out the enriched GO biological processes and KEGG pathways involved in transition from healthy to precancer to cancer |
| Tissue | Disease Stage | Enriched GO biological Processes |
| Colorectum | AD |  |
| Colorectum | SER |  |
| Colorectum | MSS |  |
| Colorectum | MSI-H |  |
| Colorectum | FAP |  |
| ∗Top 15 enriched GO BP terms are showed in the bar plot of each disease state in each tissue. Each row represents a significant GO biological process which is colored according to the -log10(p.adjust). |
| Page: 1 2 3 4 5 6 7 8 9 |
| GO ID | Tissue | Disease Stage | Description | Gene Ratio | Bg Ratio | pvalue | p.adjust | Count |
| GO:001081112 | Liver | Cirrhotic | positive regulation of cell-substrate adhesion | 53/4634 | 123/18723 | 6.21e-06 | 9.88e-05 | 53 |
| GO:00442721 | Liver | Cirrhotic | sulfur compound biosynthetic process | 58/4634 | 148/18723 | 6.93e-05 | 7.83e-04 | 58 |
| GO:00463905 | Liver | Cirrhotic | ribose phosphate biosynthetic process | 71/4634 | 190/18723 | 7.09e-05 | 7.98e-04 | 71 |
| GO:00092605 | Liver | Cirrhotic | ribonucleotide biosynthetic process | 68/4634 | 182/18723 | 1.00e-04 | 1.05e-03 | 68 |
| GO:00091654 | Liver | Cirrhotic | nucleotide biosynthetic process | 89/4634 | 254/18723 | 1.45e-04 | 1.40e-03 | 89 |
| GO:19012934 | Liver | Cirrhotic | nucleoside phosphate biosynthetic process | 89/4634 | 256/18723 | 1.97e-04 | 1.82e-03 | 89 |
| GO:00457857 | Liver | Cirrhotic | positive regulation of cell adhesion | 141/4634 | 437/18723 | 2.05e-04 | 1.89e-03 | 141 |
| GO:00338651 | Liver | Cirrhotic | nucleoside bisphosphate metabolic process | 50/4634 | 128/18723 | 2.32e-04 | 2.11e-03 | 50 |
| GO:00338751 | Liver | Cirrhotic | ribonucleoside bisphosphate metabolic process | 50/4634 | 128/18723 | 2.32e-04 | 2.11e-03 | 50 |
| GO:00340321 | Liver | Cirrhotic | purine nucleoside bisphosphate metabolic process | 50/4634 | 128/18723 | 2.32e-04 | 2.11e-03 | 50 |
| GO:00091526 | Liver | Cirrhotic | purine ribonucleotide biosynthetic process | 62/4634 | 169/18723 | 3.52e-04 | 3.00e-03 | 62 |
| GO:00066371 | Liver | Cirrhotic | acyl-CoA metabolic process | 38/4634 | 96/18723 | 9.23e-04 | 6.57e-03 | 38 |
| GO:00353831 | Liver | Cirrhotic | thioester metabolic process | 38/4634 | 96/18723 | 9.23e-04 | 6.57e-03 | 38 |
| GO:00725225 | Liver | Cirrhotic | purine-containing compound biosynthetic process | 69/4634 | 200/18723 | 1.22e-03 | 8.24e-03 | 69 |
| GO:00082101 | Liver | Cirrhotic | estrogen metabolic process | 18/4634 | 38/18723 | 2.05e-03 | 1.27e-02 | 18 |
| GO:004244511 | Liver | Cirrhotic | hormone metabolic process | 73/4634 | 218/18723 | 2.22e-03 | 1.36e-02 | 73 |
| GO:00061645 | Liver | Cirrhotic | purine nucleotide biosynthetic process | 65/4634 | 191/18723 | 2.42e-03 | 1.46e-02 | 65 |
| GO:0033866 | Liver | Cirrhotic | nucleoside bisphosphate biosynthetic process | 25/4634 | 60/18723 | 2.92e-03 | 1.67e-02 | 25 |
| GO:0034030 | Liver | Cirrhotic | ribonucleoside bisphosphate biosynthetic process | 25/4634 | 60/18723 | 2.92e-03 | 1.67e-02 | 25 |
| GO:0034033 | Liver | Cirrhotic | purine nucleoside bisphosphate biosynthetic process | 25/4634 | 60/18723 | 2.92e-03 | 1.67e-02 | 25 |
| Page: 1 2 3 4 5 6 7 8 9 10 11 12 13 14 15 16 17 18 19 20 21 22 |
| Pathway ID | Tissue | Disease Stage | Description | Gene Ratio | Bg Ratio | pvalue | p.adjust | qvalue | Count |
| hsa00062 | Colorectum | SER | Fatty acid elongation | 11/1580 | 27/8465 | 6.38e-03 | 3.68e-02 | 2.67e-02 | 11 |
| hsa000621 | Colorectum | SER | Fatty acid elongation | 11/1580 | 27/8465 | 6.38e-03 | 3.68e-02 | 2.67e-02 | 11 |
| hsa01212 | Colorectum | CRC | Fatty acid metabolism | 14/1091 | 57/8465 | 1.17e-02 | 4.99e-02 | 3.38e-02 | 14 |
| hsa012121 | Colorectum | CRC | Fatty acid metabolism | 14/1091 | 57/8465 | 1.17e-02 | 4.99e-02 | 3.38e-02 | 14 |
| hsa012129 | Esophagus | ESCC | Fatty acid metabolism | 41/4205 | 57/8465 | 5.13e-04 | 1.75e-03 | 8.98e-04 | 41 |
| hsa0121214 | Esophagus | ESCC | Fatty acid metabolism | 41/4205 | 57/8465 | 5.13e-04 | 1.75e-03 | 8.98e-04 | 41 |
| hsa012126 | Liver | NAFLD | Fatty acid metabolism | 17/1043 | 57/8465 | 3.43e-04 | 5.93e-03 | 4.78e-03 | 17 |
| hsa0121211 | Liver | NAFLD | Fatty acid metabolism | 17/1043 | 57/8465 | 3.43e-04 | 5.93e-03 | 4.78e-03 | 17 |
| hsa012122 | Liver | Cirrhotic | Fatty acid metabolism | 32/2530 | 57/8465 | 3.12e-05 | 2.47e-04 | 1.52e-04 | 32 |
| hsa01040 | Liver | Cirrhotic | Biosynthesis of unsaturated fatty acids | 14/2530 | 27/8465 | 1.36e-02 | 4.25e-02 | 2.62e-02 | 14 |
| hsa012123 | Liver | Cirrhotic | Fatty acid metabolism | 32/2530 | 57/8465 | 3.12e-05 | 2.47e-04 | 1.52e-04 | 32 |
| hsa010401 | Liver | Cirrhotic | Biosynthesis of unsaturated fatty acids | 14/2530 | 27/8465 | 1.36e-02 | 4.25e-02 | 2.62e-02 | 14 |
| hsa012124 | Liver | HCC | Fatty acid metabolism | 45/4020 | 57/8465 | 1.05e-06 | 1.10e-05 | 6.09e-06 | 45 |
| hsa000622 | Liver | HCC | Fatty acid elongation | 20/4020 | 27/8465 | 4.58e-03 | 1.36e-02 | 7.55e-03 | 20 |
| hsa010402 | Liver | HCC | Biosynthesis of unsaturated fatty acids | 19/4020 | 27/8465 | 1.37e-02 | 3.33e-02 | 1.85e-02 | 19 |
| hsa012125 | Liver | HCC | Fatty acid metabolism | 45/4020 | 57/8465 | 1.05e-06 | 1.10e-05 | 6.09e-06 | 45 |
| hsa0006211 | Liver | HCC | Fatty acid elongation | 20/4020 | 27/8465 | 4.58e-03 | 1.36e-02 | 7.55e-03 | 20 |
| hsa010403 | Liver | HCC | Biosynthesis of unsaturated fatty acids | 19/4020 | 27/8465 | 1.37e-02 | 3.33e-02 | 1.85e-02 | 19 |
| hsa012128 | Oral cavity | OSCC | Fatty acid metabolism | 35/3704 | 57/8465 | 5.37e-03 | 1.29e-02 | 6.55e-03 | 35 |
| hsa0121213 | Oral cavity | OSCC | Fatty acid metabolism | 35/3704 | 57/8465 | 5.37e-03 | 1.29e-02 | 6.55e-03 | 35 |
| Page: 1 2 |
Top |
Cell-cell communication analysis |
| Identification of potential cell-cell interactions between two cell types and their ligand-receptor pairs for different disease states |
| Ligand | Receptor | LRpair | Pathway | Tissue | Disease Stage |
| Page: 1 |
Top |
Single-cell gene regulatory network inference analysis |
| Find out the significant the regulons (TFs) and the target genes of each regulon across cell types for different disease states |
| TF | Cell Type | Tissue | Disease Stage | Target Gene | RSS | Regulon Activity |
| ∗The dot plots of a searched regulon are shown for all cell subpopulations in each disease state of each tissue based on the regulon specific score inferred using pySCENIC and by calculating the average expression. |
| Page: 1 |
Top |
Somatic mutation of malignant transformation related genes |
| Annotation of somatic variants for genes involved in malignant transformation |
| Hugo Symbol | Variant Class | Variant Classification | dbSNP RS | HGVSc | HGVSp | HGVSp Short | SWISSPROT | BIOTYPE | SIFT | PolyPhen | Tumor Sample Barcode | Tissue | Histology | Sex | Age | Stage | Therapy Types | Drugs | Outcome |
| HSD17B12 | insertion | In_Frame_Ins | novel | c.127_128insGAAGACAAATTAAAAGATATAGTCTCCTTC | p.Ala43delinsGlyArgGlnIleLysArgTyrSerLeuLeuPro | p.A43delinsGRQIKRYSLLP | Q53GQ0 | protein_coding | TCGA-A2-A0EQ-01 | Breast | breast invasive carcinoma | Female | <65 | I/II | Chemotherapy | adriamycin | SD | ||
| HSD17B12 | SNV | Missense_Mutation | novel | c.271T>G | p.Ser91Ala | p.S91A | Q53GQ0 | protein_coding | tolerated(1) | benign(0.005) | TCGA-EA-A3HU-01 | Cervix | cervical & endocervical cancer | Female | <65 | I/II | Unknown | Unknown | SD |
| HSD17B12 | SNV | Missense_Mutation | novel | c.505A>G | p.Thr169Ala | p.T169A | Q53GQ0 | protein_coding | deleterious(0) | possibly_damaging(0.534) | TCGA-A6-2686-01 | Colorectum | colon adenocarcinoma | Female | >=65 | I/II | Unknown | Unknown | SD |
| HSD17B12 | SNV | Missense_Mutation | rs764576855 | c.22N>A | p.Ala8Thr | p.A8T | Q53GQ0 | protein_coding | tolerated(0.16) | benign(0.009) | TCGA-AZ-6601-01 | Colorectum | colon adenocarcinoma | Male | >=65 | I/II | Unknown | Unknown | PD |
| HSD17B12 | SNV | Missense_Mutation | rs768344325 | c.901N>G | p.Thr301Ala | p.T301A | Q53GQ0 | protein_coding | tolerated(0.46) | benign(0) | TCGA-A5-A0G2-01 | Endometrium | uterine corpus endometrioid carcinoma | Female | <65 | III/IV | Unknown | Unknown | SD |
| HSD17B12 | SNV | Missense_Mutation | novel | c.646N>T | p.Leu216Phe | p.L216F | Q53GQ0 | protein_coding | deleterious(0) | probably_damaging(0.996) | TCGA-A5-A1OF-01 | Endometrium | uterine corpus endometrioid carcinoma | Female | <65 | I/II | Unknown | Unknown | SD |
| HSD17B12 | SNV | Missense_Mutation | novel | c.614N>G | p.Thr205Ser | p.T205S | Q53GQ0 | protein_coding | tolerated(0.52) | benign(0.186) | TCGA-A5-A2K3-01 | Endometrium | uterine corpus endometrioid carcinoma | Female | >=65 | I/II | Chemotherapy | carboplatin | SD |
| HSD17B12 | SNV | Missense_Mutation | rs764792567 | c.755N>T | p.Pro252Leu | p.P252L | Q53GQ0 | protein_coding | deleterious(0) | possibly_damaging(0.855) | TCGA-AP-A056-01 | Endometrium | uterine corpus endometrioid carcinoma | Female | <65 | I/II | Unknown | Unknown | SD |
| HSD17B12 | SNV | Missense_Mutation | rs764792567 | c.755N>T | p.Pro252Leu | p.P252L | Q53GQ0 | protein_coding | deleterious(0) | possibly_damaging(0.855) | TCGA-AX-A05Z-01 | Endometrium | uterine corpus endometrioid carcinoma | Female | <65 | III/IV | Chemotherapy | adriamycin | SD |
| HSD17B12 | SNV | Missense_Mutation | novel | c.475N>C | p.Asn159His | p.N159H | Q53GQ0 | protein_coding | deleterious(0.03) | benign(0.114) | TCGA-AX-A2HC-01 | Endometrium | uterine corpus endometrioid carcinoma | Female | <65 | III/IV | Chemotherapy | paclitaxel | PD |
| Page: 1 2 3 |
Top |
Related drugs of malignant transformation related genes |
| Identification of chemicals and drugs interact with genes involved in malignant transfromation |
| (DGIdb 4.0) |
| Entrez ID | Symbol | Category | Interaction Types | Drug Claim Name | Drug Name | PMIDs |
| Page: 1 |

Copyright 2023-Present -The University of Texas Health Science Center at Houston |