
|
|||||
|
 | |
| |
| |
| |
| |
| |
|
Gene: HNRNPD |
Gene summary for HNRNPD |
| Gene information | Species | Human | Gene symbol | HNRNPD | Gene ID | 3184 |
| Gene name | heterogeneous nuclear ribonucleoprotein D | |
| Gene Alias | AUF1 | |
| Cytomap | 4q21.22 | |
| Gene Type | protein-coding | GO ID | GO:0000723 | UniProtAcc | Q14103 |
Top |
Malignant transformation analysis |
| Identification of the aberrant gene expression in precancerous and cancerous lesions by comparing the gene expression of stem-like cells in diseased tissues with normal stem cells |
| Entrez ID | Symbol | Replicates | Species | Organ | Tissue | Adj P-value | Log2FC | Malignancy |
| 3184 | HNRNPD | HTA11_3410_2000001011 | Human | Colorectum | AD | 2.14e-08 | -3.02e-01 | 0.0155 |
| 3184 | HNRNPD | HTA11_347_2000001011 | Human | Colorectum | AD | 1.61e-04 | 4.65e-01 | -0.1954 |
| 3184 | HNRNPD | HTA11_6801_2000001011 | Human | Colorectum | SER | 1.92e-03 | 7.94e-01 | 0.0171 |
| 3184 | HNRNPD | HTA11_99999970781_79442 | Human | Colorectum | MSS | 5.24e-05 | 5.56e-01 | 0.294 |
| 3184 | HNRNPD | HTA11_99999965062_69753 | Human | Colorectum | MSI-H | 5.75e-07 | 1.11e+00 | 0.3487 |
| 3184 | HNRNPD | A001-C-207 | Human | Colorectum | FAP | 9.77e-03 | -4.71e-03 | 0.1278 |
| 3184 | HNRNPD | A015-C-203 | Human | Colorectum | FAP | 1.47e-33 | -3.58e-01 | -0.1294 |
| 3184 | HNRNPD | A015-C-204 | Human | Colorectum | FAP | 2.08e-07 | -3.21e-01 | -0.0228 |
| 3184 | HNRNPD | A014-C-040 | Human | Colorectum | FAP | 1.81e-06 | -4.96e-01 | -0.1184 |
| 3184 | HNRNPD | A002-C-201 | Human | Colorectum | FAP | 6.86e-17 | -3.51e-01 | 0.0324 |
| 3184 | HNRNPD | A002-C-203 | Human | Colorectum | FAP | 1.33e-05 | -2.20e-01 | 0.2786 |
| 3184 | HNRNPD | A001-C-119 | Human | Colorectum | FAP | 5.71e-05 | -2.05e-01 | -0.1557 |
| 3184 | HNRNPD | A001-C-108 | Human | Colorectum | FAP | 6.57e-16 | -2.46e-02 | -0.0272 |
| 3184 | HNRNPD | A002-C-205 | Human | Colorectum | FAP | 2.35e-22 | -1.28e-01 | -0.1236 |
| 3184 | HNRNPD | A001-C-104 | Human | Colorectum | FAP | 2.70e-03 | 2.69e-02 | 0.0184 |
| 3184 | HNRNPD | A015-C-005 | Human | Colorectum | FAP | 3.46e-02 | -8.34e-02 | -0.0336 |
| 3184 | HNRNPD | A015-C-006 | Human | Colorectum | FAP | 1.53e-17 | -2.17e-01 | -0.0994 |
| 3184 | HNRNPD | A015-C-106 | Human | Colorectum | FAP | 1.11e-19 | -3.13e-01 | -0.0511 |
| 3184 | HNRNPD | A002-C-114 | Human | Colorectum | FAP | 3.20e-20 | -2.67e-01 | -0.1561 |
| 3184 | HNRNPD | A015-C-104 | Human | Colorectum | FAP | 7.55e-35 | -1.35e-01 | -0.1899 |
| Page: 1 2 3 4 5 6 7 8 9 10 11 12 |
| Tissue | Expression Dynamics | Abbreviation |
| Colorectum (GSE201348) |  | FAP: Familial adenomatous polyposis |
| CRC: Colorectal cancer | ||
| Colorectum (HTA11) |  | AD: Adenomas |
| SER: Sessile serrated lesions | ||
| MSI-H: Microsatellite-high colorectal cancer | ||
| MSS: Microsatellite stable colorectal cancer | ||
| Endometrium | 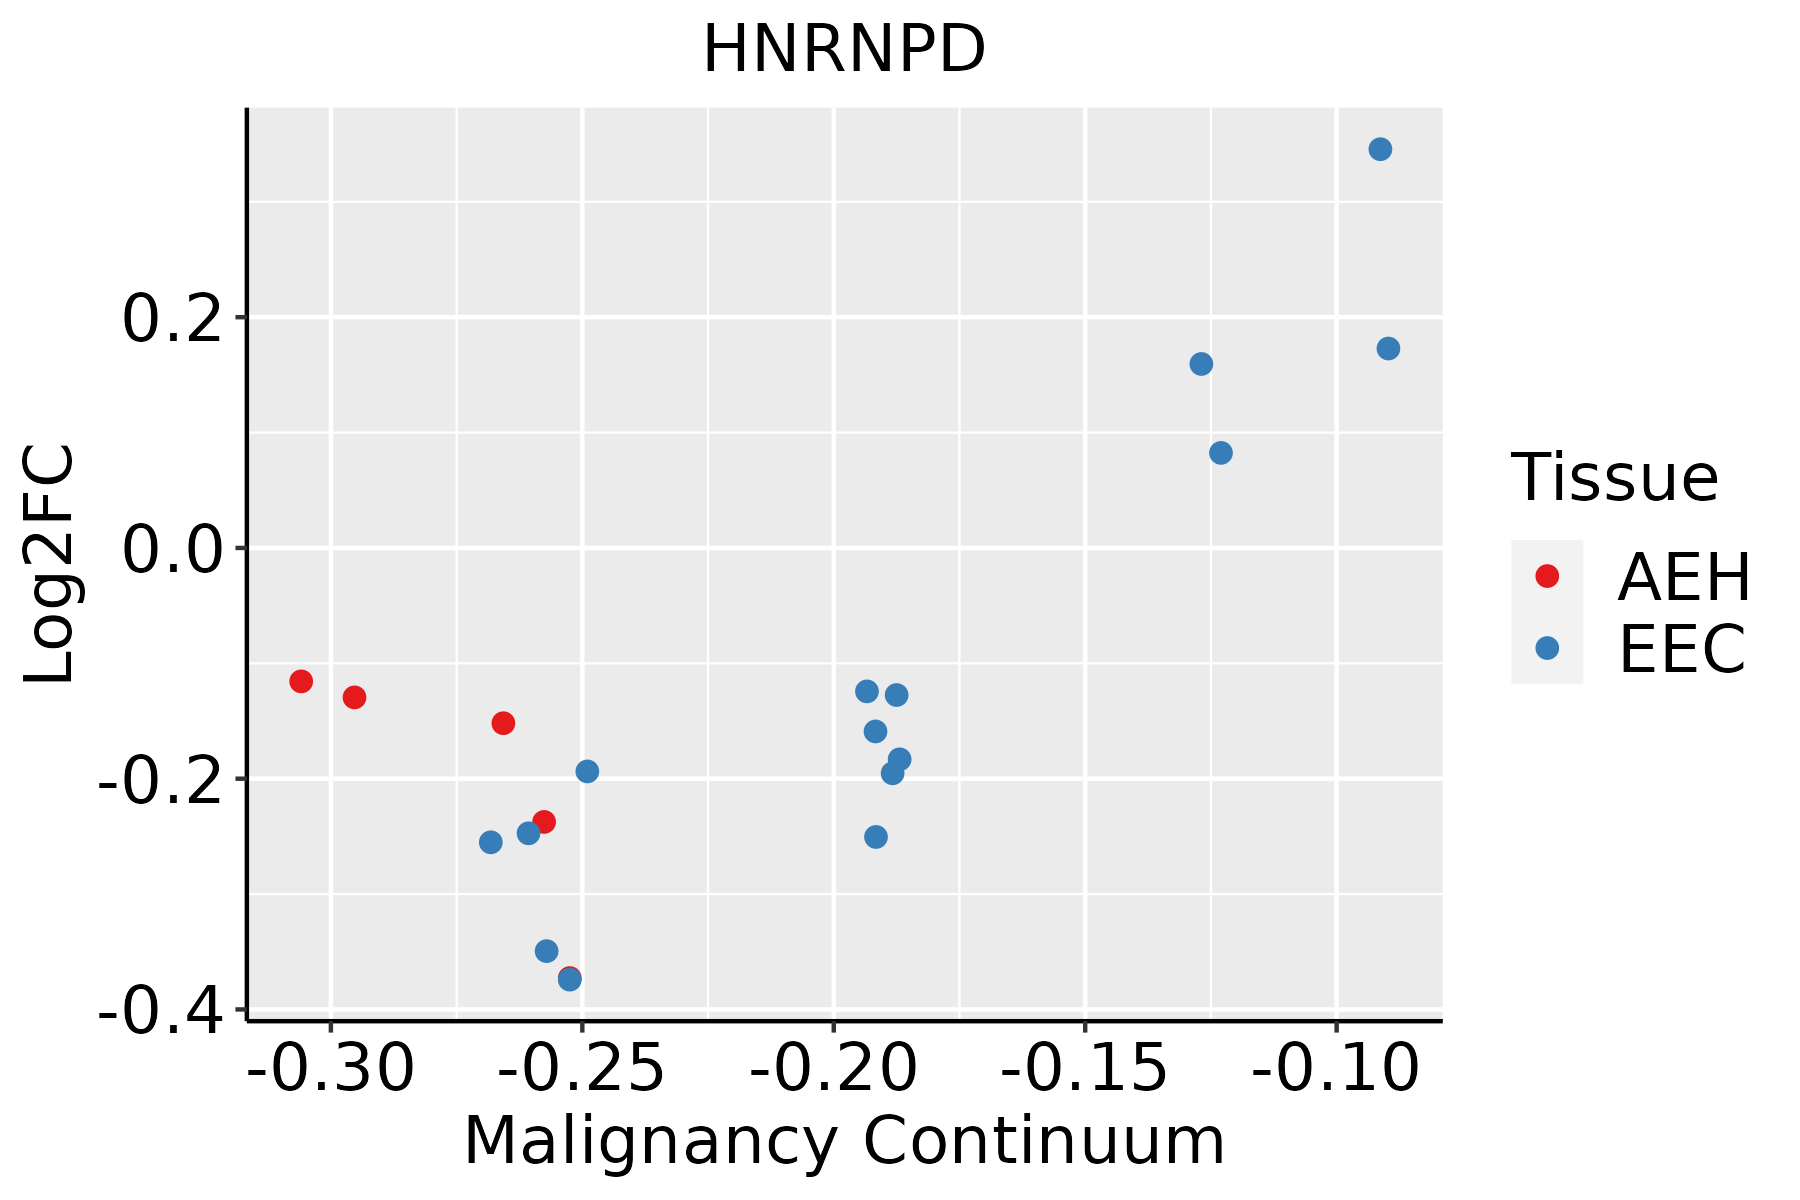 | AEH: Atypical endometrial hyperplasia |
| EEC: Endometrioid Cancer | ||
| Esophagus |  | ESCC: Esophageal squamous cell carcinoma |
| HGIN: High-grade intraepithelial neoplasias | ||
| LGIN: Low-grade intraepithelial neoplasias | ||
| GC | 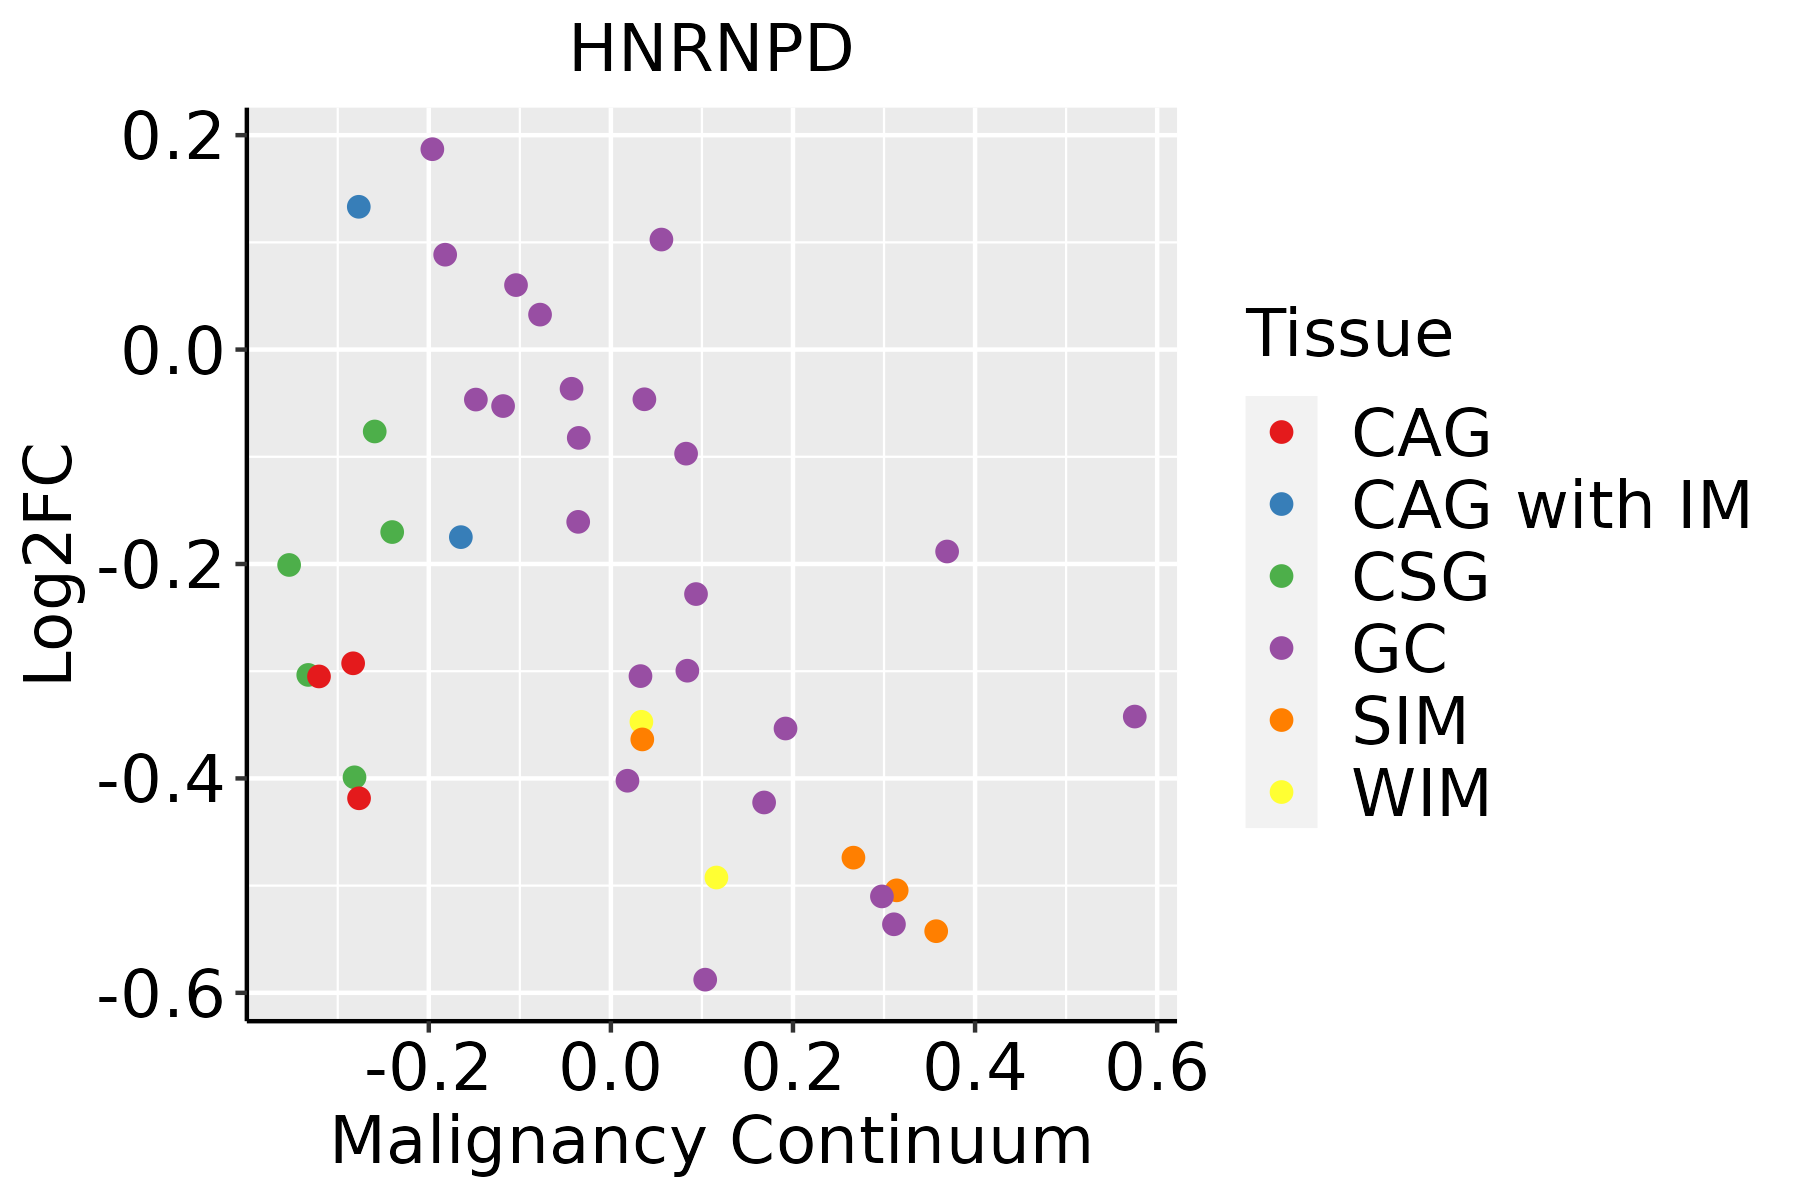 | CAG: Chronic atrophic gastritis |
| CAG with IM: Chronic atrophic gastritis with intestinal metaplasia | ||
| CSG: Chronic superficial gastritis | ||
| GC: Gastric cancer | ||
| SIM: Severe intestinal metaplasia | ||
| WIM: Wild intestinal metaplasia | ||
| Liver | 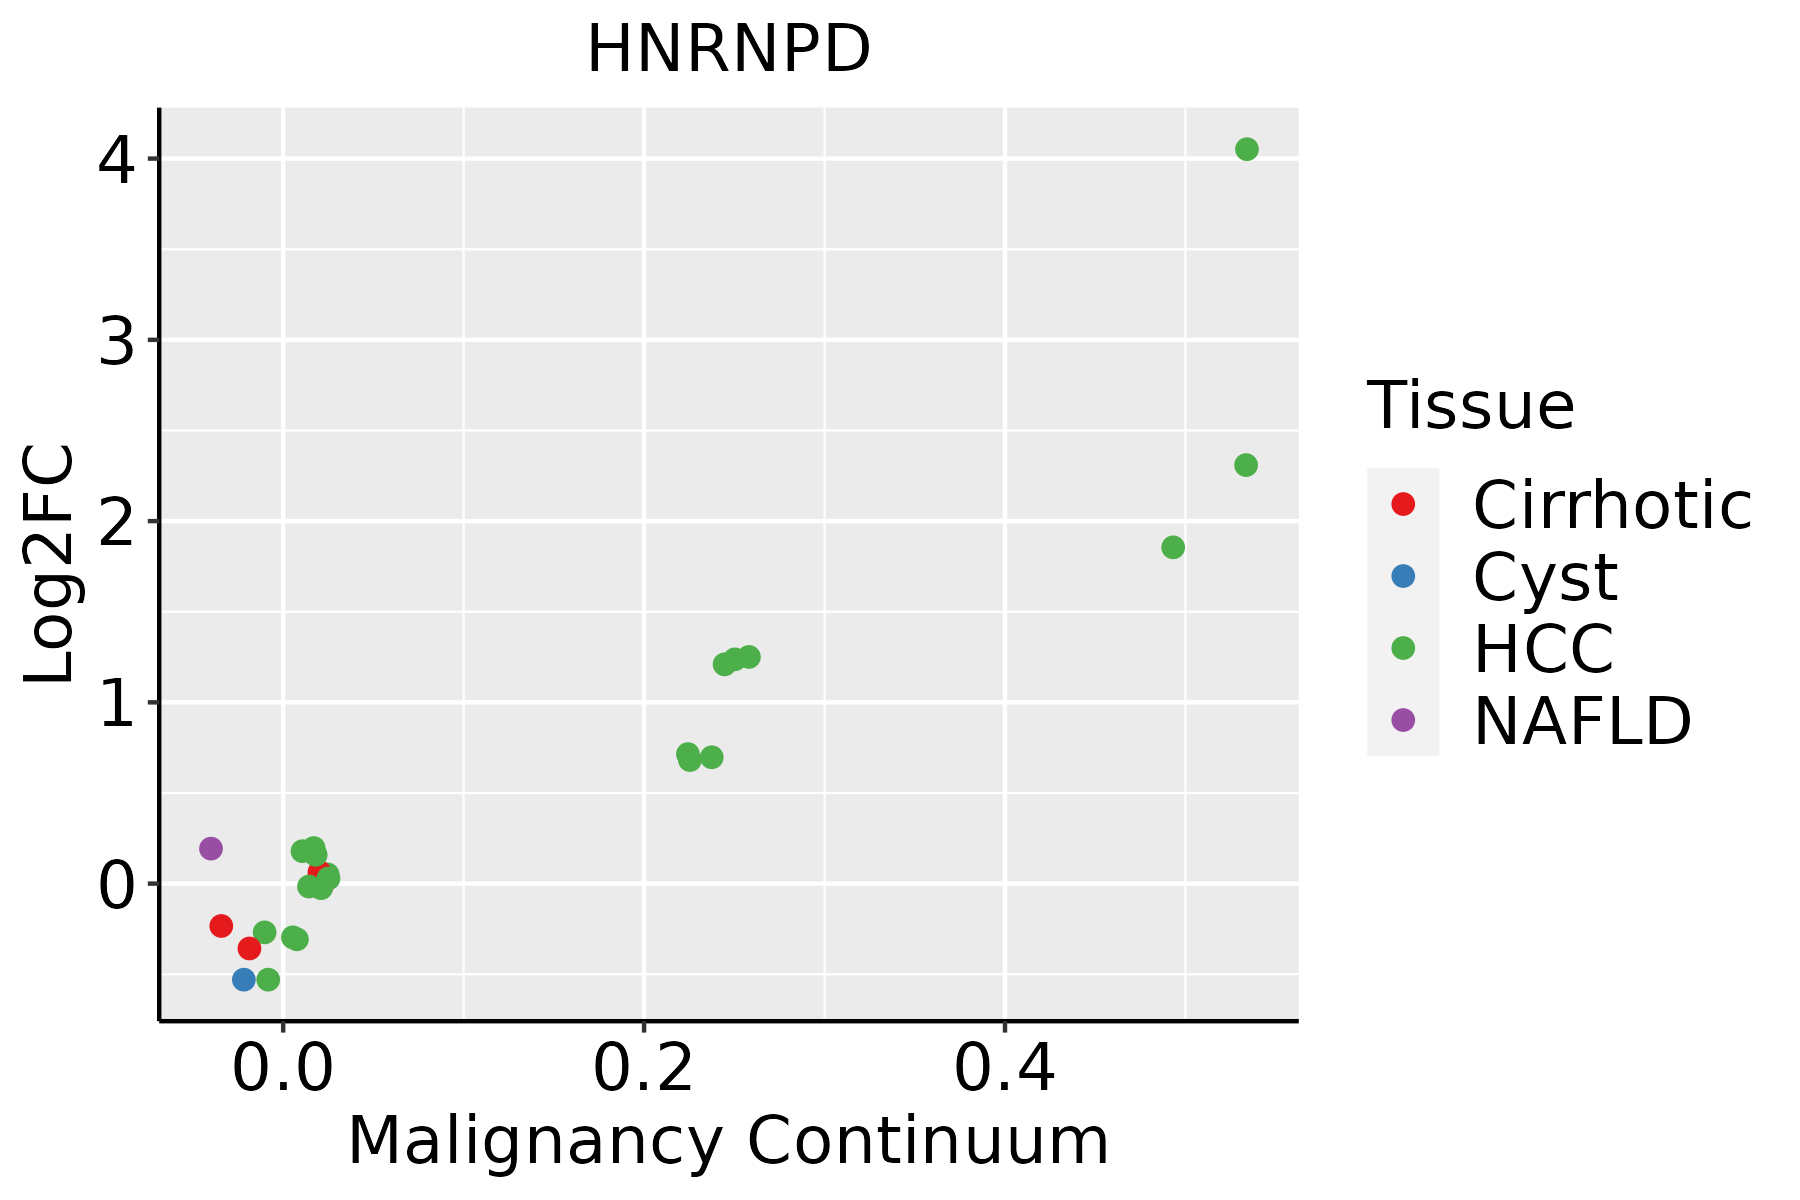 | HCC: Hepatocellular carcinoma |
| NAFLD: Non-alcoholic fatty liver disease | ||
| Oral Cavity |  | EOLP: Erosive Oral lichen planus |
| LP: leukoplakia | ||
| NEOLP: Non-erosive oral lichen planus | ||
| OSCC: Oral squamous cell carcinoma | ||
| Prostate |  | BPH: Benign Prostatic Hyperplasia |
| Skin | 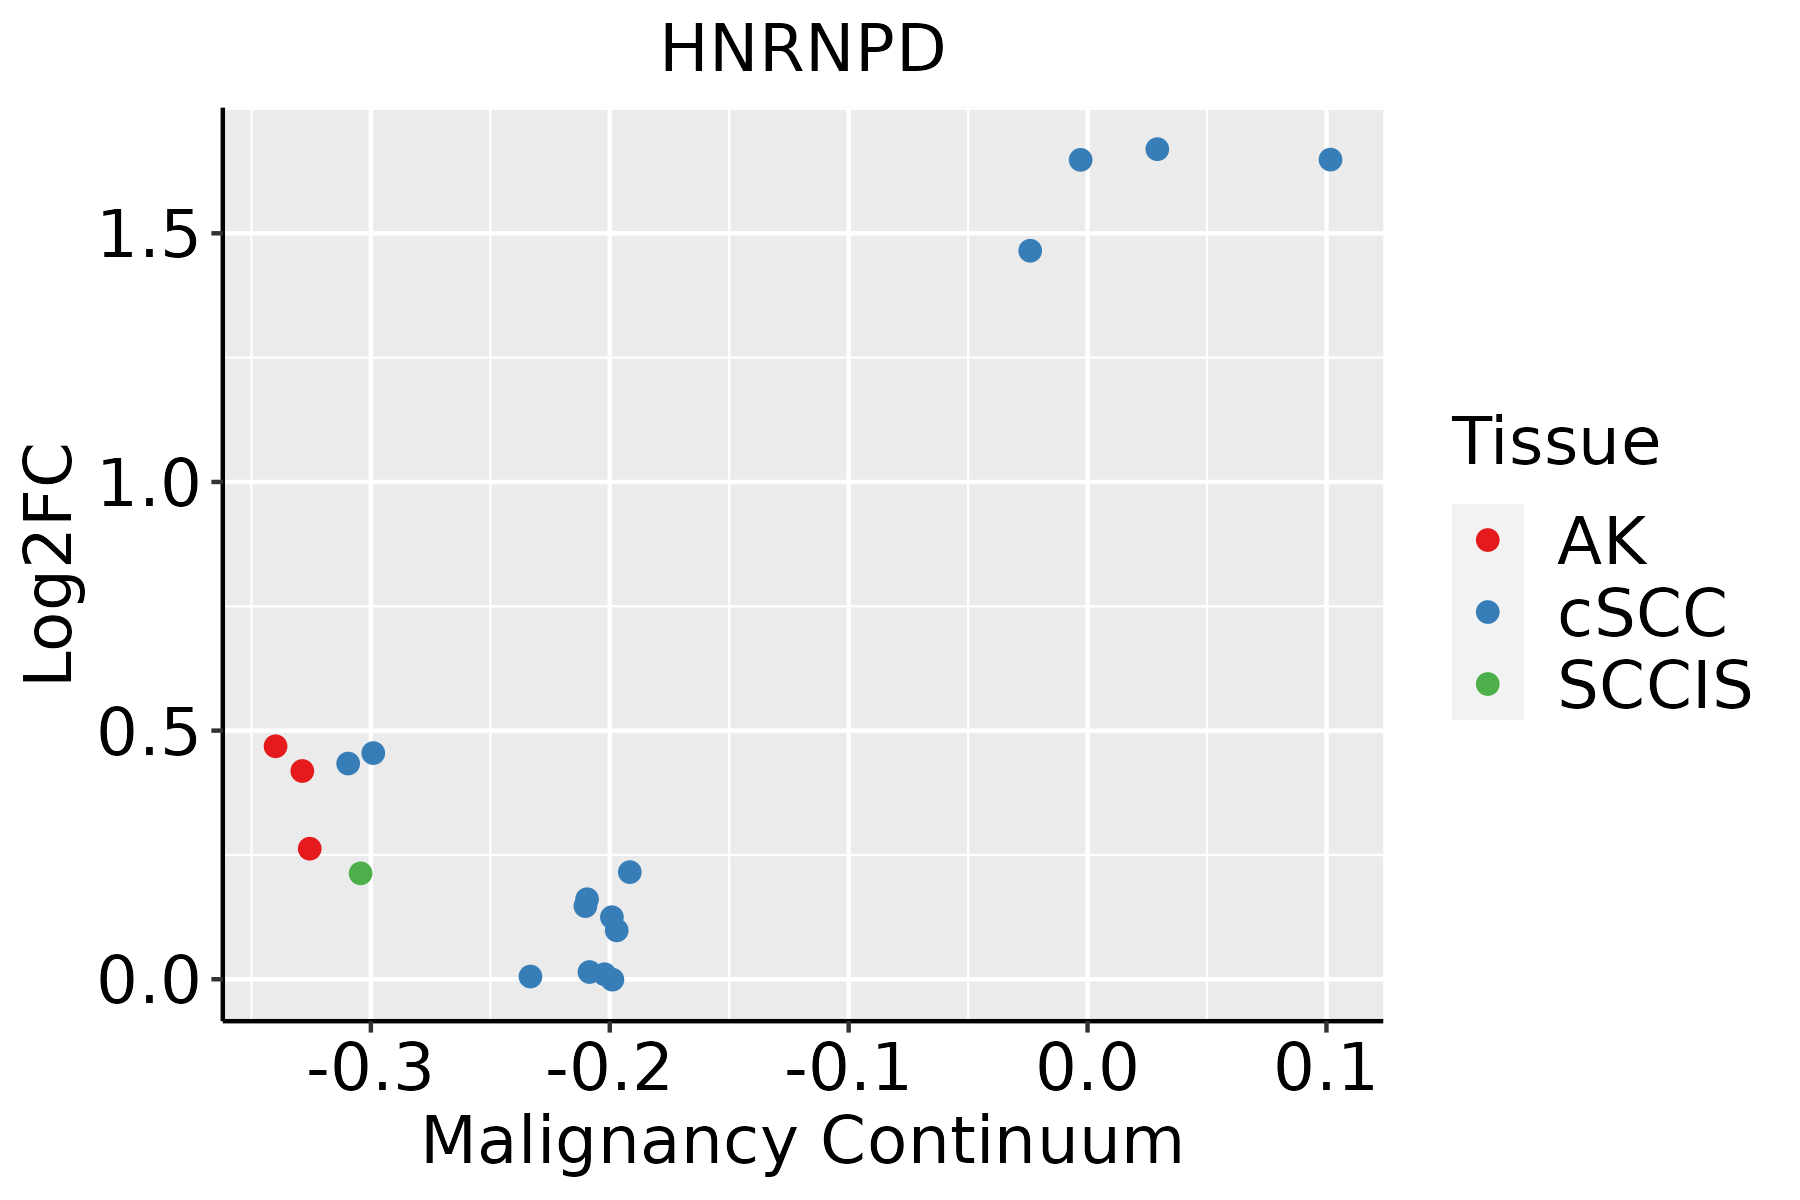 | AK: Actinic keratosis |
| cSCC: Cutaneous squamous cell carcinoma | ||
| SCCIS:squamous cell carcinoma in situ | ||
| Thyroid | 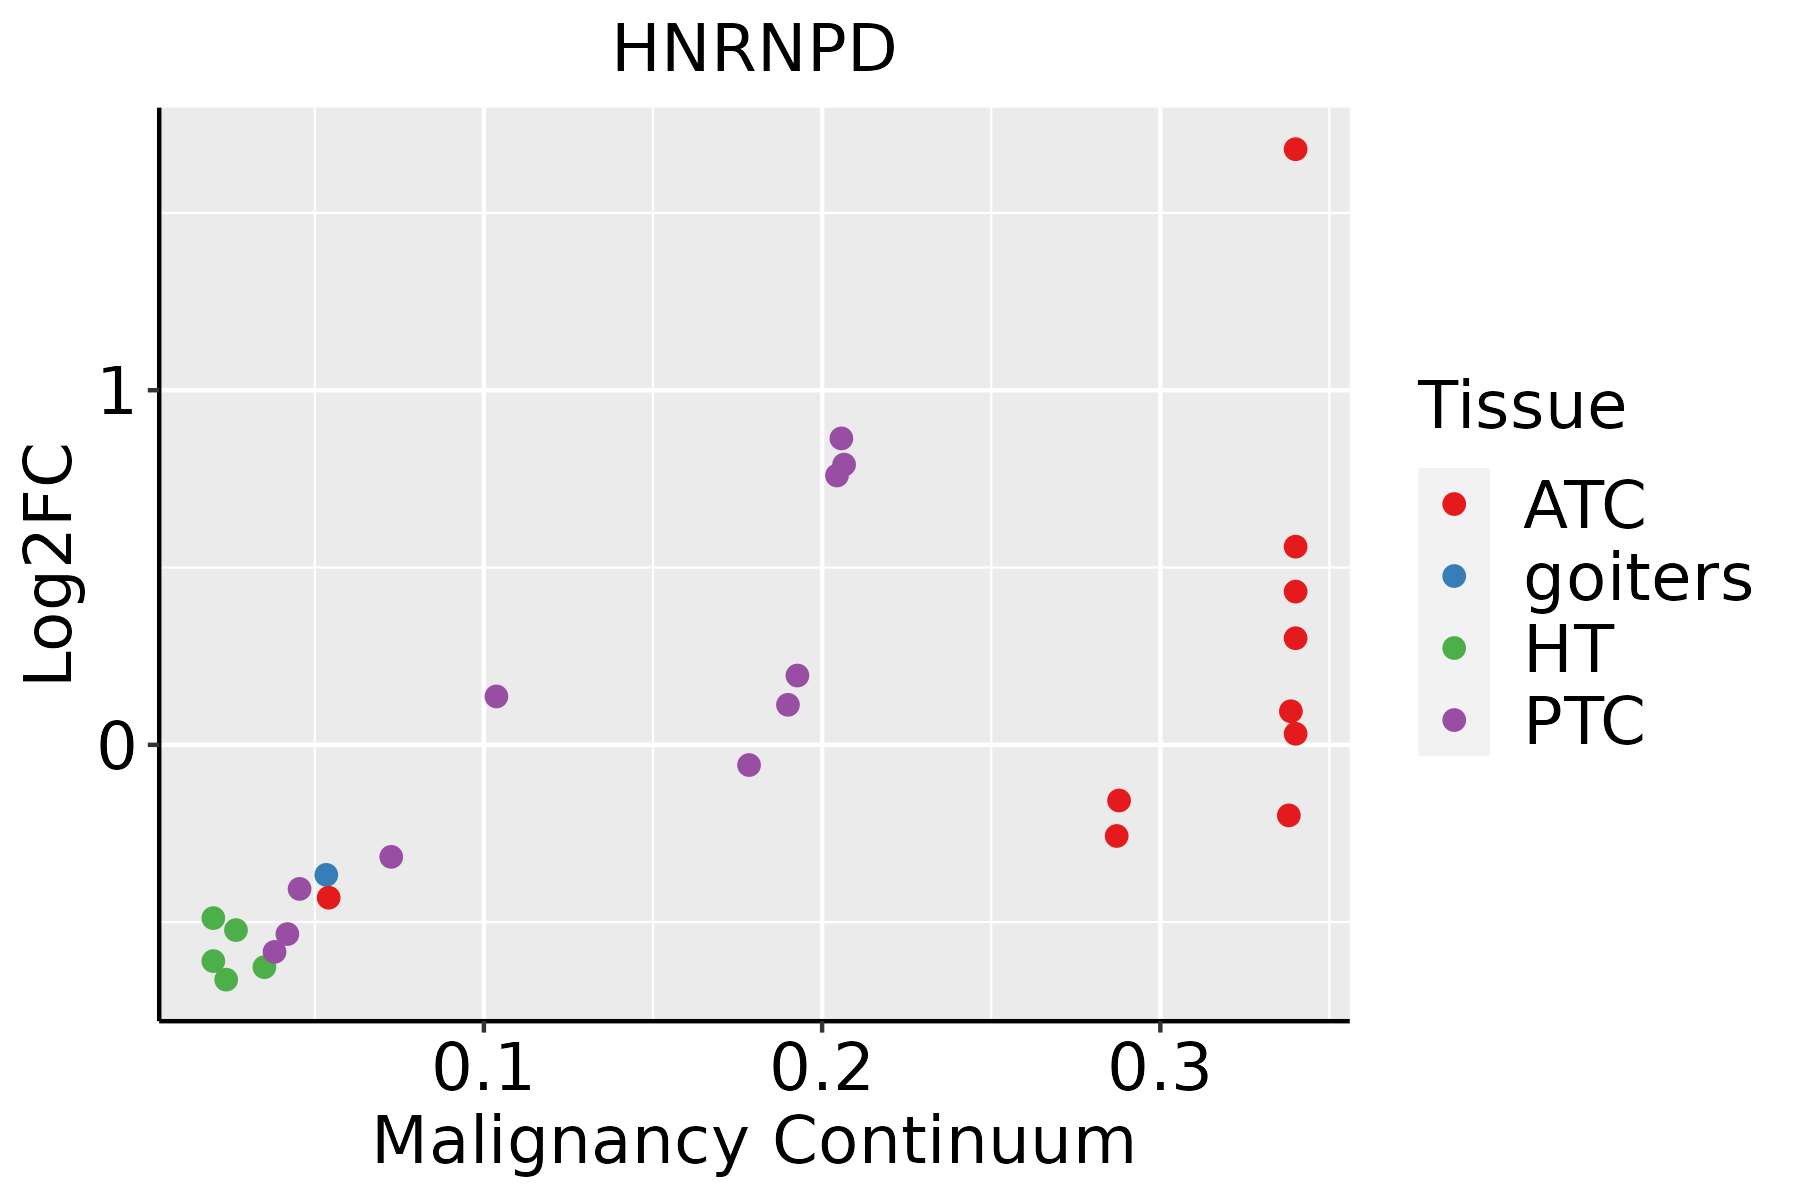 | ATC: Anaplastic thyroid cancer |
| HT: Hashimoto's thyroiditis | ||
| PTC: Papillary thyroid cancer |
| ∗log2FC in expression of this searched gene in stem-like cells from each diseased tissue sample relative to stem-like cells in normal samples in each tissue plotted against the malignancy continuum. Samples are colored based on if they are from different disease stage. |
Top |
Malignant transformation related pathway analysis |
| Find out the enriched GO biological processes and KEGG pathways involved in transition from healthy to precancer to cancer |
| Tissue | Disease Stage | Enriched GO biological Processes |
| Colorectum | AD |  |
| Colorectum | SER |  |
| Colorectum | MSS |  |
| Colorectum | MSI-H |  |
| Colorectum | FAP |  |
| ∗Top 15 enriched GO BP terms are showed in the bar plot of each disease state in each tissue. Each row represents a significant GO biological process which is colored according to the -log10(p.adjust). |
| Page: 1 2 3 4 5 6 7 8 9 |
| GO ID | Tissue | Disease Stage | Description | Gene Ratio | Bg Ratio | pvalue | p.adjust | Count |
| GO:20012524 | Colorectum | FAP | positive regulation of chromosome organization | 26/2622 | 82/18723 | 3.21e-05 | 7.20e-04 | 26 |
| GO:00610142 | Colorectum | FAP | positive regulation of mRNA catabolic process | 27/2622 | 87/18723 | 3.50e-05 | 7.69e-04 | 27 |
| GO:19013614 | Colorectum | FAP | organic cyclic compound catabolic process | 101/2622 | 495/18723 | 4.87e-05 | 9.93e-04 | 101 |
| GO:00330442 | Colorectum | FAP | regulation of chromosome organization | 46/2622 | 187/18723 | 7.41e-05 | 1.36e-03 | 46 |
| GO:00427523 | Colorectum | FAP | regulation of circadian rhythm | 33/2622 | 121/18723 | 9.26e-05 | 1.59e-03 | 33 |
| GO:00434893 | Colorectum | FAP | RNA stabilization | 21/2622 | 65/18723 | 1.33e-04 | 2.13e-03 | 21 |
| GO:00611572 | Colorectum | FAP | mRNA destabilization | 25/2622 | 84/18723 | 1.43e-04 | 2.24e-03 | 25 |
| GO:00507792 | Colorectum | FAP | RNA destabilization | 25/2622 | 88/18723 | 3.19e-04 | 4.12e-03 | 25 |
| GO:19016544 | Colorectum | FAP | response to ketone | 45/2622 | 194/18723 | 3.67e-04 | 4.63e-03 | 45 |
| GO:00342504 | Colorectum | FAP | positive regulation of cellular amide metabolic process | 39/2622 | 162/18723 | 4.02e-04 | 4.86e-03 | 39 |
| GO:00457274 | Colorectum | FAP | positive regulation of translation | 34/2622 | 136/18723 | 4.43e-04 | 5.25e-03 | 34 |
| GO:00322044 | Colorectum | FAP | regulation of telomere maintenance | 23/2622 | 80/18723 | 4.51e-04 | 5.32e-03 | 23 |
| GO:00322064 | Colorectum | FAP | positive regulation of telomere maintenance | 17/2622 | 52/18723 | 4.84e-04 | 5.59e-03 | 17 |
| GO:00973053 | Colorectum | FAP | response to alcohol | 55/2622 | 253/18723 | 5.05e-04 | 5.78e-03 | 55 |
| GO:19023733 | Colorectum | FAP | negative regulation of mRNA catabolic process | 19/2622 | 63/18723 | 7.22e-04 | 7.72e-03 | 19 |
| GO:00482553 | Colorectum | FAP | mRNA stabilization | 17/2622 | 56/18723 | 1.24e-03 | 1.16e-02 | 17 |
| GO:00007234 | Colorectum | FAP | telomere maintenance | 31/2622 | 131/18723 | 2.01e-03 | 1.67e-02 | 31 |
| GO:00171481 | Colorectum | FAP | negative regulation of translation | 50/2622 | 245/18723 | 3.57e-03 | 2.57e-02 | 50 |
| GO:0051592 | Colorectum | FAP | response to calcium ion | 33/2622 | 149/18723 | 4.52e-03 | 3.08e-02 | 33 |
| GO:00342491 | Colorectum | FAP | negative regulation of cellular amide metabolic process | 54/2622 | 273/18723 | 5.00e-03 | 3.33e-02 | 54 |
| Page: 1 2 3 4 5 6 7 8 9 10 11 12 13 14 15 16 17 18 19 20 21 22 23 24 25 26 27 28 29 30 31 32 33 34 35 36 37 38 39 40 41 42 43 44 45 46 47 48 49 50 51 52 53 54 55 56 57 58 59 60 61 62 63 |
| Pathway ID | Tissue | Disease Stage | Description | Gene Ratio | Bg Ratio | pvalue | p.adjust | qvalue | Count |
| Page: 1 |
Top |
Cell-cell communication analysis |
| Identification of potential cell-cell interactions between two cell types and their ligand-receptor pairs for different disease states |
| Ligand | Receptor | LRpair | Pathway | Tissue | Disease Stage |
| Page: 1 |
Top |
Single-cell gene regulatory network inference analysis |
| Find out the significant the regulons (TFs) and the target genes of each regulon across cell types for different disease states |
| TF | Cell Type | Tissue | Disease Stage | Target Gene | RSS | Regulon Activity |
| ∗The dot plots of a searched regulon are shown for all cell subpopulations in each disease state of each tissue based on the regulon specific score inferred using pySCENIC and by calculating the average expression. |
| Page: 1 |
Top |
Somatic mutation of malignant transformation related genes |
| Annotation of somatic variants for genes involved in malignant transformation |
| Hugo Symbol | Variant Class | Variant Classification | dbSNP RS | HGVSc | HGVSp | HGVSp Short | SWISSPROT | BIOTYPE | SIFT | PolyPhen | Tumor Sample Barcode | Tissue | Histology | Sex | Age | Stage | Therapy Types | Drugs | Outcome |
| HNRNPD | SNV | Missense_Mutation | novel | c.103C>A | p.Gln35Lys | p.Q35K | Q14103 | protein_coding | tolerated_low_confidence(0.51) | benign(0) | TCGA-A8-A07G-01 | Breast | breast invasive carcinoma | Female | >=65 | I/II | Chemotherapy | 5-fluorouracil | CR |
| HNRNPD | SNV | Missense_Mutation | c.995N>G | p.Tyr332Cys | p.Y332C | Q14103 | protein_coding | tolerated(0.05) | probably_damaging(0.926) | TCGA-BH-A0B8-01 | Breast | breast invasive carcinoma | Female | <65 | I/II | Hormone Therapy | arimidex | SD | |
| HNRNPD | SNV | Missense_Mutation | novel | c.766G>T | p.Val256Leu | p.V256L | Q14103 | protein_coding | tolerated(0.06) | benign(0.05) | TCGA-BH-A0BG-01 | Breast | breast invasive carcinoma | Female | >=65 | I/II | Unknown | Unknown | SD |
| HNRNPD | SNV | Missense_Mutation | novel | c.757N>A | p.Glu253Lys | p.E253K | Q14103 | protein_coding | deleterious(0.04) | possibly_damaging(0.842) | TCGA-D8-A1Y1-01 | Breast | breast invasive carcinoma | Female | >=65 | III/IV | Hormone Therapy | tamoxiphen | PD |
| HNRNPD | insertion | Frame_Shift_Ins | novel | c.793_794insT | p.Gln265LeufsTer8 | p.Q265Lfs*8 | Q14103 | protein_coding | TCGA-VS-A9UD-01 | Cervix | cervical & endocervical cancer | Female | >=65 | III/IV | Chemotherapy | cisplatin | CR | ||
| HNRNPD | SNV | Missense_Mutation | c.1052G>A | p.Ser351Asn | p.S351N | Q14103 | protein_coding | tolerated(1) | possibly_damaging(0.878) | TCGA-AA-3510-01 | Colorectum | colon adenocarcinoma | Male | >=65 | I/II | Unknown | Unknown | SD | |
| HNRNPD | SNV | Missense_Mutation | novel | c.565N>A | p.Leu189Ile | p.L189I | Q14103 | protein_coding | deleterious(0.01) | possibly_damaging(0.759) | TCGA-AA-3950-01 | Colorectum | colon adenocarcinoma | Female | >=65 | I/II | Unknown | Unknown | SD |
| HNRNPD | SNV | Missense_Mutation | c.528N>C | p.Lys176Asn | p.K176N | Q14103 | protein_coding | deleterious(0.02) | possibly_damaging(0.824) | TCGA-AA-3977-01 | Colorectum | colon adenocarcinoma | Male | >=65 | I/II | Unknown | Unknown | SD | |
| HNRNPD | SNV | Missense_Mutation | c.526A>C | p.Lys176Gln | p.K176Q | Q14103 | protein_coding | tolerated(0.05) | benign(0.254) | TCGA-CA-6718-01 | Colorectum | colon adenocarcinoma | Male | <65 | I/II | Unknown | Unknown | PD | |
| HNRNPD | SNV | Missense_Mutation | c.464N>C | p.Met155Thr | p.M155T | Q14103 | protein_coding | deleterious(0.01) | benign(0.138) | TCGA-CM-5861-01 | Colorectum | colon adenocarcinoma | Female | <65 | I/II | Unknown | Unknown | PD |
| Page: 1 2 3 4 |
Top |
Related drugs of malignant transformation related genes |
| Identification of chemicals and drugs interact with genes involved in malignant transfromation |
| (DGIdb 4.0) |
| Entrez ID | Symbol | Category | Interaction Types | Drug Claim Name | Drug Name | PMIDs |
| Page: 1 |

Copyright 2023-Present -The University of Texas Health Science Center at Houston |