
|
|||||
|
 | |
| |
| |
| |
| |
| |
|
Gene: HKDC1 |
Gene summary for HKDC1 |
| Gene information | Species | Human | Gene symbol | HKDC1 | Gene ID | 80201 |
| Gene name | hexokinase domain containing 1 | |
| Gene Alias | HKDC1 | |
| Cytomap | 10q22.1 | |
| Gene Type | protein-coding | GO ID | GO:0001678 | UniProtAcc | B3KT70 |
Top |
Malignant transformation analysis |
| Identification of the aberrant gene expression in precancerous and cancerous lesions by comparing the gene expression of stem-like cells in diseased tissues with normal stem cells |
| Entrez ID | Symbol | Replicates | Species | Organ | Tissue | Adj P-value | Log2FC | Malignancy |
| 80201 | HKDC1 | HTA11_3410_2000001011 | Human | Colorectum | AD | 4.21e-06 | 2.16e-01 | 0.0155 |
| 80201 | HKDC1 | HTA11_2487_2000001011 | Human | Colorectum | SER | 2.63e-15 | 7.42e-01 | -0.1808 |
| 80201 | HKDC1 | HTA11_1938_2000001011 | Human | Colorectum | AD | 2.32e-23 | 7.44e-01 | -0.0811 |
| 80201 | HKDC1 | HTA11_78_2000001011 | Human | Colorectum | AD | 2.68e-04 | 3.50e-01 | -0.1088 |
| 80201 | HKDC1 | HTA11_2112_2000001011 | Human | Colorectum | SER | 3.24e-02 | 4.72e-01 | -0.2196 |
| 80201 | HKDC1 | HTA11_3361_2000001011 | Human | Colorectum | AD | 2.33e-06 | 4.76e-01 | -0.1207 |
| 80201 | HKDC1 | HTA11_83_2000001011 | Human | Colorectum | SER | 2.40e-08 | 7.27e-01 | -0.1526 |
| 80201 | HKDC1 | HTA11_696_2000001011 | Human | Colorectum | AD | 6.15e-04 | 1.93e-01 | -0.1464 |
| 80201 | HKDC1 | HTA11_866_2000001011 | Human | Colorectum | AD | 1.48e-02 | 1.69e-01 | -0.1001 |
| 80201 | HKDC1 | HTA11_1391_2000001011 | Human | Colorectum | AD | 1.52e-26 | 1.00e+00 | -0.059 |
| 80201 | HKDC1 | HTA11_10711_2000001011 | Human | Colorectum | AD | 1.17e-03 | 2.13e-01 | 0.0338 |
| 80201 | HKDC1 | HTA11_7696_3000711011 | Human | Colorectum | AD | 3.42e-16 | 4.09e-01 | 0.0674 |
| 80201 | HKDC1 | HTA11_6818_2000001011 | Human | Colorectum | AD | 8.39e-03 | 3.42e-01 | 0.0112 |
| 80201 | HKDC1 | HTA11_6818_2000001021 | Human | Colorectum | AD | 3.92e-05 | 3.30e-01 | 0.0588 |
| 80201 | HKDC1 | HTA11_99999965104_69814 | Human | Colorectum | MSS | 5.57e-13 | 5.96e-01 | 0.281 |
| 80201 | HKDC1 | HTA11_99999971662_82457 | Human | Colorectum | MSS | 1.65e-36 | 9.29e-01 | 0.3859 |
| 80201 | HKDC1 | HTA11_99999973899_84307 | Human | Colorectum | MSS | 1.54e-07 | 4.60e-01 | 0.2585 |
| 80201 | HKDC1 | HTA11_99999974143_84620 | Human | Colorectum | MSS | 1.04e-28 | 6.62e-01 | 0.3005 |
| 80201 | HKDC1 | A001-C-104 | Human | Colorectum | FAP | 6.18e-04 | 2.37e-01 | 0.0184 |
| 80201 | HKDC1 | CRC-1-8810 | Human | Colorectum | CRC | 9.96e-07 | 3.29e-01 | 0.6257 |
| Page: 1 2 3 |
| Tissue | Expression Dynamics | Abbreviation |
| Colorectum (GSE201348) | 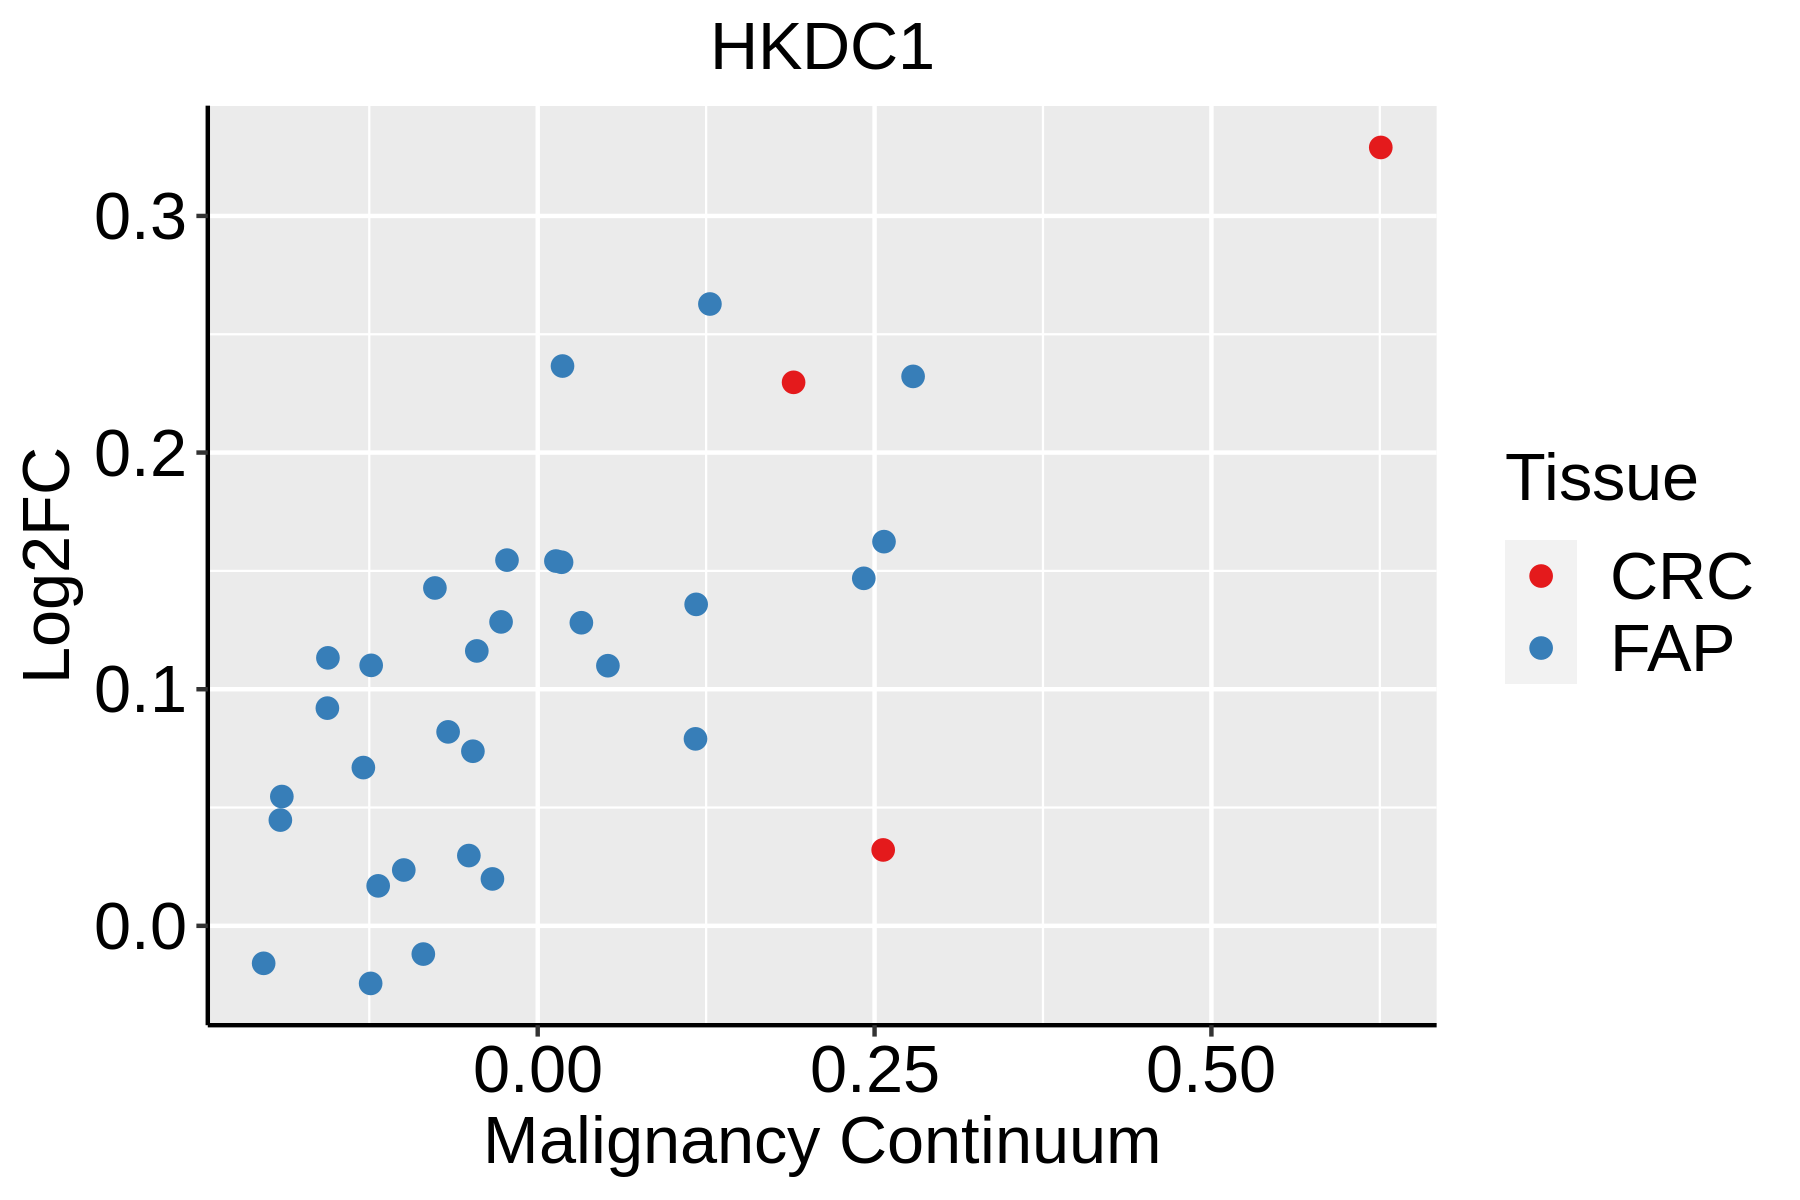 | FAP: Familial adenomatous polyposis |
| CRC: Colorectal cancer | ||
| Colorectum (HTA11) | 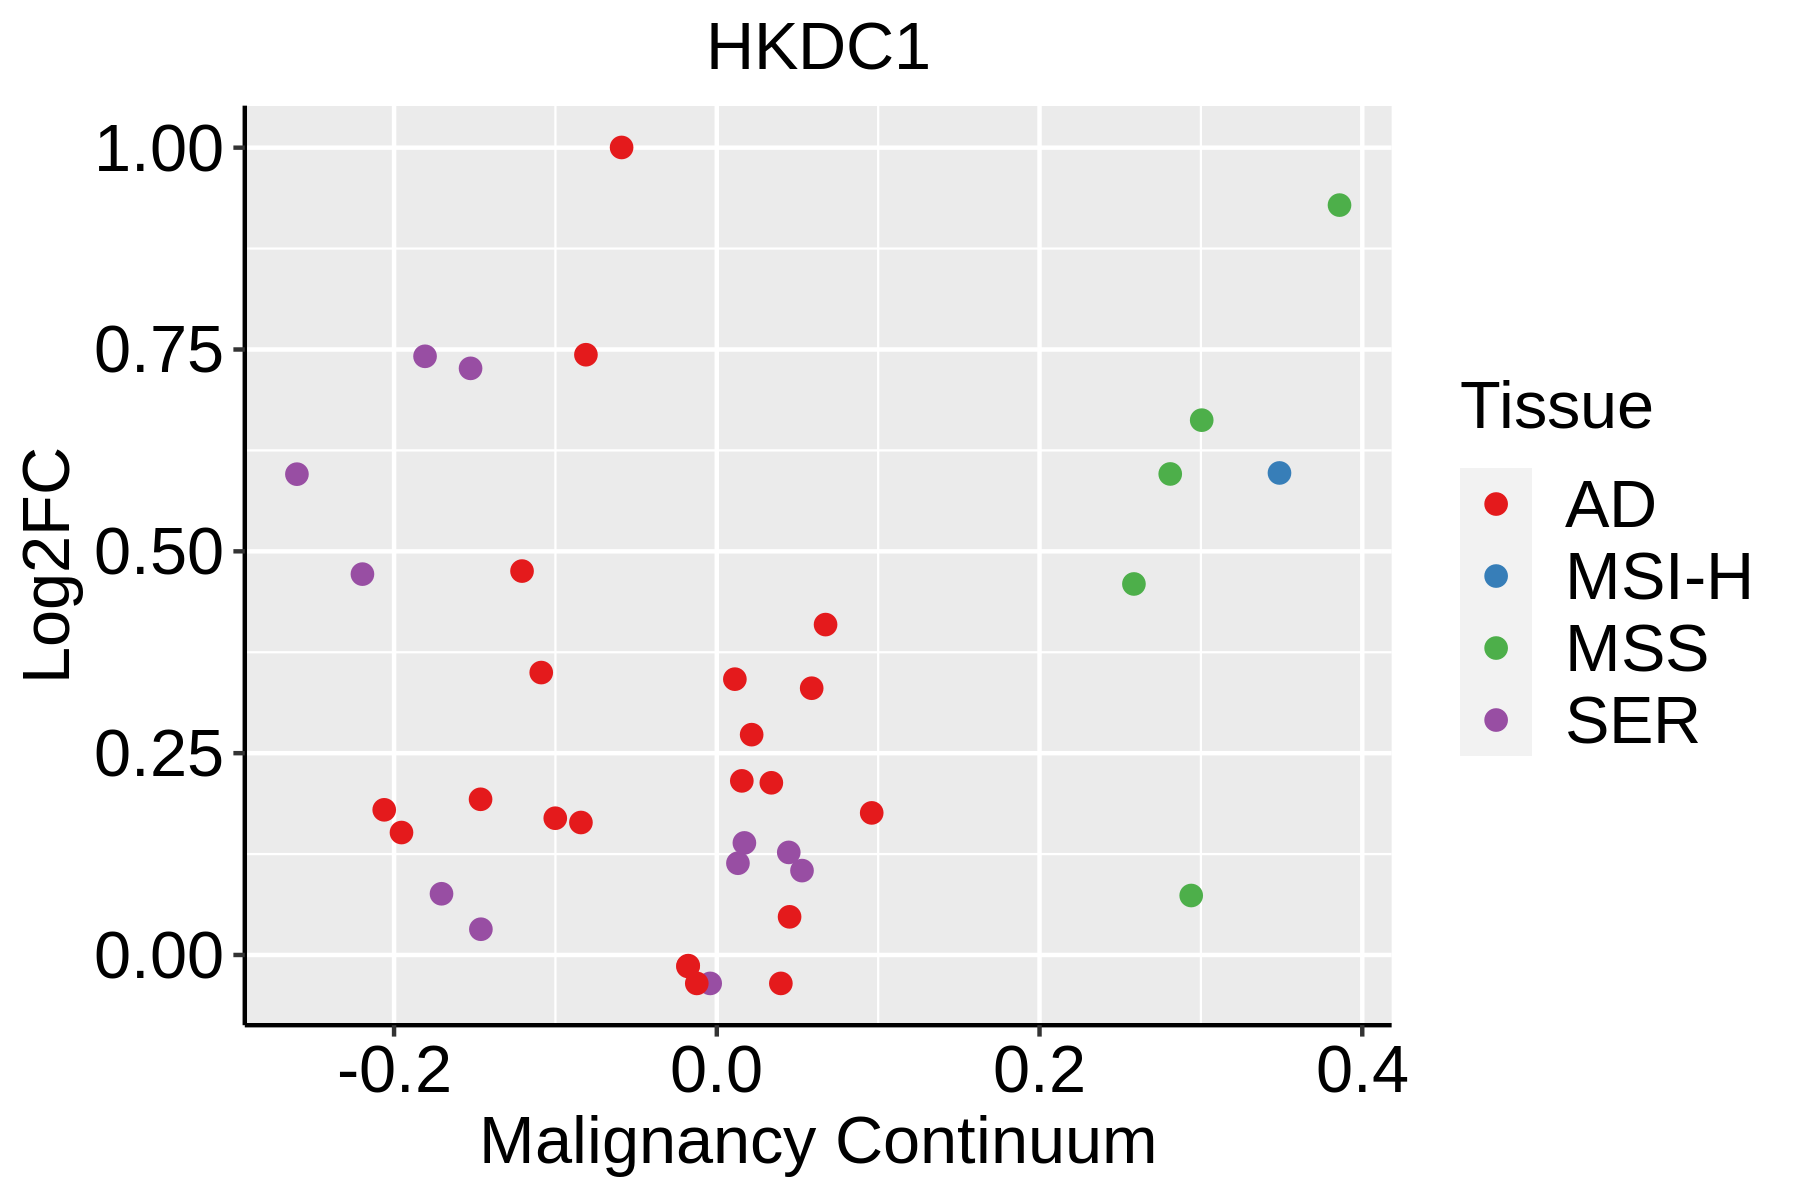 | AD: Adenomas |
| SER: Sessile serrated lesions | ||
| MSI-H: Microsatellite-high colorectal cancer | ||
| MSS: Microsatellite stable colorectal cancer | ||
| Endometrium |  | AEH: Atypical endometrial hyperplasia |
| EEC: Endometrioid Cancer | ||
| GC | 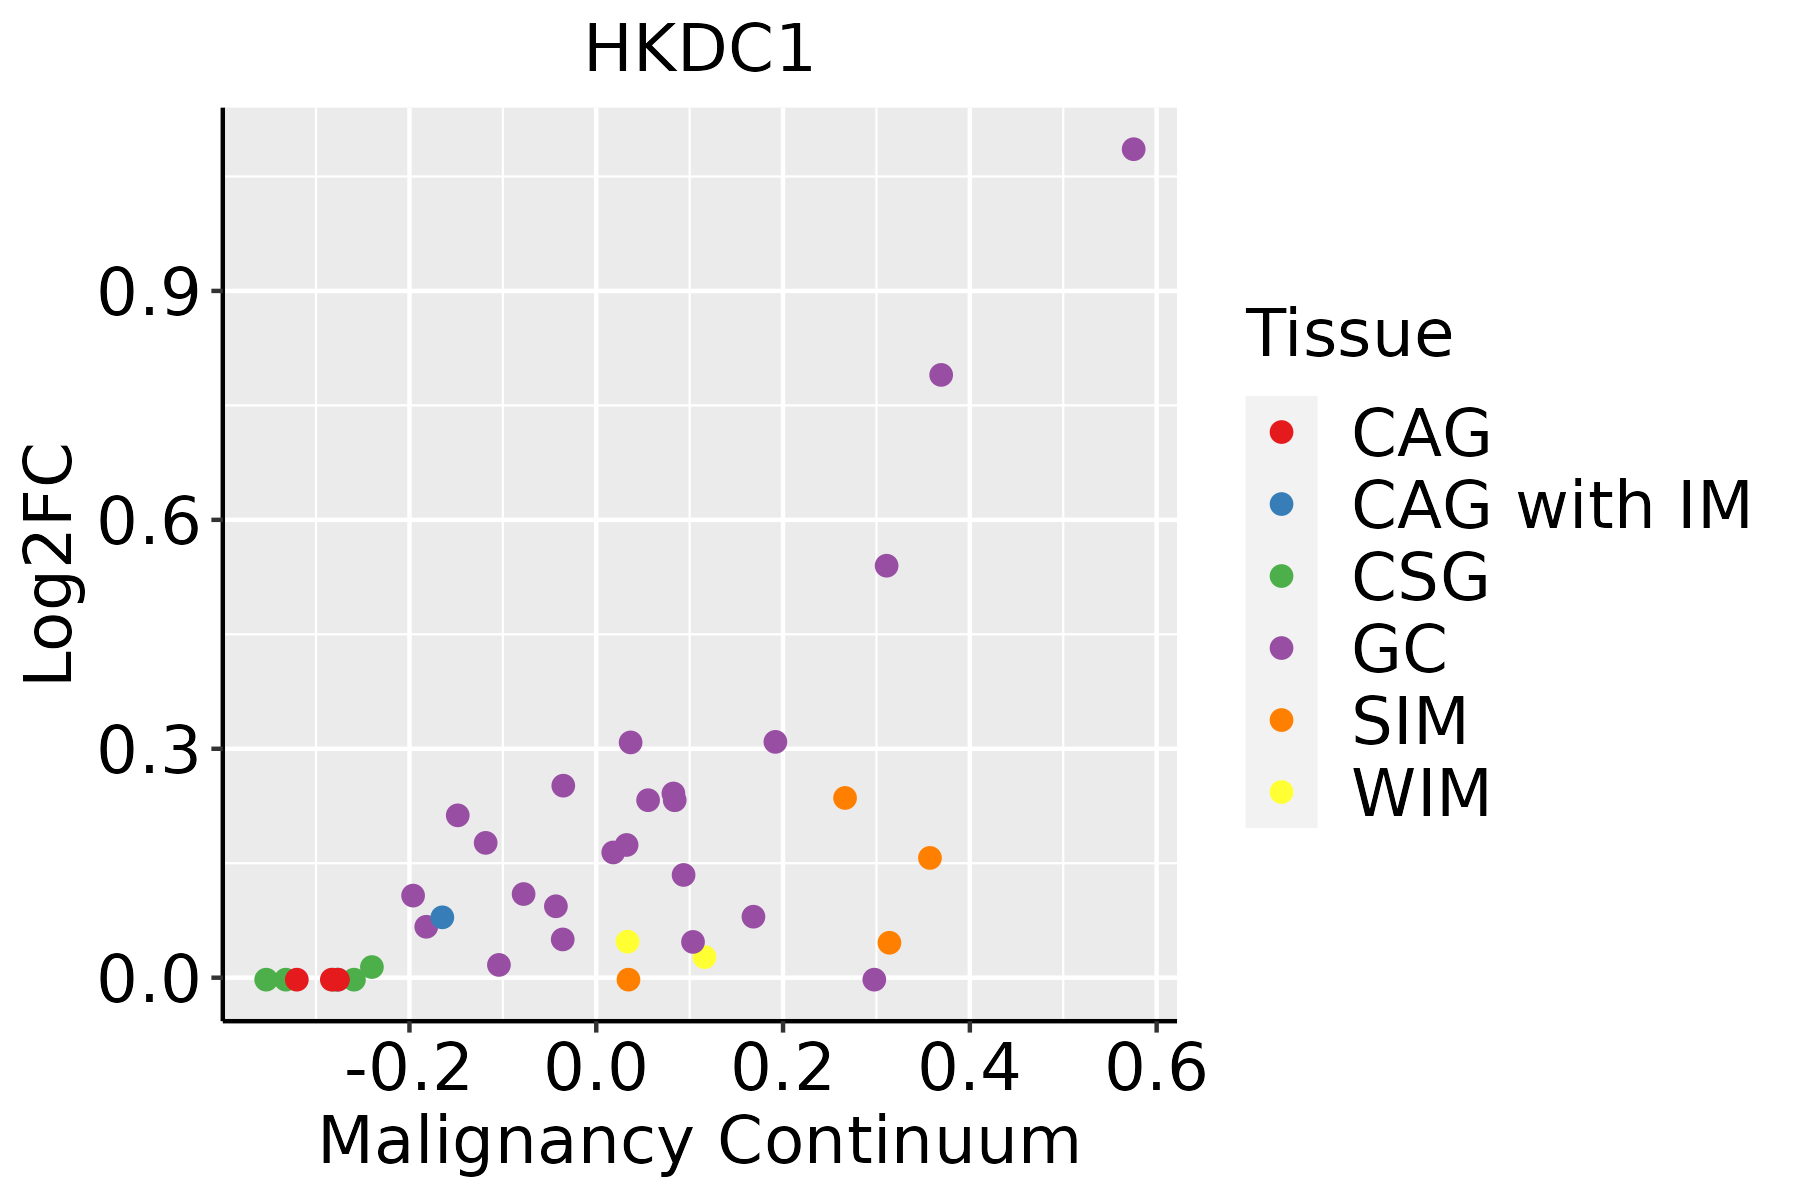 | CAG: Chronic atrophic gastritis |
| CAG with IM: Chronic atrophic gastritis with intestinal metaplasia | ||
| CSG: Chronic superficial gastritis | ||
| GC: Gastric cancer | ||
| SIM: Severe intestinal metaplasia | ||
| WIM: Wild intestinal metaplasia | ||
| Liver | 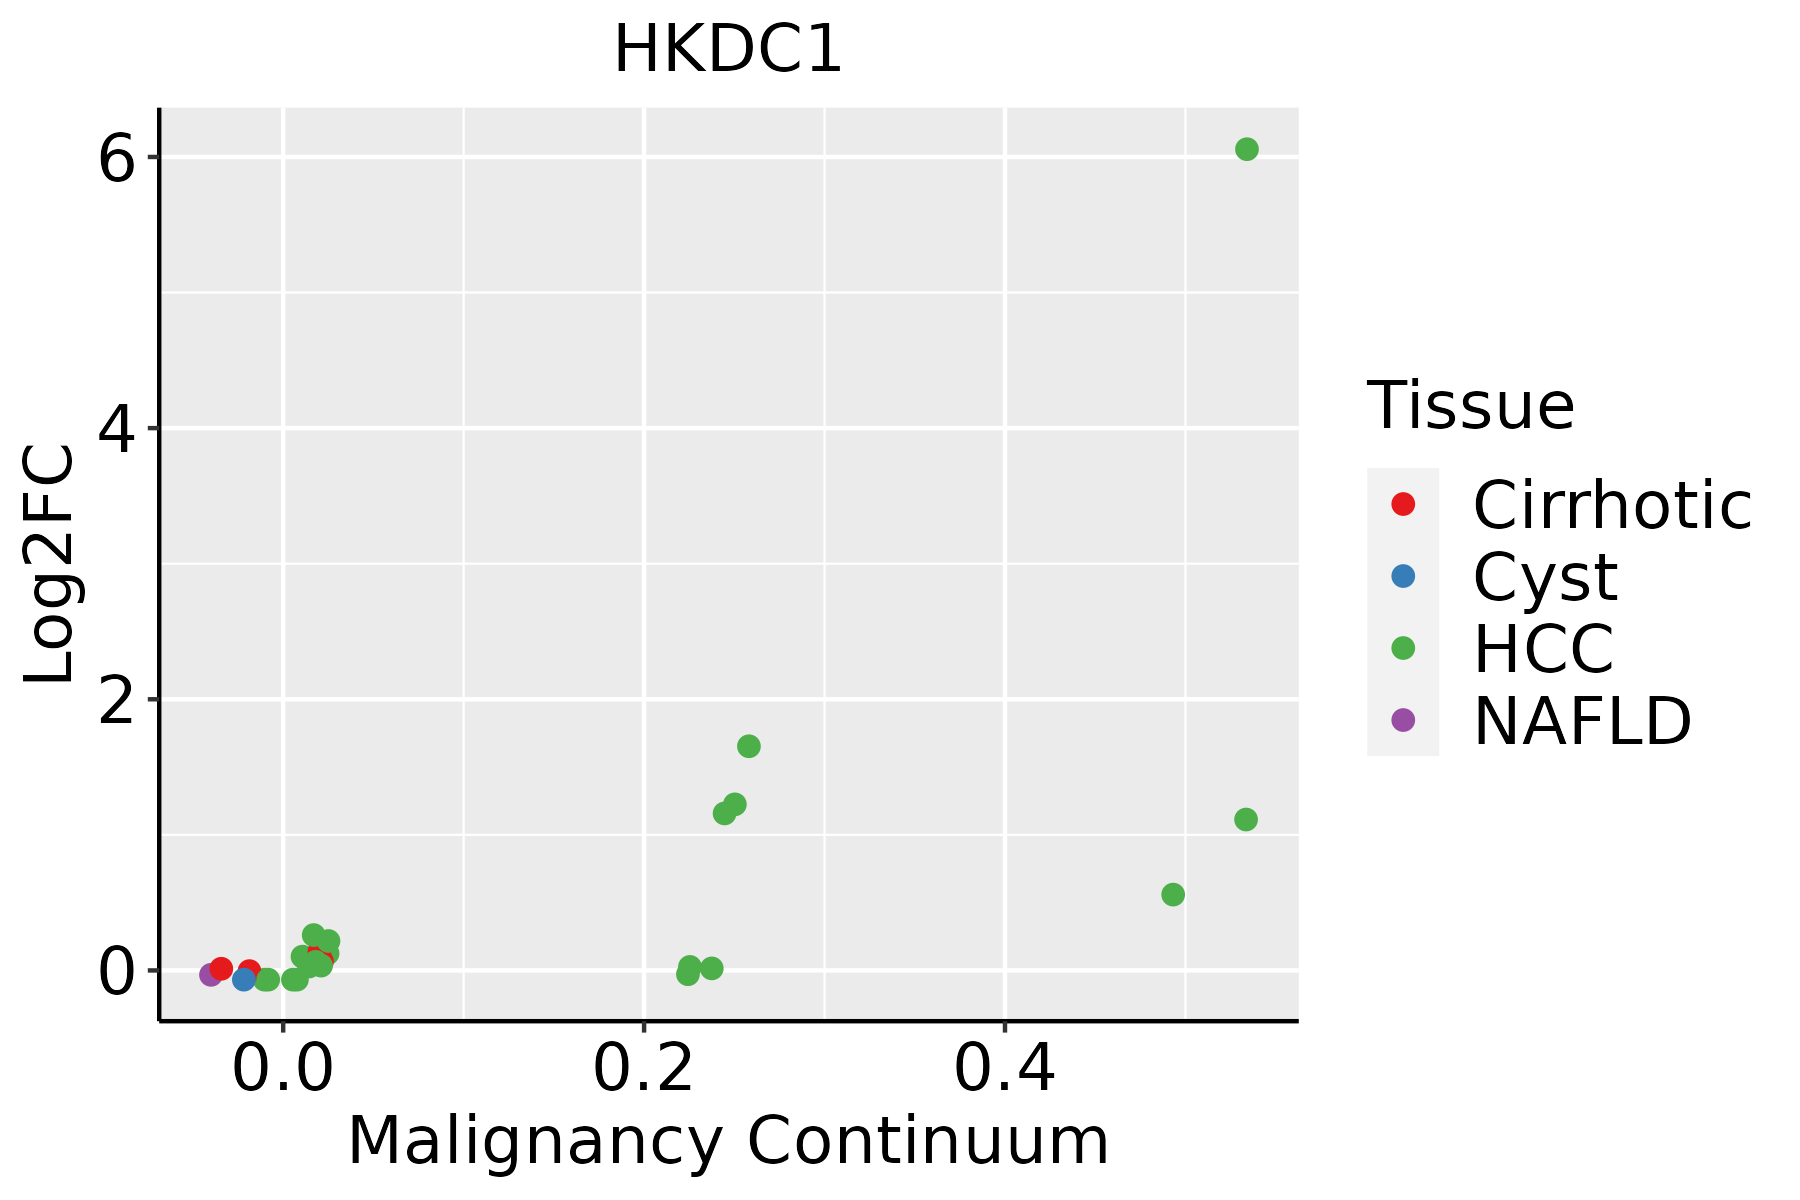 | HCC: Hepatocellular carcinoma |
| NAFLD: Non-alcoholic fatty liver disease |
| ∗log2FC in expression of this searched gene in stem-like cells from each diseased tissue sample relative to stem-like cells in normal samples in each tissue plotted against the malignancy continuum. Samples are colored based on if they are from different disease stage. |
Top |
Malignant transformation related pathway analysis |
| Find out the enriched GO biological processes and KEGG pathways involved in transition from healthy to precancer to cancer |
| Tissue | Disease Stage | Enriched GO biological Processes |
| Colorectum | AD |  |
| Colorectum | SER |  |
| Colorectum | MSS |  |
| Colorectum | MSI-H |  |
| Colorectum | FAP |  |
| ∗Top 15 enriched GO BP terms are showed in the bar plot of each disease state in each tissue. Each row represents a significant GO biological process which is colored according to the -log10(p.adjust). |
| Page: 1 2 3 4 5 6 7 8 9 |
| GO ID | Tissue | Disease Stage | Description | Gene Ratio | Bg Ratio | pvalue | p.adjust | Count |
| GO:000675322 | Liver | HCC | nucleoside phosphate metabolic process | 304/7958 | 497/18723 | 1.78e-17 | 1.85e-15 | 304 |
| GO:001969322 | Liver | HCC | ribose phosphate metabolic process | 248/7958 | 396/18723 | 3.15e-16 | 2.70e-14 | 248 |
| GO:000925922 | Liver | HCC | ribonucleotide metabolic process | 240/7958 | 385/18723 | 2.07e-15 | 1.51e-13 | 240 |
| GO:000915022 | Liver | HCC | purine ribonucleotide metabolic process | 226/7958 | 368/18723 | 1.36e-13 | 7.69e-12 | 226 |
| GO:007252122 | Liver | HCC | purine-containing compound metabolic process | 250/7958 | 416/18723 | 2.26e-13 | 1.24e-11 | 250 |
| GO:000599621 | Liver | HCC | monosaccharide metabolic process | 167/7958 | 257/18723 | 2.31e-13 | 1.25e-11 | 167 |
| GO:001931821 | Liver | HCC | hexose metabolic process | 155/7958 | 237/18723 | 7.63e-13 | 3.90e-11 | 155 |
| GO:000616322 | Liver | HCC | purine nucleotide metabolic process | 236/7958 | 396/18723 | 3.59e-12 | 1.62e-10 | 236 |
| GO:000609022 | Liver | HCC | pyruvate metabolic process | 73/7958 | 106/18723 | 3.52e-08 | 7.82e-07 | 73 |
| GO:001605222 | Liver | HCC | carbohydrate catabolic process | 99/7958 | 154/18723 | 3.79e-08 | 8.30e-07 | 99 |
| GO:000918522 | Liver | HCC | ribonucleoside diphosphate metabolic process | 72/7958 | 106/18723 | 1.05e-07 | 2.03e-06 | 72 |
| GO:004603122 | Liver | HCC | ADP metabolic process | 63/7958 | 90/18723 | 1.17e-07 | 2.25e-06 | 63 |
| GO:000913522 | Liver | HCC | purine nucleoside diphosphate metabolic process | 70/7958 | 103/18723 | 1.52e-07 | 2.82e-06 | 70 |
| GO:000917922 | Liver | HCC | purine ribonucleoside diphosphate metabolic process | 70/7958 | 103/18723 | 1.52e-07 | 2.82e-06 | 70 |
| GO:000913222 | Liver | HCC | nucleoside diphosphate metabolic process | 81/7958 | 124/18723 | 2.34e-07 | 4.17e-06 | 81 |
| GO:004693922 | Liver | HCC | nucleotide phosphorylation | 68/7958 | 101/18723 | 3.95e-07 | 6.70e-06 | 68 |
| GO:000616522 | Liver | HCC | nucleoside diphosphate phosphorylation | 66/7958 | 99/18723 | 1.01e-06 | 1.52e-05 | 66 |
| GO:000609622 | Liver | HCC | glycolytic process | 56/7958 | 81/18723 | 1.11e-06 | 1.65e-05 | 56 |
| GO:000675722 | Liver | HCC | ATP generation from ADP | 56/7958 | 82/18723 | 2.06e-06 | 2.83e-05 | 56 |
| GO:004426221 | Liver | HCC | cellular carbohydrate metabolic process | 153/7958 | 283/18723 | 5.27e-05 | 5.00e-04 | 153 |
| Page: 1 2 3 4 5 6 7 8 9 10 11 12 13 14 |
| Pathway ID | Tissue | Disease Stage | Description | Gene Ratio | Bg Ratio | pvalue | p.adjust | qvalue | Count |
| hsa05131 | Colorectum | AD | Shigellosis | 109/2092 | 247/8465 | 1.09e-11 | 2.44e-10 | 1.55e-10 | 109 |
| hsa01200 | Colorectum | AD | Carbon metabolism | 55/2092 | 115/8465 | 5.53e-08 | 8.42e-07 | 5.37e-07 | 55 |
| hsa00010 | Colorectum | AD | Glycolysis / Gluconeogenesis | 34/2092 | 67/8465 | 3.63e-06 | 4.34e-05 | 2.77e-05 | 34 |
| hsa04066 | Colorectum | AD | HIF-1 signaling pathway | 48/2092 | 109/8465 | 7.25e-06 | 7.84e-05 | 5.00e-05 | 48 |
| hsa05230 | Colorectum | AD | Central carbon metabolism in cancer | 33/2092 | 70/8465 | 3.61e-05 | 3.19e-04 | 2.03e-04 | 33 |
| hsa00051 | Colorectum | AD | Fructose and mannose metabolism | 17/2092 | 34/8465 | 1.25e-03 | 8.02e-03 | 5.12e-03 | 17 |
| hsa051311 | Colorectum | AD | Shigellosis | 109/2092 | 247/8465 | 1.09e-11 | 2.44e-10 | 1.55e-10 | 109 |
| hsa012001 | Colorectum | AD | Carbon metabolism | 55/2092 | 115/8465 | 5.53e-08 | 8.42e-07 | 5.37e-07 | 55 |
| hsa000101 | Colorectum | AD | Glycolysis / Gluconeogenesis | 34/2092 | 67/8465 | 3.63e-06 | 4.34e-05 | 2.77e-05 | 34 |
| hsa040661 | Colorectum | AD | HIF-1 signaling pathway | 48/2092 | 109/8465 | 7.25e-06 | 7.84e-05 | 5.00e-05 | 48 |
| hsa052301 | Colorectum | AD | Central carbon metabolism in cancer | 33/2092 | 70/8465 | 3.61e-05 | 3.19e-04 | 2.03e-04 | 33 |
| hsa000511 | Colorectum | AD | Fructose and mannose metabolism | 17/2092 | 34/8465 | 1.25e-03 | 8.02e-03 | 5.12e-03 | 17 |
| hsa051312 | Colorectum | SER | Shigellosis | 87/1580 | 247/8465 | 3.07e-10 | 7.27e-09 | 5.28e-09 | 87 |
| hsa012002 | Colorectum | SER | Carbon metabolism | 40/1580 | 115/8465 | 2.77e-05 | 3.41e-04 | 2.47e-04 | 40 |
| hsa040662 | Colorectum | SER | HIF-1 signaling pathway | 36/1580 | 109/8465 | 2.27e-04 | 2.15e-03 | 1.56e-03 | 36 |
| hsa052302 | Colorectum | SER | Central carbon metabolism in cancer | 25/1580 | 70/8465 | 5.43e-04 | 4.51e-03 | 3.27e-03 | 25 |
| hsa000102 | Colorectum | SER | Glycolysis / Gluconeogenesis | 24/1580 | 67/8465 | 6.62e-04 | 5.36e-03 | 3.89e-03 | 24 |
| hsa051313 | Colorectum | SER | Shigellosis | 87/1580 | 247/8465 | 3.07e-10 | 7.27e-09 | 5.28e-09 | 87 |
| hsa012003 | Colorectum | SER | Carbon metabolism | 40/1580 | 115/8465 | 2.77e-05 | 3.41e-04 | 2.47e-04 | 40 |
| hsa040663 | Colorectum | SER | HIF-1 signaling pathway | 36/1580 | 109/8465 | 2.27e-04 | 2.15e-03 | 1.56e-03 | 36 |
| Page: 1 2 3 4 5 |
Top |
Cell-cell communication analysis |
| Identification of potential cell-cell interactions between two cell types and their ligand-receptor pairs for different disease states |
| Ligand | Receptor | LRpair | Pathway | Tissue | Disease Stage |
| Page: 1 |
Top |
Single-cell gene regulatory network inference analysis |
| Find out the significant the regulons (TFs) and the target genes of each regulon across cell types for different disease states |
| TF | Cell Type | Tissue | Disease Stage | Target Gene | RSS | Regulon Activity |
| ∗The dot plots of a searched regulon are shown for all cell subpopulations in each disease state of each tissue based on the regulon specific score inferred using pySCENIC and by calculating the average expression. |
| Page: 1 |
Top |
Somatic mutation of malignant transformation related genes |
| Annotation of somatic variants for genes involved in malignant transformation |
| Hugo Symbol | Variant Class | Variant Classification | dbSNP RS | HGVSc | HGVSp | HGVSp Short | SWISSPROT | BIOTYPE | SIFT | PolyPhen | Tumor Sample Barcode | Tissue | Histology | Sex | Age | Stage | Therapy Types | Drugs | Outcome |
| HKDC1 | SNV | Missense_Mutation | novel | c.885N>C | p.Lys295Asn | p.K295N | Q2TB90 | protein_coding | deleterious(0) | probably_damaging(1) | TCGA-3C-AALI-01 | Breast | breast invasive carcinoma | Female | <65 | I/II | Unspecific | Poly E | Complete Response |
| HKDC1 | SNV | Missense_Mutation | c.859A>C | p.Asn287His | p.N287H | Q2TB90 | protein_coding | deleterious(0.03) | possibly_damaging(0.594) | TCGA-A8-A07R-01 | Breast | breast invasive carcinoma | Female | >=65 | III/IV | Ancillary | zoledronic | SD | |
| HKDC1 | SNV | Missense_Mutation | novel | c.720N>T | p.Glu240Asp | p.E240D | Q2TB90 | protein_coding | deleterious(0) | probably_damaging(0.968) | TCGA-AN-A046-01 | Breast | breast invasive carcinoma | Female | >=65 | I/II | Unknown | Unknown | SD |
| HKDC1 | SNV | Missense_Mutation | novel | c.2367C>G | p.Ile789Met | p.I789M | Q2TB90 | protein_coding | deleterious(0.02) | probably_damaging(1) | TCGA-GM-A2DO-01 | Breast | breast invasive carcinoma | Female | <65 | I/II | Hormone Therapy | tamoxiphen | CR |
| HKDC1 | SNV | Missense_Mutation | novel | c.1597N>T | p.Leu533Phe | p.L533F | Q2TB90 | protein_coding | deleterious(0.01) | probably_damaging(0.962) | TCGA-LL-A5YP-01 | Breast | breast invasive carcinoma | Female | <65 | I/II | Chemotherapy | cytoxan | SD |
| HKDC1 | insertion | Nonsense_Mutation | novel | c.1795_1796insAGCTGGGACTACAGGCGCCCAGCACCACACCCGGA | p.Phe599Ter | p.F599* | Q2TB90 | protein_coding | TCGA-AO-A0JB-01 | Breast | breast invasive carcinoma | Female | <65 | III/IV | Chemotherapy | cyclophosphamide | SD | ||
| HKDC1 | insertion | Frame_Shift_Ins | novel | c.782_783insCAAGCTGCTTCCCTCAGCGAGA | p.Trp261CysfsTer23 | p.W261Cfs*23 | Q2TB90 | protein_coding | TCGA-B6-A0IN-01 | Breast | breast invasive carcinoma | Female | <65 | I/II | Unknown | Unknown | PD | ||
| HKDC1 | insertion | Nonsense_Mutation | novel | c.307_308insACTGTGCCCAGCCCCCACCTTTCAATTAATGGCATCTGTCTTGG | p.Arg103HisfsTer10 | p.R103Hfs*10 | Q2TB90 | protein_coding | TCGA-B6-A0RE-01 | Breast | breast invasive carcinoma | Female | <65 | I/II | Unknown | Unknown | SD | ||
| HKDC1 | SNV | Missense_Mutation | c.1099N>A | p.Asp367Asn | p.D367N | Q2TB90 | protein_coding | deleterious(0) | probably_damaging(1) | TCGA-LP-A4AV-01 | Cervix | cervical & endocervical cancer | Female | <65 | I/II | Unknown | Unknown | SD | |
| HKDC1 | SNV | Missense_Mutation | novel | c.464N>G | p.Ser155Cys | p.S155C | Q2TB90 | protein_coding | deleterious(0) | probably_damaging(1) | TCGA-VS-A8EL-01 | Cervix | cervical & endocervical cancer | Female | <65 | I/II | Chemotherapy | cisplatin | CR |
| Page: 1 2 3 4 5 6 7 8 9 10 11 12 |
Top |
Related drugs of malignant transformation related genes |
| Identification of chemicals and drugs interact with genes involved in malignant transfromation |
| (DGIdb 4.0) |
| Entrez ID | Symbol | Category | Interaction Types | Drug Claim Name | Drug Name | PMIDs |
| 80201 | HKDC1 | DRUGGABLE GENOME, KINASE | SJ000044511 | CHEMBL592124 | ||
| 80201 | HKDC1 | DRUGGABLE GENOME, KINASE | OXOPURPUREINE | OXOPURPUREINE | ||
| 80201 | HKDC1 | DRUGGABLE GENOME, KINASE | DNDI1417874 | CHEMBL1865517 | ||
| 80201 | HKDC1 | DRUGGABLE GENOME, KINASE | 2,6-DIMETHOXYQUINONE | 2,6-DIMETHOXYQUINONE | ||
| 80201 | HKDC1 | DRUGGABLE GENOME, KINASE | ALEXIDINE HYDROCHLORIDE | ALEXIDINE HYDROCHLORIDE | ||
| 80201 | HKDC1 | DRUGGABLE GENOME, KINASE | DEOXYVASICINONE | DEOXYVASICINONE | ||
| 80201 | HKDC1 | DRUGGABLE GENOME, KINASE | NSC-95397 | CHEMBL429095 | ||
| 80201 | HKDC1 | DRUGGABLE GENOME, KINASE | SJ000032153 | CHEMBL600862 | ||
| 80201 | HKDC1 | DRUGGABLE GENOME, KINASE | CHLORHEXIDINE | CHLORHEXIDINE | ||
| 80201 | HKDC1 | DRUGGABLE GENOME, KINASE | NSC-37642 | CHEMBL1707907 |
| Page: 1 2 |

Copyright 2023-Present -The University of Texas Health Science Center at Houston |