
|
|||||
|
 | |
| |
| |
| |
| |
| |
|
Gene: FZR1 |
Gene summary for FZR1 |
| Gene information | Species | Human | Gene symbol | FZR1 | Gene ID | 51343 |
| Gene name | fizzy and cell division cycle 20 related 1 | |
| Gene Alias | CDC20C | |
| Cytomap | 19p13.3 | |
| Gene Type | protein-coding | GO ID | GO:0000003 | UniProtAcc | Q9UM11 |
Top |
Malignant transformation analysis |
| Identification of the aberrant gene expression in precancerous and cancerous lesions by comparing the gene expression of stem-like cells in diseased tissues with normal stem cells |
| Entrez ID | Symbol | Replicates | Species | Organ | Tissue | Adj P-value | Log2FC | Malignancy |
| 51343 | FZR1 | LZE4T | Human | Esophagus | ESCC | 7.08e-03 | 7.87e-02 | 0.0811 |
| 51343 | FZR1 | LZE7T | Human | Esophagus | ESCC | 2.86e-05 | 2.48e-01 | 0.0667 |
| 51343 | FZR1 | LZE20T | Human | Esophagus | ESCC | 3.99e-04 | 1.56e-01 | 0.0662 |
| 51343 | FZR1 | LZE24T | Human | Esophagus | ESCC | 8.00e-05 | 1.53e-01 | 0.0596 |
| 51343 | FZR1 | LZE21T | Human | Esophagus | ESCC | 3.73e-05 | 3.56e-01 | 0.0655 |
| 51343 | FZR1 | P1T-E | Human | Esophagus | ESCC | 6.13e-14 | 4.88e-01 | 0.0875 |
| 51343 | FZR1 | P2T-E | Human | Esophagus | ESCC | 1.25e-14 | 1.52e-01 | 0.1177 |
| 51343 | FZR1 | P4T-E | Human | Esophagus | ESCC | 1.29e-12 | 1.95e-01 | 0.1323 |
| 51343 | FZR1 | P5T-E | Human | Esophagus | ESCC | 1.98e-19 | 2.15e-01 | 0.1327 |
| 51343 | FZR1 | P8T-E | Human | Esophagus | ESCC | 9.67e-17 | 1.86e-01 | 0.0889 |
| 51343 | FZR1 | P9T-E | Human | Esophagus | ESCC | 4.48e-09 | 2.44e-01 | 0.1131 |
| 51343 | FZR1 | P10T-E | Human | Esophagus | ESCC | 2.55e-15 | 2.58e-01 | 0.116 |
| 51343 | FZR1 | P11T-E | Human | Esophagus | ESCC | 8.78e-05 | 2.97e-01 | 0.1426 |
| 51343 | FZR1 | P12T-E | Human | Esophagus | ESCC | 4.23e-13 | 2.27e-01 | 0.1122 |
| 51343 | FZR1 | P15T-E | Human | Esophagus | ESCC | 1.87e-08 | 1.34e-01 | 0.1149 |
| 51343 | FZR1 | P16T-E | Human | Esophagus | ESCC | 1.97e-09 | 7.37e-02 | 0.1153 |
| 51343 | FZR1 | P17T-E | Human | Esophagus | ESCC | 3.21e-04 | 3.49e-01 | 0.1278 |
| 51343 | FZR1 | P20T-E | Human | Esophagus | ESCC | 3.36e-03 | 1.19e-01 | 0.1124 |
| 51343 | FZR1 | P21T-E | Human | Esophagus | ESCC | 4.27e-12 | 1.09e-01 | 0.1617 |
| 51343 | FZR1 | P22T-E | Human | Esophagus | ESCC | 2.25e-14 | 7.95e-02 | 0.1236 |
| Page: 1 2 3 4 5 |
| Tissue | Expression Dynamics | Abbreviation |
| Esophagus | 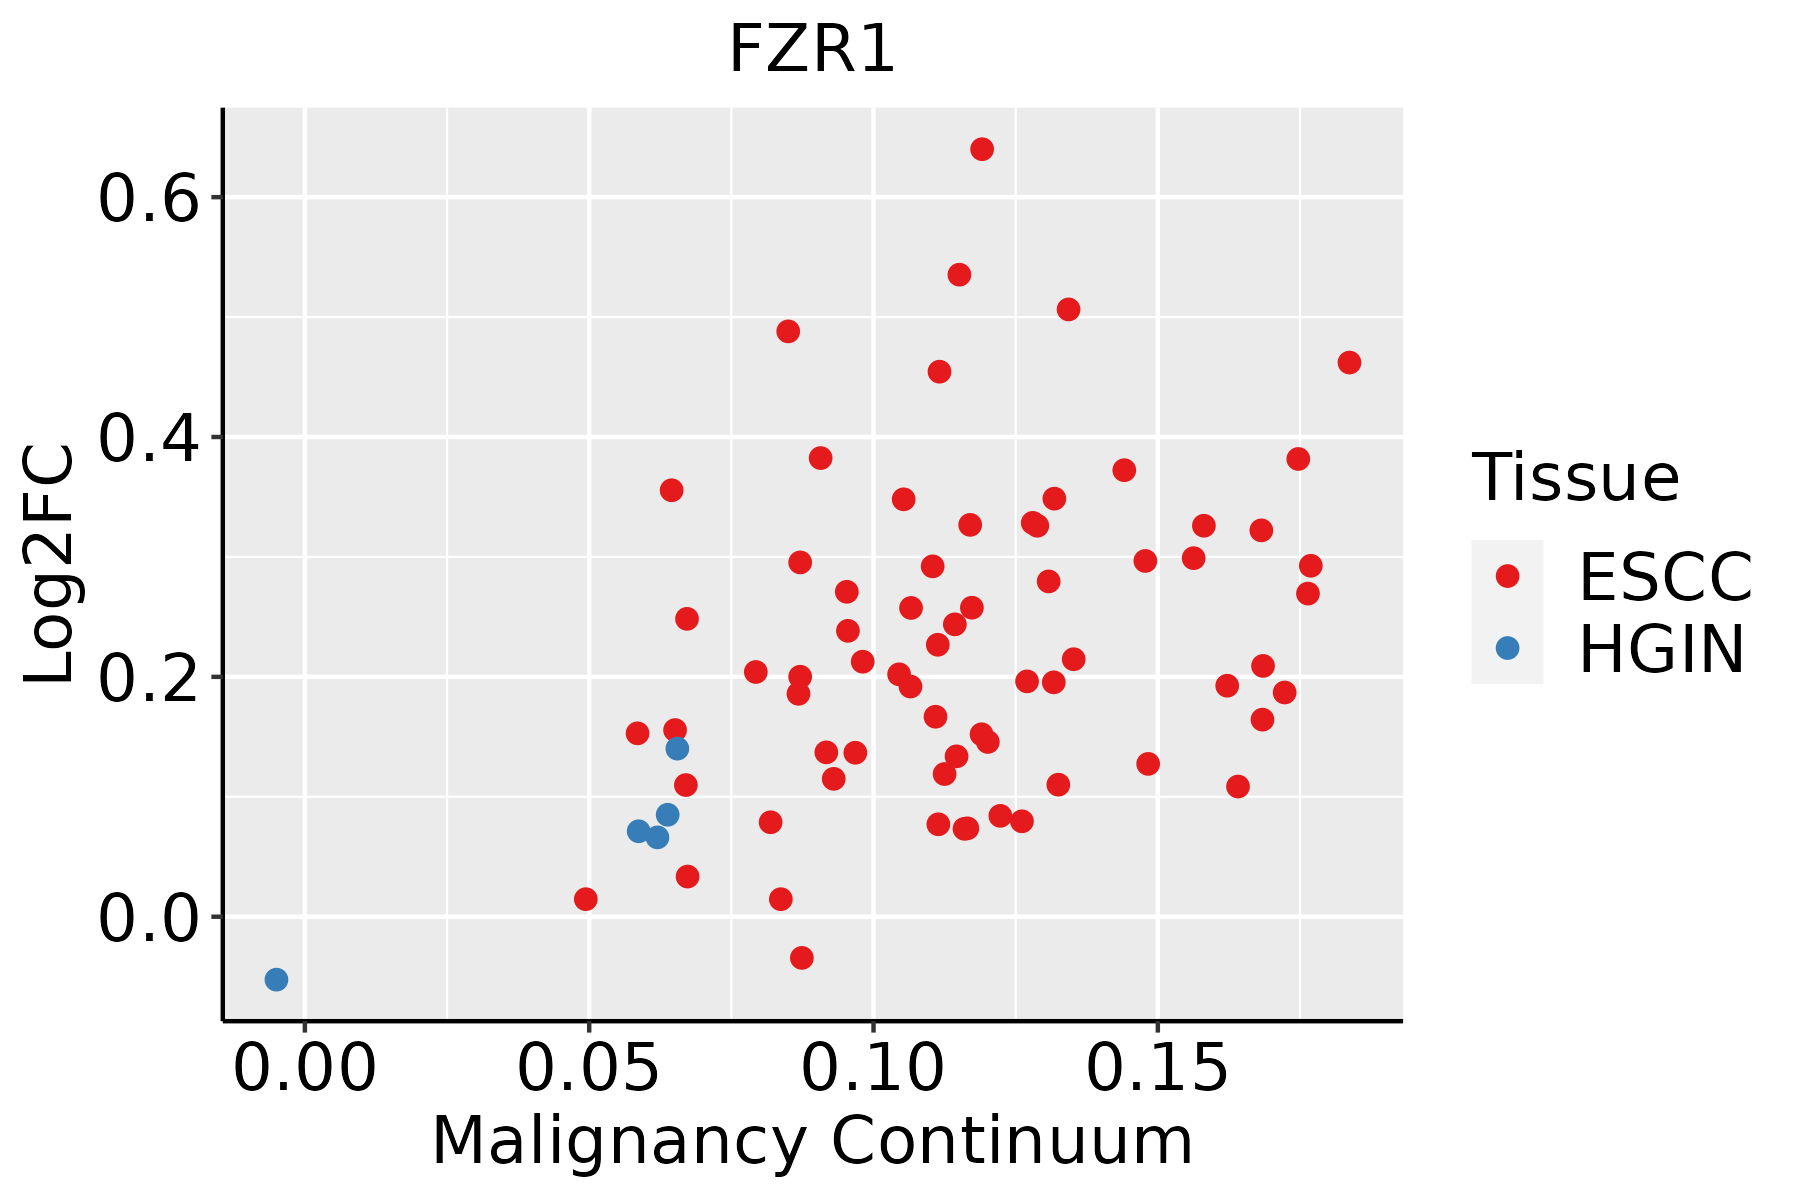 | ESCC: Esophageal squamous cell carcinoma |
| HGIN: High-grade intraepithelial neoplasias | ||
| LGIN: Low-grade intraepithelial neoplasias | ||
| Oral Cavity |  | EOLP: Erosive Oral lichen planus |
| LP: leukoplakia | ||
| NEOLP: Non-erosive oral lichen planus | ||
| OSCC: Oral squamous cell carcinoma | ||
| Thyroid | 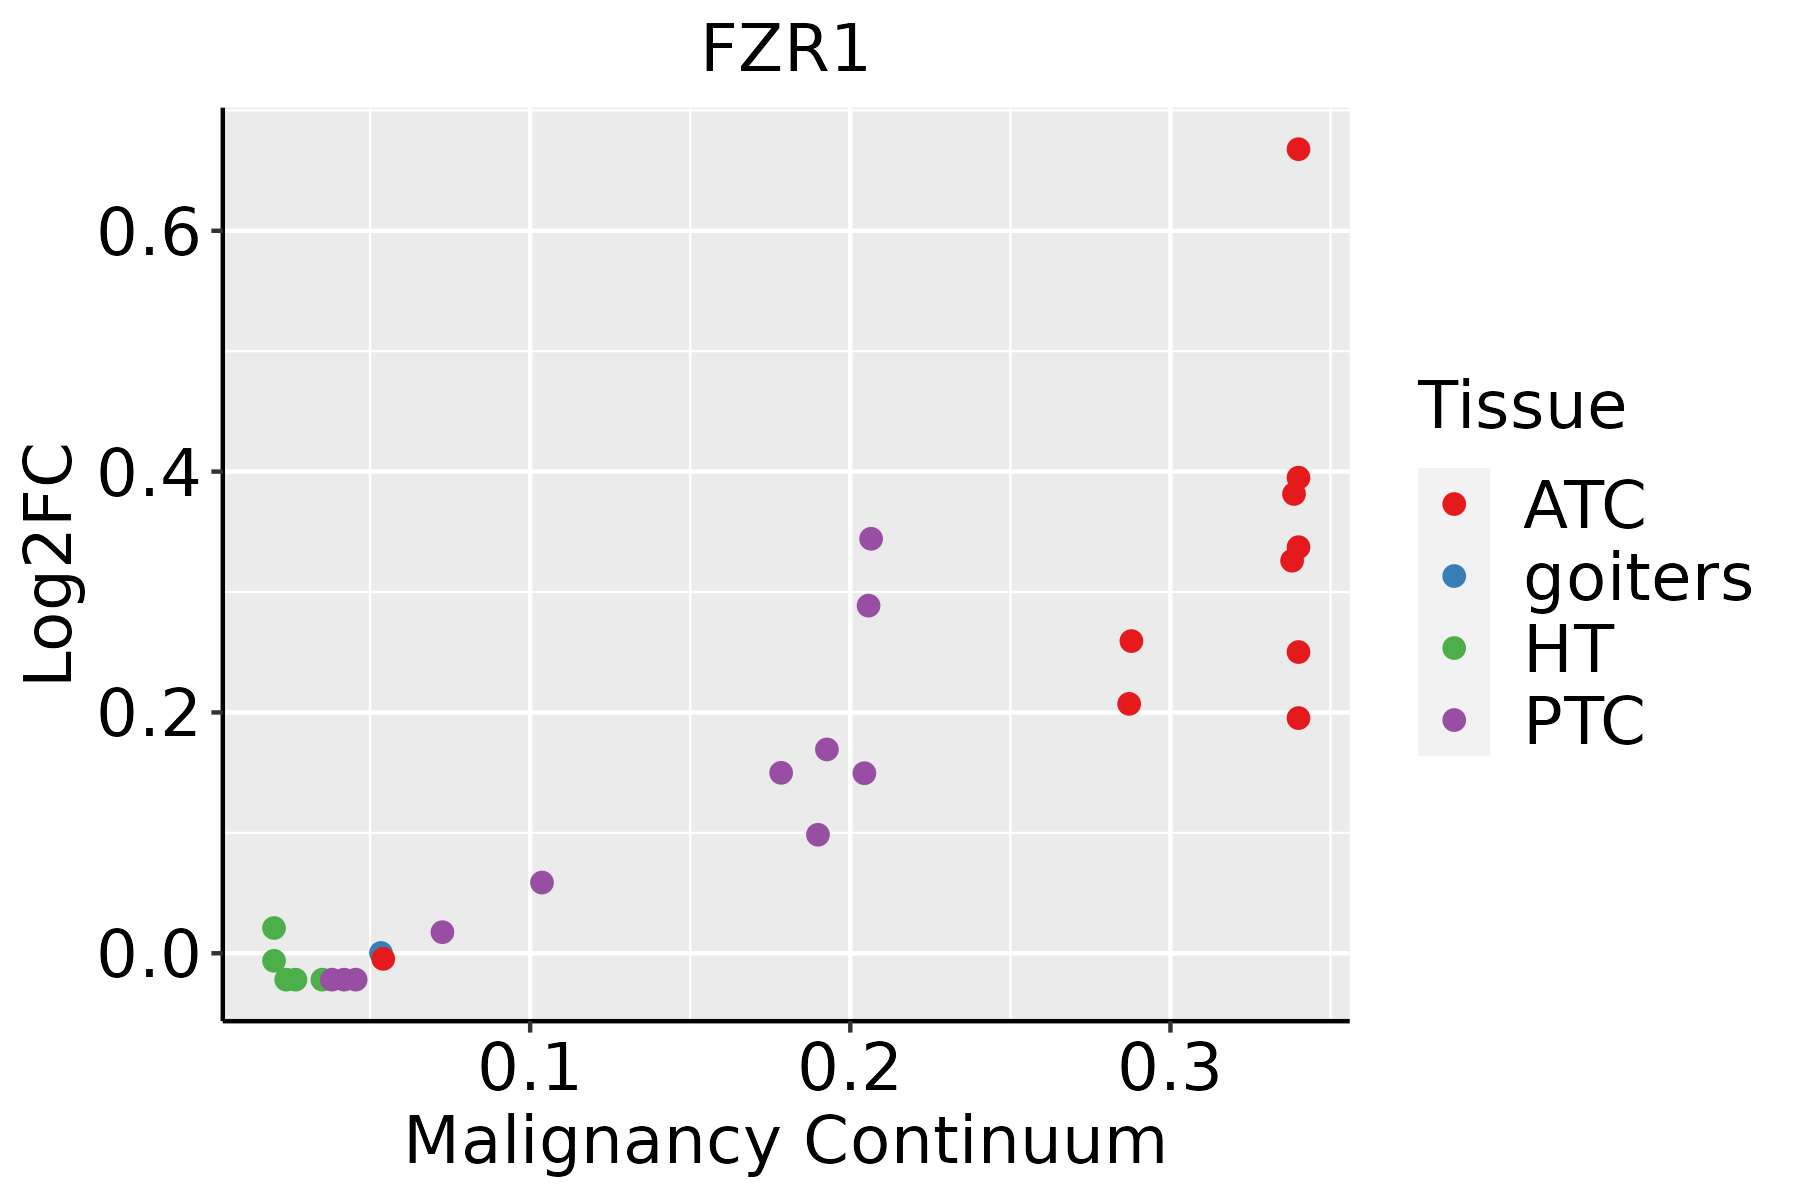 | ATC: Anaplastic thyroid cancer |
| HT: Hashimoto's thyroiditis | ||
| PTC: Papillary thyroid cancer |
| ∗log2FC in expression of this searched gene in stem-like cells from each diseased tissue sample relative to stem-like cells in normal samples in each tissue plotted against the malignancy continuum. Samples are colored based on if they are from different disease stage. |
Top |
Malignant transformation related pathway analysis |
| Find out the enriched GO biological processes and KEGG pathways involved in transition from healthy to precancer to cancer |
| Tissue | Disease Stage | Enriched GO biological Processes |
| Colorectum | AD |  |
| Colorectum | SER |  |
| Colorectum | MSS |  |
| Colorectum | MSI-H |  |
| Colorectum | FAP |  |
| ∗Top 15 enriched GO BP terms are showed in the bar plot of each disease state in each tissue. Each row represents a significant GO biological process which is colored according to the -log10(p.adjust). |
| Page: 1 2 3 4 5 6 7 8 9 |
| GO ID | Tissue | Disease Stage | Description | Gene Ratio | Bg Ratio | pvalue | p.adjust | Count |
| GO:190466634 | Thyroid | ATC | regulation of ubiquitin protein ligase activity | 19/6293 | 23/18723 | 1.89e-06 | 2.29e-05 | 19 |
| GO:000709312 | Thyroid | ATC | mitotic cell cycle checkpoint | 69/6293 | 129/18723 | 2.52e-06 | 2.96e-05 | 69 |
| GO:000008612 | Thyroid | ATC | G2/M transition of mitotic cell cycle | 72/6293 | 137/18723 | 3.61e-06 | 4.03e-05 | 72 |
| GO:000007513 | Thyroid | ATC | cell cycle checkpoint | 84/6293 | 169/18723 | 1.05e-05 | 1.04e-04 | 84 |
| GO:001094813 | Thyroid | ATC | negative regulation of cell cycle process | 134/6293 | 294/18723 | 1.19e-05 | 1.15e-04 | 134 |
| GO:004483912 | Thyroid | ATC | cell cycle G2/M phase transition | 75/6293 | 148/18723 | 1.28e-05 | 1.24e-04 | 75 |
| GO:190198813 | Thyroid | ATC | negative regulation of cell cycle phase transition | 116/6293 | 249/18723 | 1.33e-05 | 1.27e-04 | 116 |
| GO:007097913 | Thyroid | ATC | protein K11-linked ubiquitination | 20/6293 | 29/18723 | 1.06e-04 | 7.60e-04 | 20 |
| GO:001038911 | Thyroid | ATC | regulation of G2/M transition of mitotic cell cycle | 49/6293 | 94/18723 | 1.60e-04 | 1.10e-03 | 49 |
| GO:00514435 | Thyroid | ATC | positive regulation of ubiquitin-protein transferase activity | 20/6293 | 31/18723 | 4.20e-04 | 2.51e-03 | 20 |
| GO:190274911 | Thyroid | ATC | regulation of cell cycle G2/M phase transition | 51/6293 | 102/18723 | 4.45e-04 | 2.64e-03 | 51 |
| GO:000709511 | Thyroid | ATC | mitotic G2 DNA damage checkpoint | 21/6293 | 34/18723 | 7.12e-04 | 4.00e-03 | 21 |
| GO:009034211 | Thyroid | ATC | regulation of cell aging | 33/6293 | 61/18723 | 7.76e-04 | 4.28e-03 | 33 |
| GO:004477313 | Thyroid | ATC | mitotic DNA damage checkpoint | 40/6293 | 81/18723 | 2.36e-03 | 1.10e-02 | 40 |
| GO:000007712 | Thyroid | ATC | DNA damage checkpoint | 53/6293 | 115/18723 | 3.59e-03 | 1.58e-02 | 53 |
| GO:004477411 | Thyroid | ATC | mitotic DNA integrity checkpoint | 41/6293 | 85/18723 | 3.62e-03 | 1.58e-02 | 41 |
| GO:190275011 | Thyroid | ATC | negative regulation of cell cycle G2/M phase transition | 31/6293 | 62/18723 | 5.52e-03 | 2.24e-02 | 31 |
| GO:001097211 | Thyroid | ATC | negative regulation of G2/M transition of mitotic cell cycle | 30/6293 | 60/18723 | 6.27e-03 | 2.50e-02 | 30 |
| GO:00315707 | Thyroid | ATC | DNA integrity checkpoint | 55/6293 | 123/18723 | 6.64e-03 | 2.65e-02 | 55 |
| GO:00448182 | Thyroid | ATC | mitotic G2/M transition checkpoint | 24/6293 | 46/18723 | 7.13e-03 | 2.82e-02 | 24 |
| Page: 1 2 3 4 5 6 7 8 9 10 11 12 |
| Pathway ID | Tissue | Disease Stage | Description | Gene Ratio | Bg Ratio | pvalue | p.adjust | qvalue | Count |
| hsa0412027 | Esophagus | ESCC | Ubiquitin mediated proteolysis | 122/4205 | 142/8465 | 6.53e-20 | 7.29e-18 | 3.74e-18 | 122 |
| hsa0411023 | Esophagus | ESCC | Cell cycle | 126/4205 | 157/8465 | 1.34e-15 | 5.60e-14 | 2.87e-14 | 126 |
| hsa0412036 | Esophagus | ESCC | Ubiquitin mediated proteolysis | 122/4205 | 142/8465 | 6.53e-20 | 7.29e-18 | 3.74e-18 | 122 |
| hsa0411033 | Esophagus | ESCC | Cell cycle | 126/4205 | 157/8465 | 1.34e-15 | 5.60e-14 | 2.87e-14 | 126 |
| hsa041108 | Oral cavity | OSCC | Cell cycle | 118/3704 | 157/8465 | 7.15e-16 | 2.66e-14 | 1.35e-14 | 118 |
| hsa0412020 | Oral cavity | OSCC | Ubiquitin mediated proteolysis | 105/3704 | 142/8465 | 1.83e-13 | 4.37e-12 | 2.23e-12 | 105 |
| hsa0411015 | Oral cavity | OSCC | Cell cycle | 118/3704 | 157/8465 | 7.15e-16 | 2.66e-14 | 1.35e-14 | 118 |
| hsa04120110 | Oral cavity | OSCC | Ubiquitin mediated proteolysis | 105/3704 | 142/8465 | 1.83e-13 | 4.37e-12 | 2.23e-12 | 105 |
| Page: 1 |
Top |
Cell-cell communication analysis |
| Identification of potential cell-cell interactions between two cell types and their ligand-receptor pairs for different disease states |
| Ligand | Receptor | LRpair | Pathway | Tissue | Disease Stage |
| Page: 1 |
Top |
Single-cell gene regulatory network inference analysis |
| Find out the significant the regulons (TFs) and the target genes of each regulon across cell types for different disease states |
| TF | Cell Type | Tissue | Disease Stage | Target Gene | RSS | Regulon Activity |
| ∗The dot plots of a searched regulon are shown for all cell subpopulations in each disease state of each tissue based on the regulon specific score inferred using pySCENIC and by calculating the average expression. |
| Page: 1 |
Top |
Somatic mutation of malignant transformation related genes |
| Annotation of somatic variants for genes involved in malignant transformation |
| Hugo Symbol | Variant Class | Variant Classification | dbSNP RS | HGVSc | HGVSp | HGVSp Short | SWISSPROT | BIOTYPE | SIFT | PolyPhen | Tumor Sample Barcode | Tissue | Histology | Sex | Age | Stage | Therapy Types | Drugs | Outcome |
| FZR1 | SNV | Missense_Mutation | novel | c.668N>A | p.Cys223Tyr | p.C223Y | Q9UM11 | protein_coding | deleterious(0) | probably_damaging(0.95) | TCGA-E2-A14N-01 | Breast | breast invasive carcinoma | Female | <65 | I/II | Chemotherapy | cyclophosphamide | SD |
| FZR1 | deletion | Frame_Shift_Del | c.1328delN | p.Tyr444ThrfsTer24 | p.Y444Tfs*24 | Q9UM11 | protein_coding | TCGA-EW-A2FV-01 | Breast | breast invasive carcinoma | Female | <65 | III/IV | Chemotherapy | docetaxel | SD | |||
| FZR1 | SNV | Missense_Mutation | novel | c.823N>A | p.Gly275Arg | p.G275R | Q9UM11 | protein_coding | deleterious(0) | probably_damaging(0.993) | TCGA-2W-A8YY-01 | Cervix | cervical & endocervical cancer | Female | <65 | I/II | Chemotherapy | cisplatin | CR |
| FZR1 | SNV | Missense_Mutation | c.1135N>C | p.Asp379His | p.D379H | Q9UM11 | protein_coding | deleterious(0) | probably_damaging(0.998) | TCGA-DG-A2KL-01 | Cervix | cervical & endocervical cancer | Female | <65 | I/II | Chemotherapy | cisplatin | SD | |
| FZR1 | SNV | Missense_Mutation | c.313N>A | p.Glu105Lys | p.E105K | Q9UM11 | protein_coding | tolerated(0.33) | benign(0.015) | TCGA-EK-A2RN-01 | Cervix | cervical & endocervical cancer | Female | <65 | I/II | Unknown | Unknown | SD | |
| FZR1 | SNV | Missense_Mutation | c.661N>T | p.Arg221Trp | p.R221W | Q9UM11 | protein_coding | deleterious(0) | probably_damaging(0.978) | TCGA-A6-5661-01 | Colorectum | colon adenocarcinoma | Female | >=65 | I/II | Unknown | Unknown | SD | |
| FZR1 | SNV | Missense_Mutation | rs754635012 | c.778G>A | p.Ala260Thr | p.A260T | Q9UM11 | protein_coding | tolerated(0.39) | benign(0.006) | TCGA-AA-3947-01 | Colorectum | colon adenocarcinoma | Female | <65 | I/II | Unknown | Unknown | SD |
| FZR1 | SNV | Missense_Mutation | rs760461120 | c.494N>A | p.Arg165Gln | p.R165Q | Q9UM11 | protein_coding | tolerated(0.16) | benign(0.006) | TCGA-AZ-6601-01 | Colorectum | colon adenocarcinoma | Male | >=65 | I/II | Unknown | Unknown | PD |
| FZR1 | SNV | Missense_Mutation | c.718C>T | p.Arg240Trp | p.R240W | Q9UM11 | protein_coding | deleterious(0) | probably_damaging(0.981) | TCGA-CM-6171-01 | Colorectum | colon adenocarcinoma | Female | >=65 | I/II | Unknown | Unknown | SD | |
| FZR1 | SNV | Missense_Mutation | c.1466T>A | p.Leu489His | p.L489H | Q9UM11 | protein_coding | deleterious(0) | probably_damaging(0.993) | TCGA-F4-6463-01 | Colorectum | colon adenocarcinoma | Male | <65 | I/II | Unknown | Unknown | SD |
| Page: 1 2 3 4 5 6 7 |
Top |
Related drugs of malignant transformation related genes |
| Identification of chemicals and drugs interact with genes involved in malignant transfromation |
| (DGIdb 4.0) |
| Entrez ID | Symbol | Category | Interaction Types | Drug Claim Name | Drug Name | PMIDs |
| Page: 1 |

Copyright 2023-Present -The University of Texas Health Science Center at Houston |