
|
|||||
|
 | |
| |
| |
| |
| |
| |
|
Gene: FTO |
Gene summary for FTO |
| Gene information | Species | Human | Gene symbol | FTO | Gene ID | 79068 |
| Gene name | FTO alpha-ketoglutarate dependent dioxygenase | |
| Gene Alias | ALKBH9 | |
| Cytomap | 16q12.2 | |
| Gene Type | protein-coding | GO ID | GO:0001659 | UniProtAcc | B3KU60 |
Top |
Malignant transformation analysis |
| Identification of the aberrant gene expression in precancerous and cancerous lesions by comparing the gene expression of stem-like cells in diseased tissues with normal stem cells |
| Entrez ID | Symbol | Replicates | Species | Organ | Tissue | Adj P-value | Log2FC | Malignancy |
| 79068 | FTO | CCI_1 | Human | Cervix | CC | 1.46e-06 | 7.90e-01 | 0.528 |
| 79068 | FTO | CCI_2 | Human | Cervix | CC | 3.07e-02 | 5.72e-01 | 0.5249 |
| 79068 | FTO | CCI_3 | Human | Cervix | CC | 6.36e-12 | 7.49e-01 | 0.516 |
| 79068 | FTO | HTA11_3410_2000001011 | Human | Colorectum | AD | 1.69e-13 | -4.22e-01 | 0.0155 |
| 79068 | FTO | HTA11_696_2000001011 | Human | Colorectum | AD | 3.12e-03 | -2.62e-01 | -0.1464 |
| 79068 | FTO | HTA11_866_2000001011 | Human | Colorectum | AD | 1.92e-04 | -3.28e-01 | -0.1001 |
| 79068 | FTO | HTA11_5212_2000001011 | Human | Colorectum | AD | 1.03e-03 | -6.56e-01 | -0.2061 |
| 79068 | FTO | HTA11_866_3004761011 | Human | Colorectum | AD | 1.26e-05 | -4.47e-01 | 0.096 |
| 79068 | FTO | HTA11_7696_3000711011 | Human | Colorectum | AD | 2.55e-02 | -2.66e-01 | 0.0674 |
| 79068 | FTO | HTA11_99999970781_79442 | Human | Colorectum | MSS | 1.67e-09 | -4.28e-01 | 0.294 |
| 79068 | FTO | HTA11_99999974143_84620 | Human | Colorectum | MSS | 2.13e-13 | -5.19e-01 | 0.3005 |
| 79068 | FTO | F007 | Human | Colorectum | FAP | 1.68e-03 | -2.24e-01 | 0.1176 |
| 79068 | FTO | A001-C-207 | Human | Colorectum | FAP | 7.55e-06 | -3.41e-01 | 0.1278 |
| 79068 | FTO | A015-C-203 | Human | Colorectum | FAP | 1.26e-39 | -5.08e-01 | -0.1294 |
| 79068 | FTO | A015-C-204 | Human | Colorectum | FAP | 2.92e-11 | -4.19e-01 | -0.0228 |
| 79068 | FTO | A014-C-040 | Human | Colorectum | FAP | 3.24e-05 | -5.00e-01 | -0.1184 |
| 79068 | FTO | A002-C-201 | Human | Colorectum | FAP | 4.55e-19 | -5.12e-01 | 0.0324 |
| 79068 | FTO | A002-C-203 | Human | Colorectum | FAP | 6.87e-05 | -1.40e-01 | 0.2786 |
| 79068 | FTO | A001-C-119 | Human | Colorectum | FAP | 2.38e-08 | -4.95e-01 | -0.1557 |
| 79068 | FTO | A001-C-108 | Human | Colorectum | FAP | 3.83e-26 | -4.26e-01 | -0.0272 |
| Page: 1 2 3 4 5 6 7 8 |
| Tissue | Expression Dynamics | Abbreviation |
| Cervix | 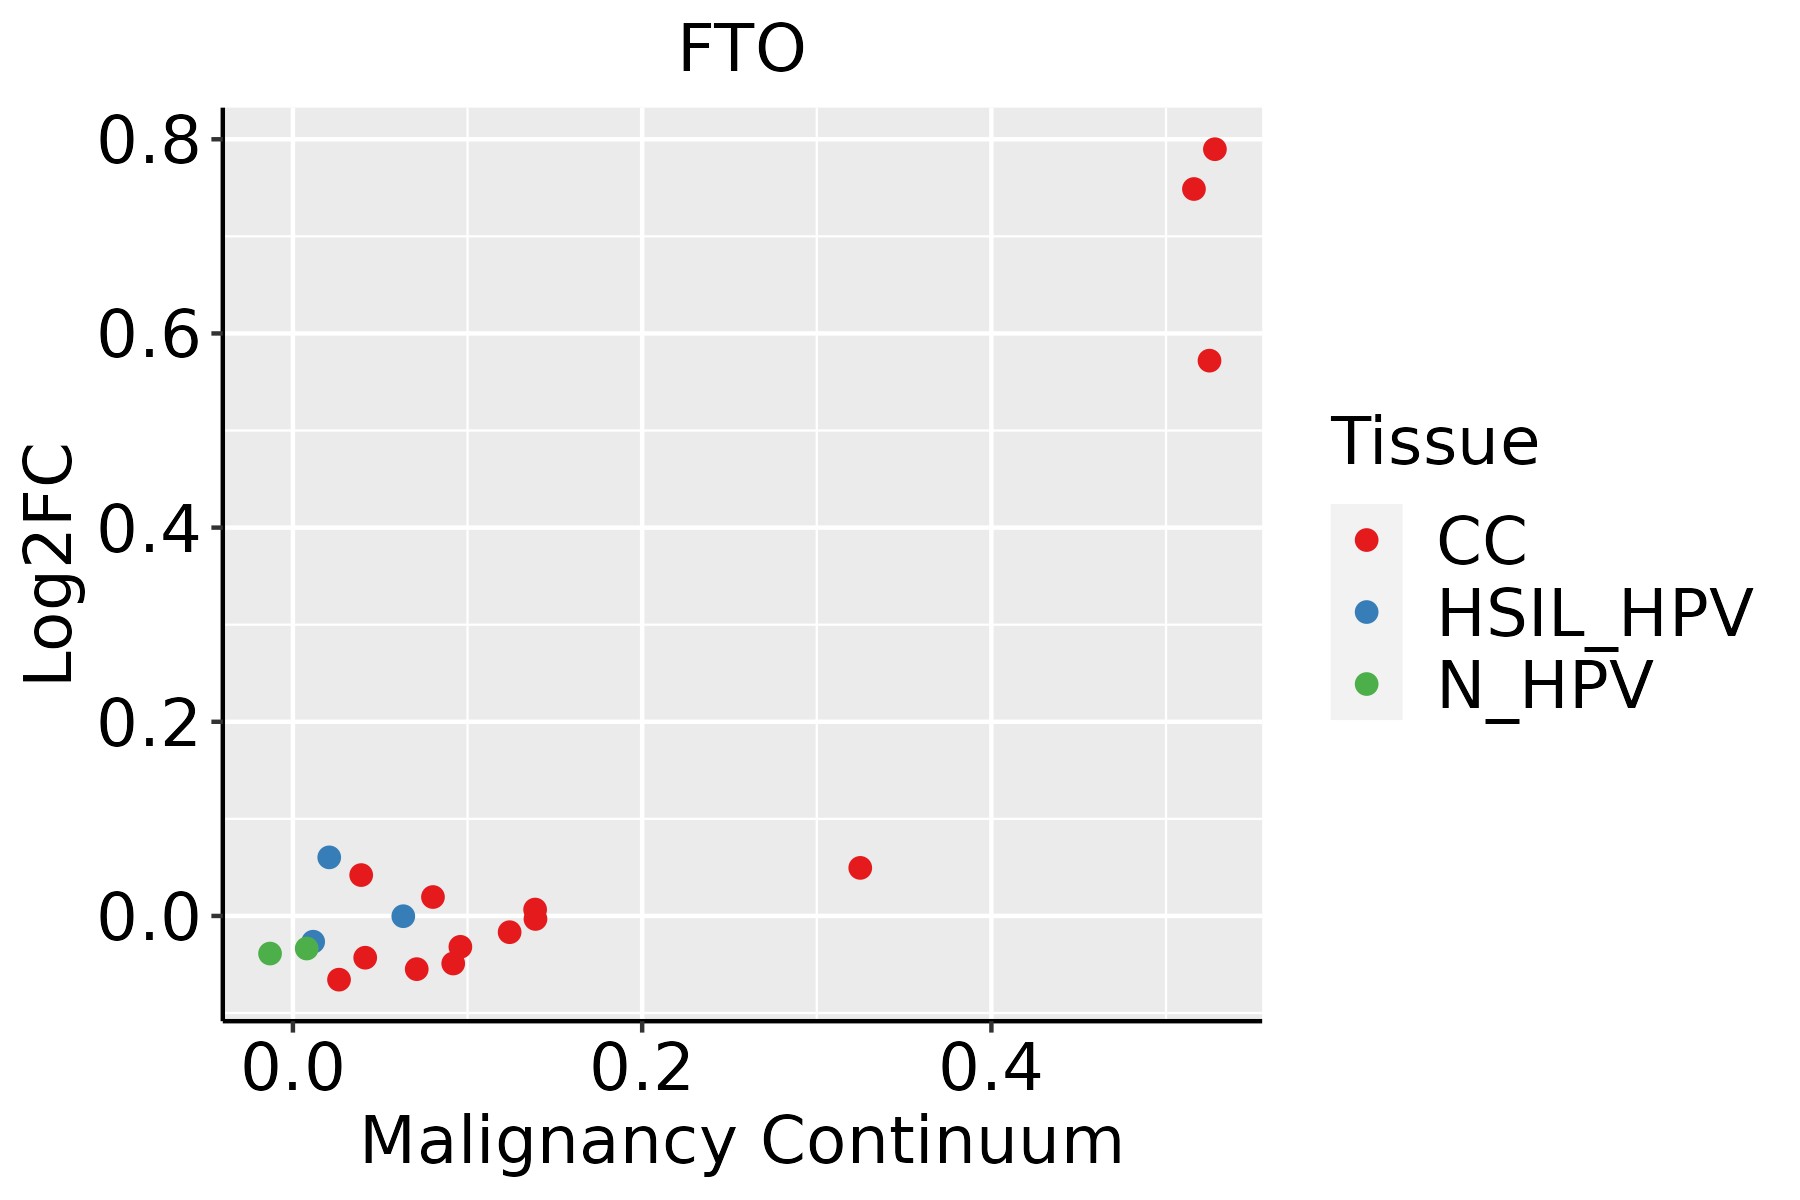 | CC: Cervix cancer |
| HSIL_HPV: HPV-infected high-grade squamous intraepithelial lesions | ||
| N_HPV: HPV-infected normal cervix | ||
| Colorectum (GSE201348) |  | FAP: Familial adenomatous polyposis |
| CRC: Colorectal cancer | ||
| Colorectum (HTA11) |  | AD: Adenomas |
| SER: Sessile serrated lesions | ||
| MSI-H: Microsatellite-high colorectal cancer | ||
| MSS: Microsatellite stable colorectal cancer | ||
| Endometrium | 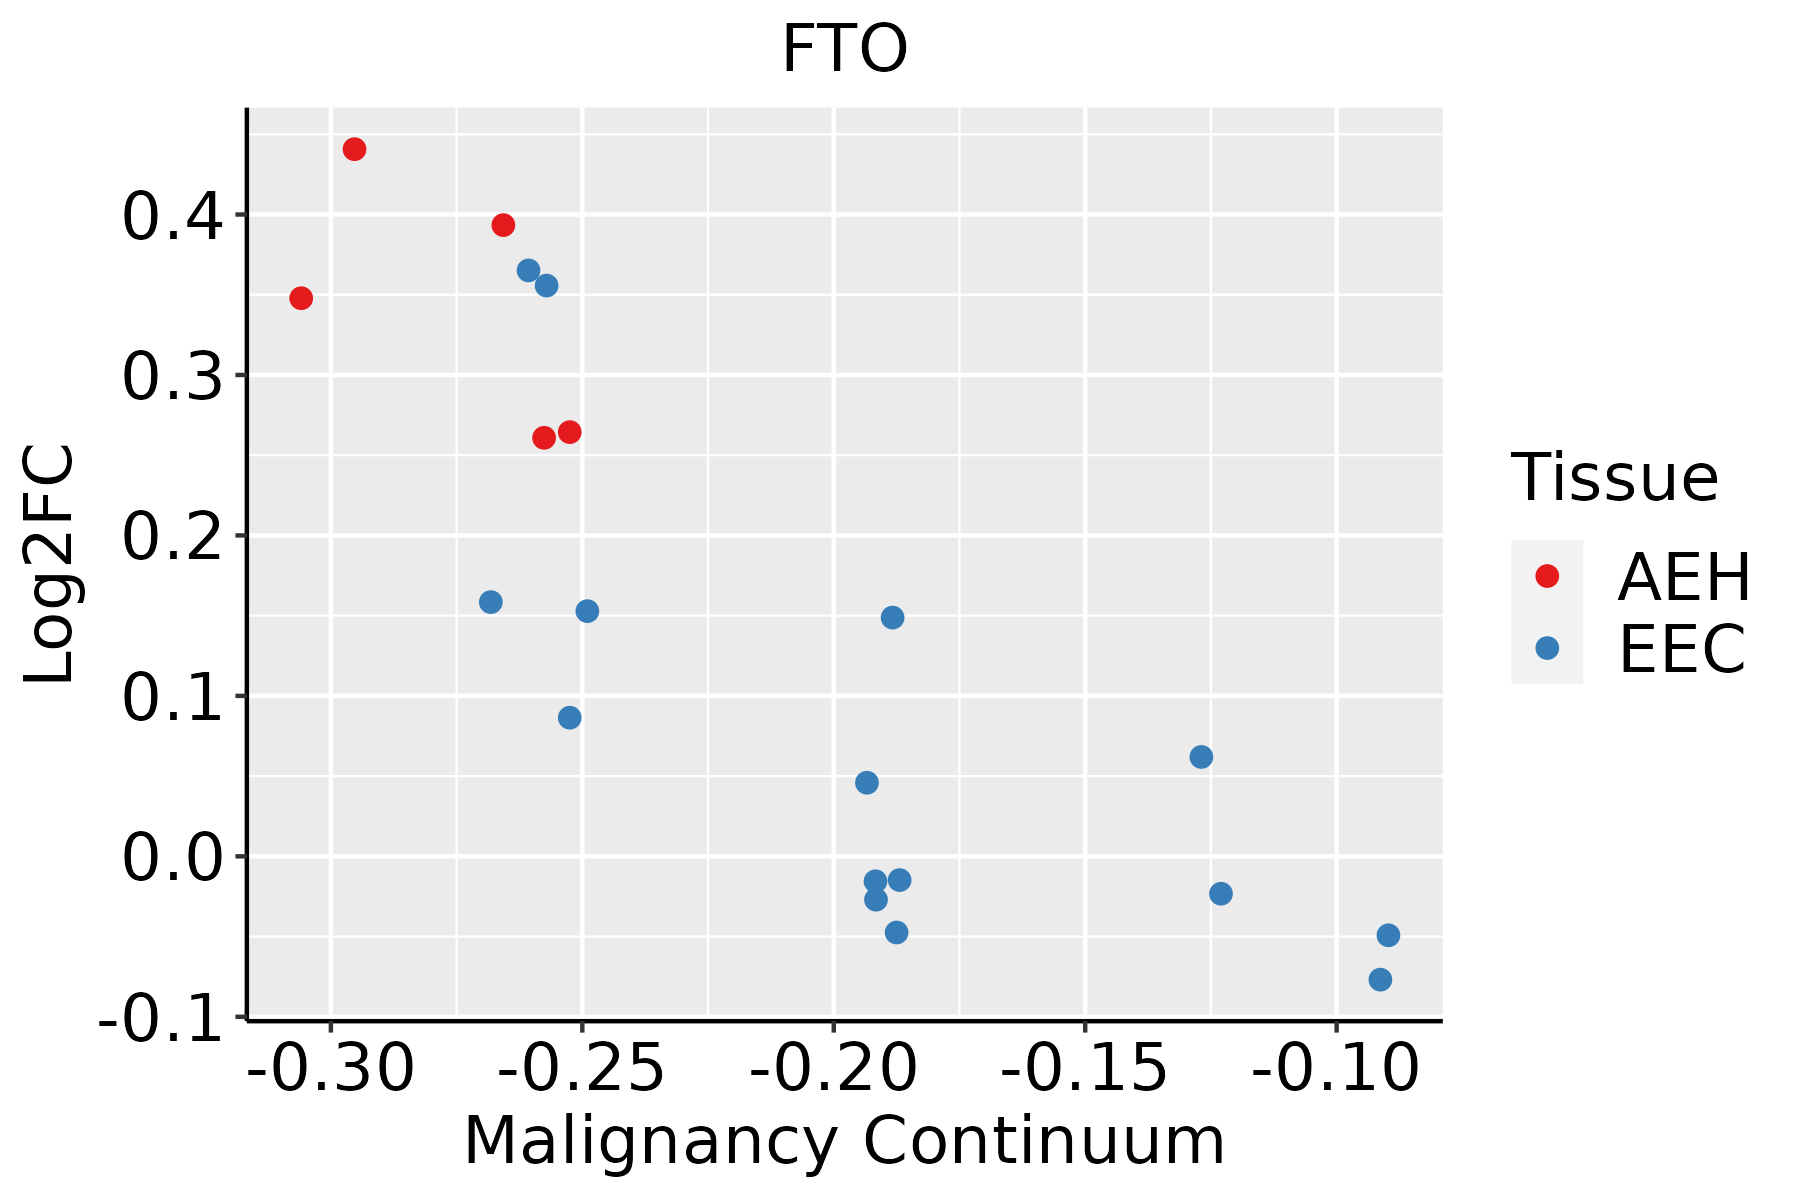 | AEH: Atypical endometrial hyperplasia |
| EEC: Endometrioid Cancer | ||
| Esophagus | 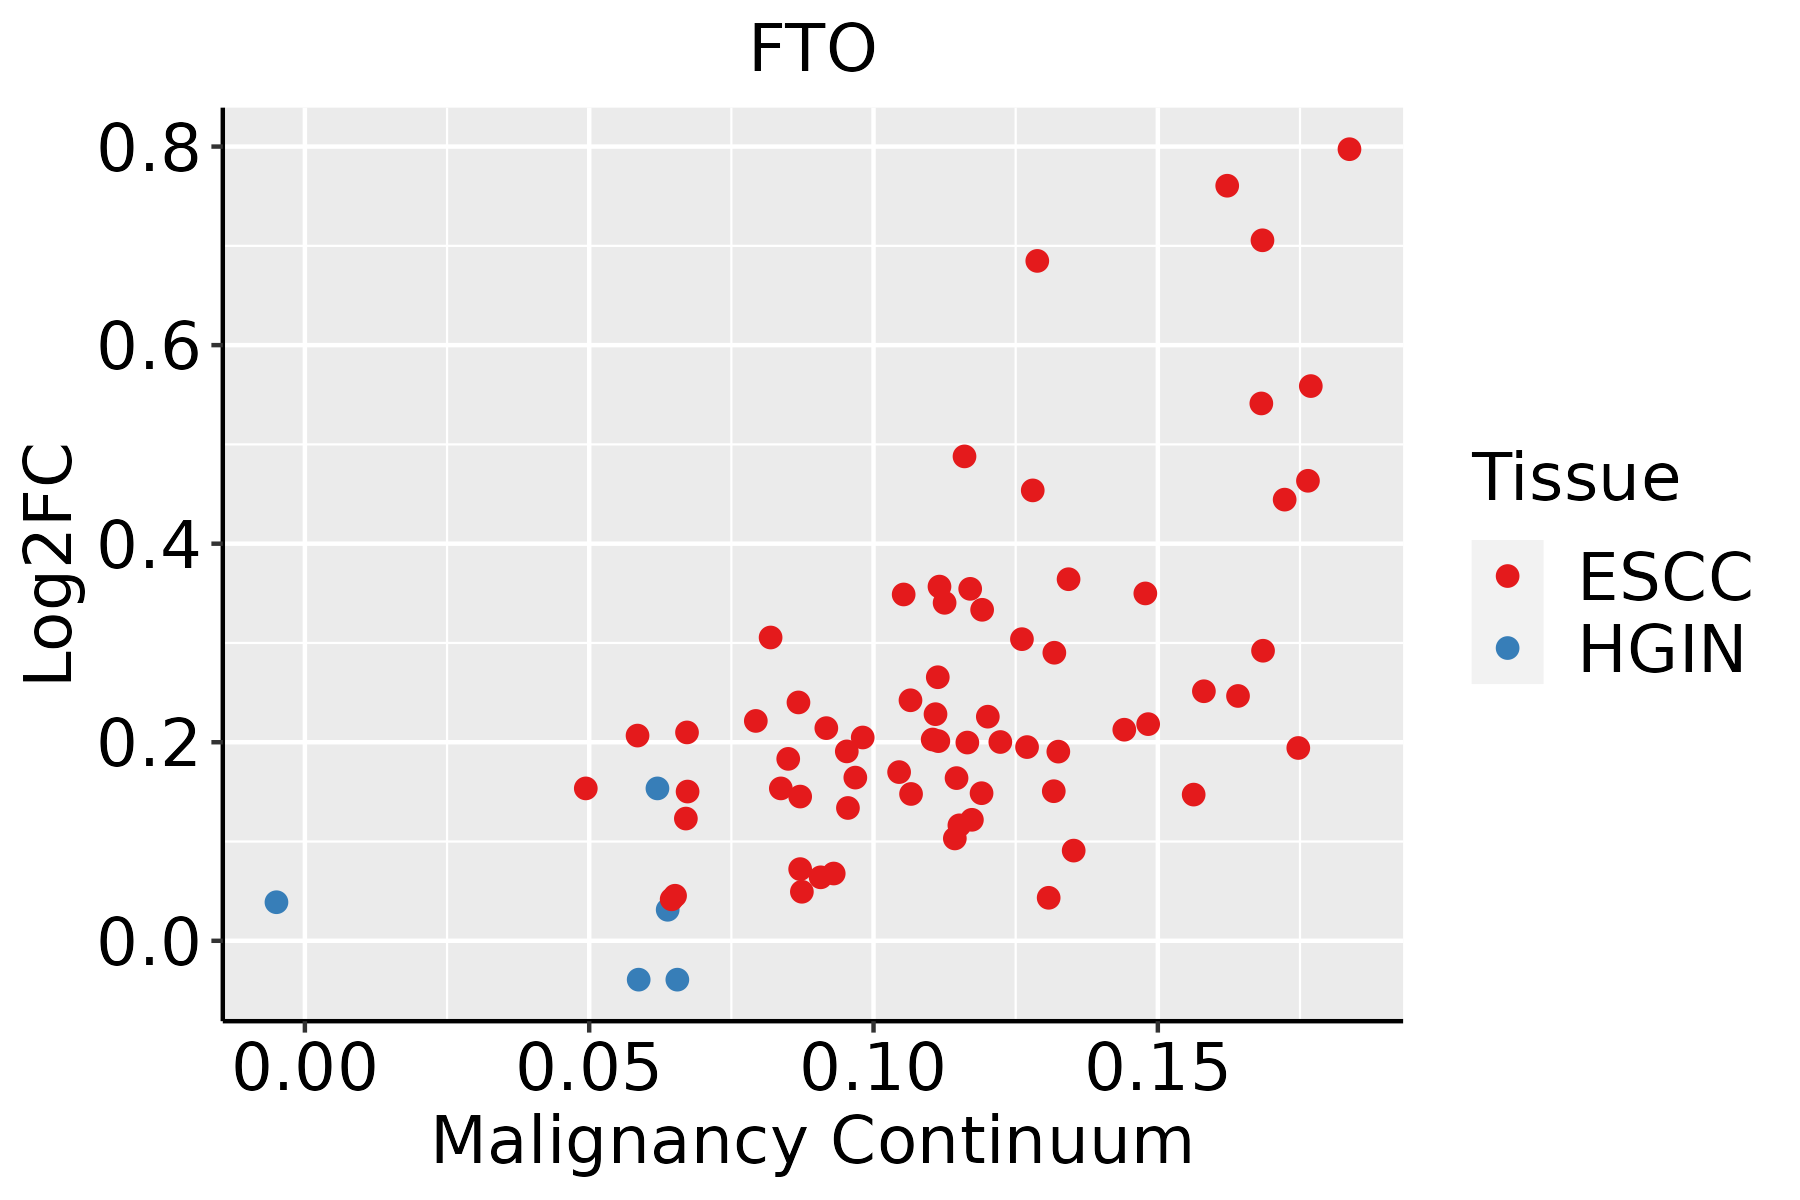 | ESCC: Esophageal squamous cell carcinoma |
| HGIN: High-grade intraepithelial neoplasias | ||
| LGIN: Low-grade intraepithelial neoplasias | ||
| Liver | 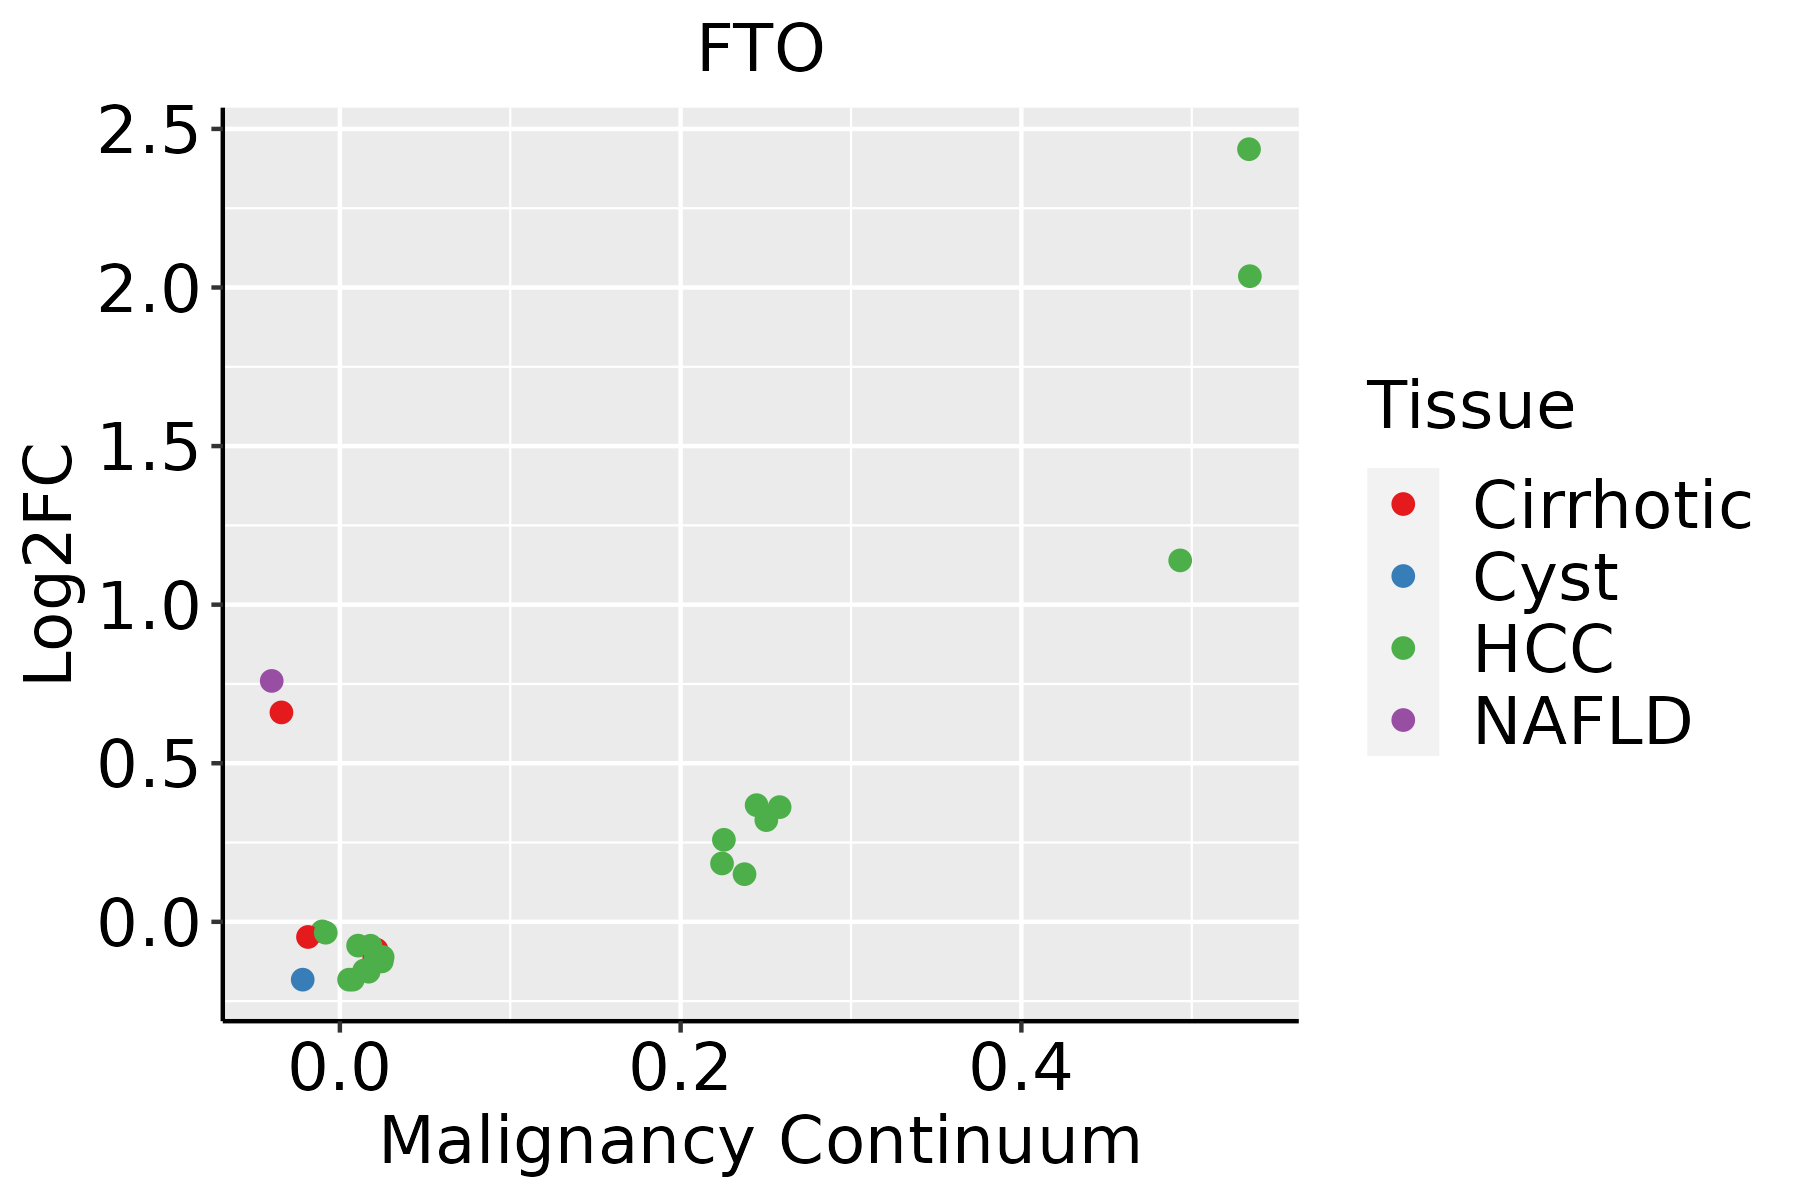 | HCC: Hepatocellular carcinoma |
| NAFLD: Non-alcoholic fatty liver disease | ||
| Lung | 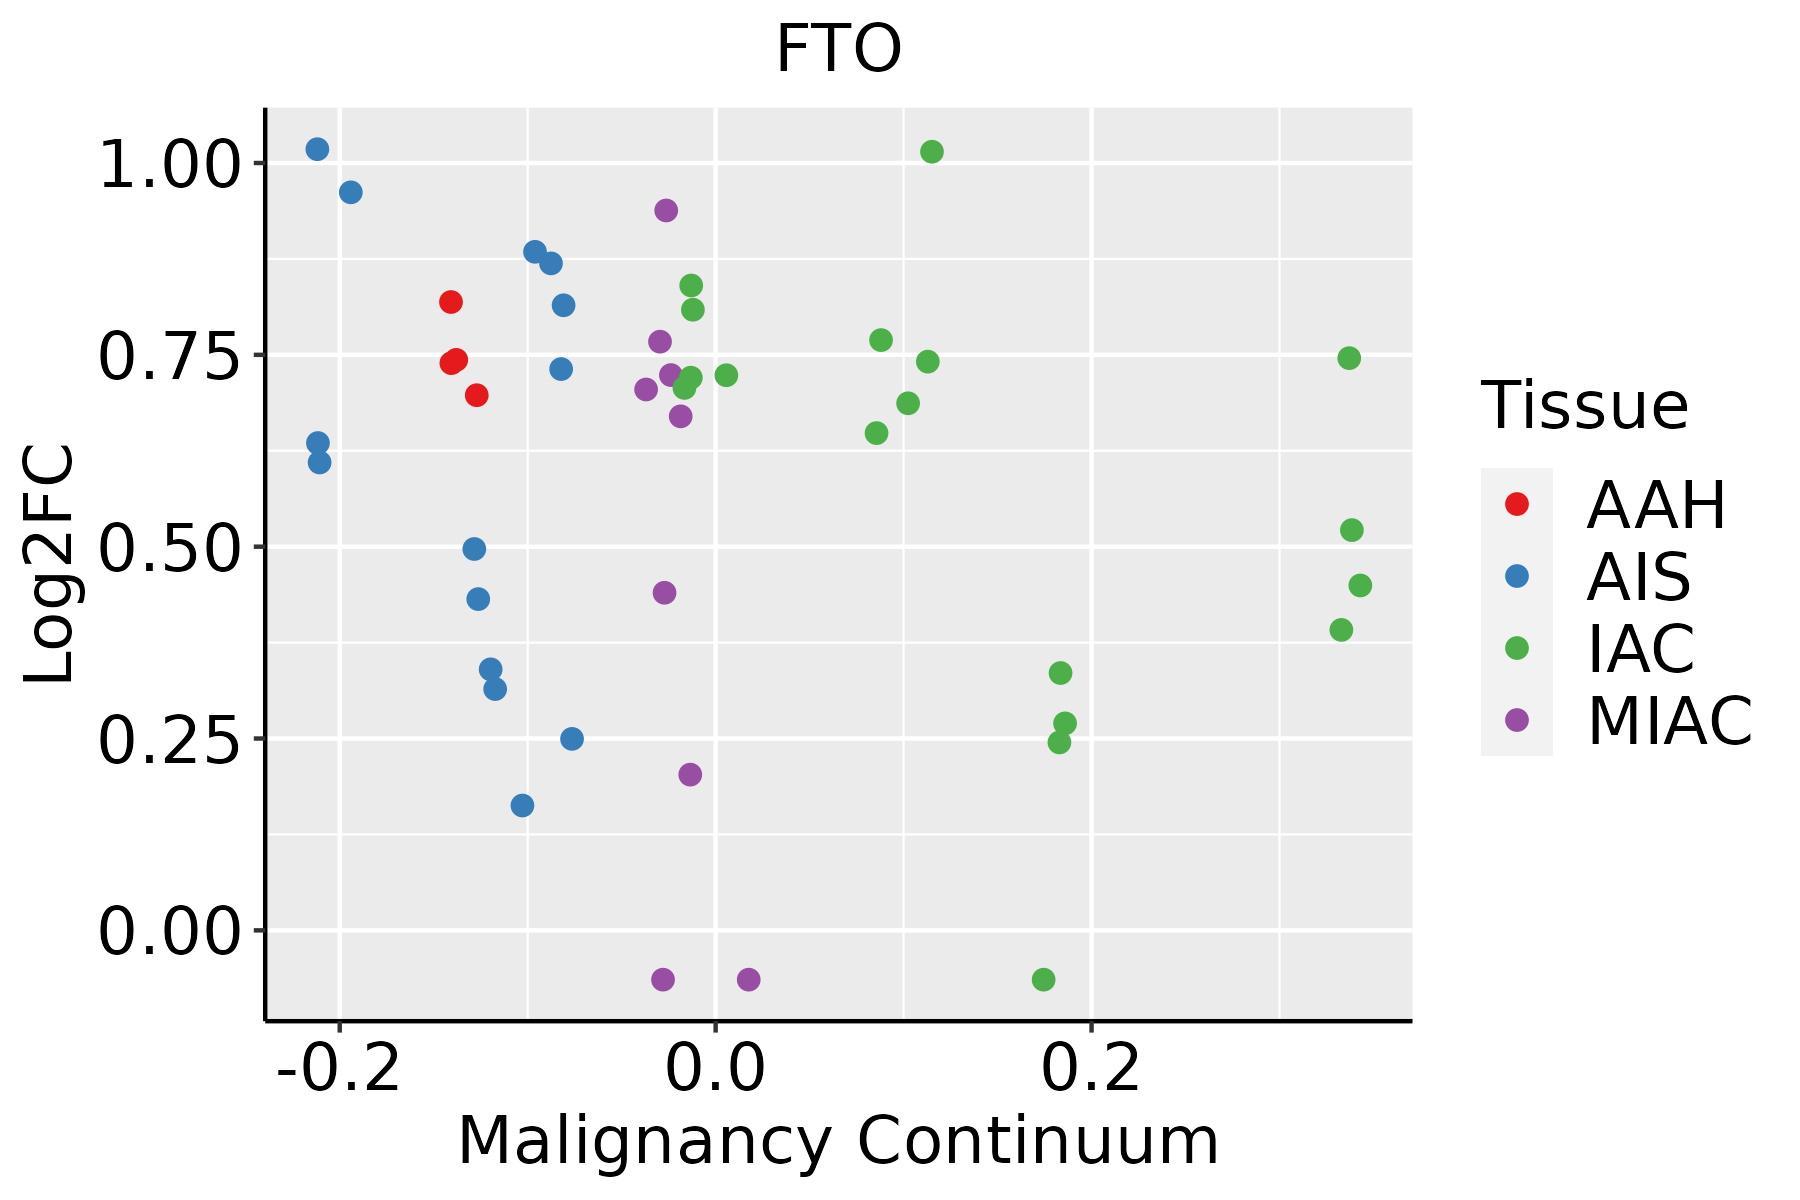 | AAH: Atypical adenomatous hyperplasia |
| AIS: Adenocarcinoma in situ | ||
| IAC: Invasive lung adenocarcinoma | ||
| MIA: Minimally invasive adenocarcinoma | ||
| Oral Cavity | 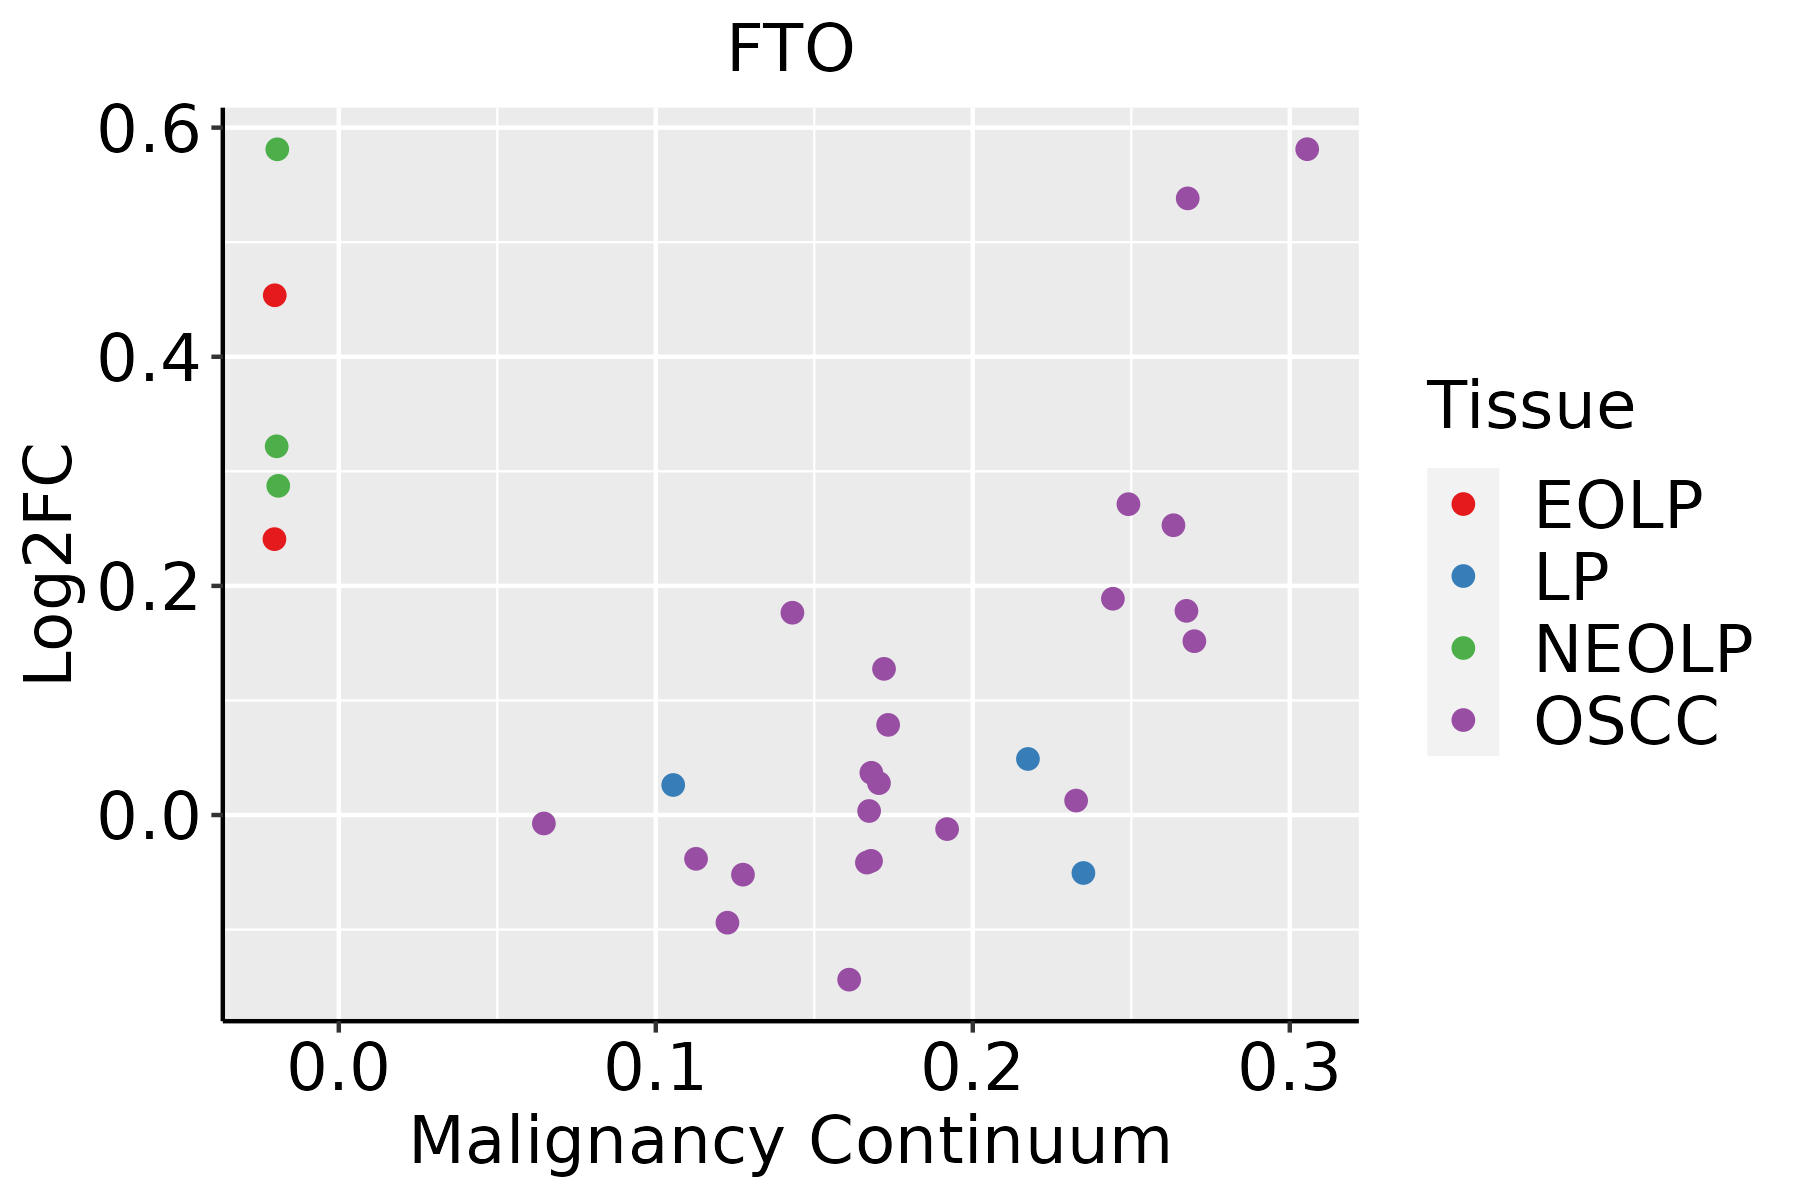 | EOLP: Erosive Oral lichen planus |
| LP: leukoplakia | ||
| NEOLP: Non-erosive oral lichen planus | ||
| OSCC: Oral squamous cell carcinoma |
| ∗log2FC in expression of this searched gene in stem-like cells from each diseased tissue sample relative to stem-like cells in normal samples in each tissue plotted against the malignancy continuum. Samples are colored based on if they are from different disease stage. |
Top |
Malignant transformation related pathway analysis |
| Find out the enriched GO biological processes and KEGG pathways involved in transition from healthy to precancer to cancer |
| Tissue | Disease Stage | Enriched GO biological Processes |
| Colorectum | AD |  |
| Colorectum | SER |  |
| Colorectum | MSS |  |
| Colorectum | MSI-H |  |
| Colorectum | FAP |  |
| ∗Top 15 enriched GO BP terms are showed in the bar plot of each disease state in each tissue. Each row represents a significant GO biological process which is colored according to the -log10(p.adjust). |
| Page: 1 2 3 4 5 6 7 8 9 |
| GO ID | Tissue | Disease Stage | Description | Gene Ratio | Bg Ratio | pvalue | p.adjust | Count |
| GO:00434886 | Liver | NAFLD | regulation of mRNA stability | 39/1882 | 158/18723 | 8.49e-08 | 7.09e-06 | 39 |
| GO:00434876 | Liver | NAFLD | regulation of RNA stability | 40/1882 | 170/18723 | 2.32e-07 | 1.58e-05 | 40 |
| GO:00108765 | Liver | NAFLD | lipid localization | 79/1882 | 448/18723 | 4.75e-07 | 2.92e-05 | 79 |
| GO:00610144 | Liver | NAFLD | positive regulation of mRNA catabolic process | 24/1882 | 87/18723 | 3.17e-06 | 1.27e-04 | 24 |
| GO:00611574 | Liver | NAFLD | mRNA destabilization | 23/1882 | 84/18723 | 5.79e-06 | 2.05e-04 | 23 |
| GO:19033134 | Liver | NAFLD | positive regulation of mRNA metabolic process | 28/1882 | 118/18723 | 1.21e-05 | 3.70e-04 | 28 |
| GO:00507794 | Liver | NAFLD | RNA destabilization | 23/1882 | 88/18723 | 1.34e-05 | 3.97e-04 | 23 |
| GO:00171483 | Liver | NAFLD | negative regulation of translation | 43/1882 | 245/18723 | 2.05e-04 | 3.56e-03 | 43 |
| GO:00352643 | Liver | NAFLD | multicellular organism growth | 27/1882 | 132/18723 | 2.57e-04 | 4.19e-03 | 27 |
| GO:00342493 | Liver | NAFLD | negative regulation of cellular amide metabolic process | 46/1882 | 273/18723 | 3.27e-04 | 5.04e-03 | 46 |
| GO:0019915 | Liver | NAFLD | lipid storage | 19/1882 | 87/18723 | 8.80e-04 | 1.07e-02 | 19 |
| GO:0010883 | Liver | NAFLD | regulation of lipid storage | 14/1882 | 57/18723 | 1.24e-03 | 1.41e-02 | 14 |
| GO:00512356 | Liver | NAFLD | maintenance of location | 50/1882 | 327/18723 | 1.75e-03 | 1.82e-02 | 50 |
| GO:0070988 | Liver | NAFLD | demethylation | 16/1882 | 73/18723 | 2.09e-03 | 2.06e-02 | 16 |
| GO:00016592 | Liver | NAFLD | temperature homeostasis | 29/1882 | 174/18723 | 4.48e-03 | 3.61e-02 | 29 |
| GO:00486384 | Liver | NAFLD | regulation of developmental growth | 48/1882 | 330/18723 | 5.74e-03 | 4.37e-02 | 48 |
| GO:000989612 | Liver | Cirrhotic | positive regulation of catabolic process | 215/4634 | 492/18723 | 1.13e-20 | 3.56e-18 | 215 |
| GO:190136111 | Liver | Cirrhotic | organic cyclic compound catabolic process | 213/4634 | 495/18723 | 1.58e-19 | 3.67e-17 | 213 |
| GO:003133112 | Liver | Cirrhotic | positive regulation of cellular catabolic process | 190/4634 | 427/18723 | 1.94e-19 | 4.18e-17 | 190 |
| GO:001943911 | Liver | Cirrhotic | aromatic compound catabolic process | 202/4634 | 467/18723 | 6.93e-19 | 1.28e-16 | 202 |
| Page: 1 2 3 4 5 6 7 8 9 10 11 12 13 14 15 16 17 18 19 20 21 |
| Pathway ID | Tissue | Disease Stage | Description | Gene Ratio | Bg Ratio | pvalue | p.adjust | qvalue | Count |
| Page: 1 |
Top |
Cell-cell communication analysis |
| Identification of potential cell-cell interactions between two cell types and their ligand-receptor pairs for different disease states |
| Ligand | Receptor | LRpair | Pathway | Tissue | Disease Stage |
| Page: 1 |
Top |
Single-cell gene regulatory network inference analysis |
| Find out the significant the regulons (TFs) and the target genes of each regulon across cell types for different disease states |
| TF | Cell Type | Tissue | Disease Stage | Target Gene | RSS | Regulon Activity |
| ∗The dot plots of a searched regulon are shown for all cell subpopulations in each disease state of each tissue based on the regulon specific score inferred using pySCENIC and by calculating the average expression. |
| Page: 1 |
Top |
Somatic mutation of malignant transformation related genes |
| Annotation of somatic variants for genes involved in malignant transformation |
| Hugo Symbol | Variant Class | Variant Classification | dbSNP RS | HGVSc | HGVSp | HGVSp Short | SWISSPROT | BIOTYPE | SIFT | PolyPhen | Tumor Sample Barcode | Tissue | Histology | Sex | Age | Stage | Therapy Types | Drugs | Outcome |
| FTO | SNV | Missense_Mutation | rs577569584 | c.559G>A | p.Gly187Arg | p.G187R | Q9C0B1 | protein_coding | tolerated(0.52) | benign(0.033) | TCGA-3C-AALI-01 | Breast | breast invasive carcinoma | Female | <65 | I/II | Unspecific | Poly E | Complete Response |
| FTO | SNV | Missense_Mutation | c.1180N>A | p.Asp394Asn | p.D394N | Q9C0B1 | protein_coding | tolerated(0.1) | probably_damaging(0.946) | TCGA-AC-A23H-01 | Breast | breast invasive carcinoma | Female | >=65 | I/II | Unknown | Unknown | PD | |
| FTO | SNV | Missense_Mutation | novel | c.584N>T | p.Ser195Ile | p.S195I | Q9C0B1 | protein_coding | tolerated(0.07) | possibly_damaging(0.785) | TCGA-AO-A03R-01 | Breast | breast invasive carcinoma | Female | <65 | I/II | Chemotherapy | doxorubicin | SD |
| FTO | SNV | Missense_Mutation | c.574N>C | p.Asp192His | p.D192H | Q9C0B1 | protein_coding | tolerated(0.07) | possibly_damaging(0.77) | TCGA-D8-A1J8-01 | Breast | breast invasive carcinoma | Female | >=65 | I/II | Hormone Therapy | nolvadex | SD | |
| FTO | insertion | Frame_Shift_Ins | novel | c.582_583insTCTGCTCACTCCGGTATCTCGCATCCTCATTGGTA | p.Arg196AlafsTer11 | p.R196Afs*11 | Q9C0B1 | protein_coding | TCGA-AO-A03R-01 | Breast | breast invasive carcinoma | Female | <65 | I/II | Chemotherapy | doxorubicin | SD | ||
| FTO | deletion | Frame_Shift_Del | novel | c.865delC | p.Leu289PhefsTer68 | p.L289Ffs*68 | Q9C0B1 | protein_coding | TCGA-D8-A27V-01 | Breast | breast invasive carcinoma | Female | <65 | I/II | Hormone Therapy | tamoxiphen | SD | ||
| FTO | SNV | Missense_Mutation | c.1042G>A | p.Asp348Asn | p.D348N | Q9C0B1 | protein_coding | tolerated(0.11) | benign(0.005) | TCGA-2W-A8YY-01 | Cervix | cervical & endocervical cancer | Female | <65 | I/II | Chemotherapy | cisplatin | CR | |
| FTO | SNV | Missense_Mutation | novel | c.1132N>A | p.Trp378Arg | p.W378R | Q9C0B1 | protein_coding | deleterious(0) | probably_damaging(0.999) | TCGA-DS-A1OB-01 | Cervix | cervical & endocervical cancer | Female | <65 | I/II | Chemotherapy | carboplatin | PD |
| FTO | SNV | Missense_Mutation | c.1180G>A | p.Asp394Asn | p.D394N | Q9C0B1 | protein_coding | tolerated(0.1) | probably_damaging(0.946) | TCGA-EK-A2RM-01 | Cervix | cervical & endocervical cancer | Female | <65 | I/II | Unknown | Unknown | SD | |
| FTO | SNV | Missense_Mutation | rs577569584 | c.559N>A | p.Gly187Arg | p.G187R | Q9C0B1 | protein_coding | tolerated(0.52) | benign(0.033) | TCGA-A6-5661-01 | Colorectum | colon adenocarcinoma | Female | >=65 | I/II | Unknown | Unknown | SD |
| Page: 1 2 3 4 5 6 7 |
Top |
Related drugs of malignant transformation related genes |
| Identification of chemicals and drugs interact with genes involved in malignant transfromation |
| (DGIdb 4.0) |
| Entrez ID | Symbol | Category | Interaction Types | Drug Claim Name | Drug Name | PMIDs |
| 79068 | FTO | ENZYME | interferon alfa-2b, recombinant | 25367448 | ||
| 79068 | FTO | ENZYME | mercaptopurine | MERCAPTOPURINE | 27558924 | |
| 79068 | FTO | ENZYME | azathioprine | AZATHIOPRINE | 27558924 | |
| 79068 | FTO | ENZYME | interferon alfa-2a, recombinant | 25367448 | ||
| 79068 | FTO | ENZYME | ribavirin | RIBAVIRIN | 25367448 | |
| 79068 | FTO | ENZYME | atenolol | ATENOLOL | ||
| 79068 | FTO | ENZYME | ethanol | ALCOHOL | 32451486 |
| Page: 1 |

Copyright 2023-Present -The University of Texas Health Science Center at Houston |