
|
|||||
|
 | |
| |
| |
| |
| |
| |
|
Gene: FNBP1L |
Gene summary for FNBP1L |
| Gene information | Species | Human | Gene symbol | FNBP1L | Gene ID | 54874 |
| Gene name | formin binding protein 1 like | |
| Gene Alias | C1orf39 | |
| Cytomap | 1p22.1 | |
| Gene Type | protein-coding | GO ID | GO:0006810 | UniProtAcc | Q5T0N5 |
Top |
Malignant transformation analysis |
| Identification of the aberrant gene expression in precancerous and cancerous lesions by comparing the gene expression of stem-like cells in diseased tissues with normal stem cells |
| Entrez ID | Symbol | Replicates | Species | Organ | Tissue | Adj P-value | Log2FC | Malignancy |
| 54874 | FNBP1L | CA_HPV_1 | Human | Cervix | CC | 5.67e-05 | -1.46e-01 | 0.0264 |
| 54874 | FNBP1L | CCI_2 | Human | Cervix | CC | 4.98e-03 | 8.25e-01 | 0.5249 |
| 54874 | FNBP1L | CCI_3 | Human | Cervix | CC | 3.87e-07 | 8.26e-01 | 0.516 |
| 54874 | FNBP1L | H2 | Human | Cervix | HSIL_HPV | 4.87e-08 | 4.25e-01 | 0.0632 |
| 54874 | FNBP1L | HTA11_3410_2000001011 | Human | Colorectum | AD | 2.36e-30 | -7.36e-01 | 0.0155 |
| 54874 | FNBP1L | HTA11_2487_2000001011 | Human | Colorectum | SER | 5.08e-11 | -6.56e-01 | -0.1808 |
| 54874 | FNBP1L | HTA11_2951_2000001011 | Human | Colorectum | AD | 1.83e-03 | -7.07e-01 | 0.0216 |
| 54874 | FNBP1L | HTA11_1938_2000001011 | Human | Colorectum | AD | 3.32e-04 | -3.28e-01 | -0.0811 |
| 54874 | FNBP1L | HTA11_3361_2000001011 | Human | Colorectum | AD | 3.47e-11 | -7.79e-01 | -0.1207 |
| 54874 | FNBP1L | HTA11_83_2000001011 | Human | Colorectum | SER | 1.70e-02 | -4.26e-01 | -0.1526 |
| 54874 | FNBP1L | HTA11_696_2000001011 | Human | Colorectum | AD | 2.18e-12 | -4.92e-01 | -0.1464 |
| 54874 | FNBP1L | HTA11_866_2000001011 | Human | Colorectum | AD | 7.08e-06 | -4.25e-01 | -0.1001 |
| 54874 | FNBP1L | HTA11_2992_2000001011 | Human | Colorectum | SER | 1.01e-04 | -7.53e-01 | -0.1706 |
| 54874 | FNBP1L | HTA11_5212_2000001011 | Human | Colorectum | AD | 2.01e-05 | -7.95e-01 | -0.2061 |
| 54874 | FNBP1L | HTA11_5216_2000001011 | Human | Colorectum | SER | 1.40e-05 | -6.58e-01 | -0.1462 |
| 54874 | FNBP1L | HTA11_9341_2000001011 | Human | Colorectum | SER | 4.01e-05 | -9.03e-01 | -0.00410000000000005 |
| 54874 | FNBP1L | HTA11_7862_2000001011 | Human | Colorectum | AD | 4.10e-09 | -7.61e-01 | -0.0179 |
| 54874 | FNBP1L | HTA11_866_3004761011 | Human | Colorectum | AD | 1.14e-19 | -7.20e-01 | 0.096 |
| 54874 | FNBP1L | HTA11_4255_2000001011 | Human | Colorectum | SER | 2.29e-03 | -6.12e-01 | 0.0446 |
| 54874 | FNBP1L | HTA11_9408_2000001011 | Human | Colorectum | AD | 8.31e-04 | -9.27e-01 | 0.0451 |
| Page: 1 2 3 4 5 6 7 8 9 10 11 |
| Tissue | Expression Dynamics | Abbreviation |
| Cervix |  | CC: Cervix cancer |
| HSIL_HPV: HPV-infected high-grade squamous intraepithelial lesions | ||
| N_HPV: HPV-infected normal cervix | ||
| Colorectum (GSE201348) | 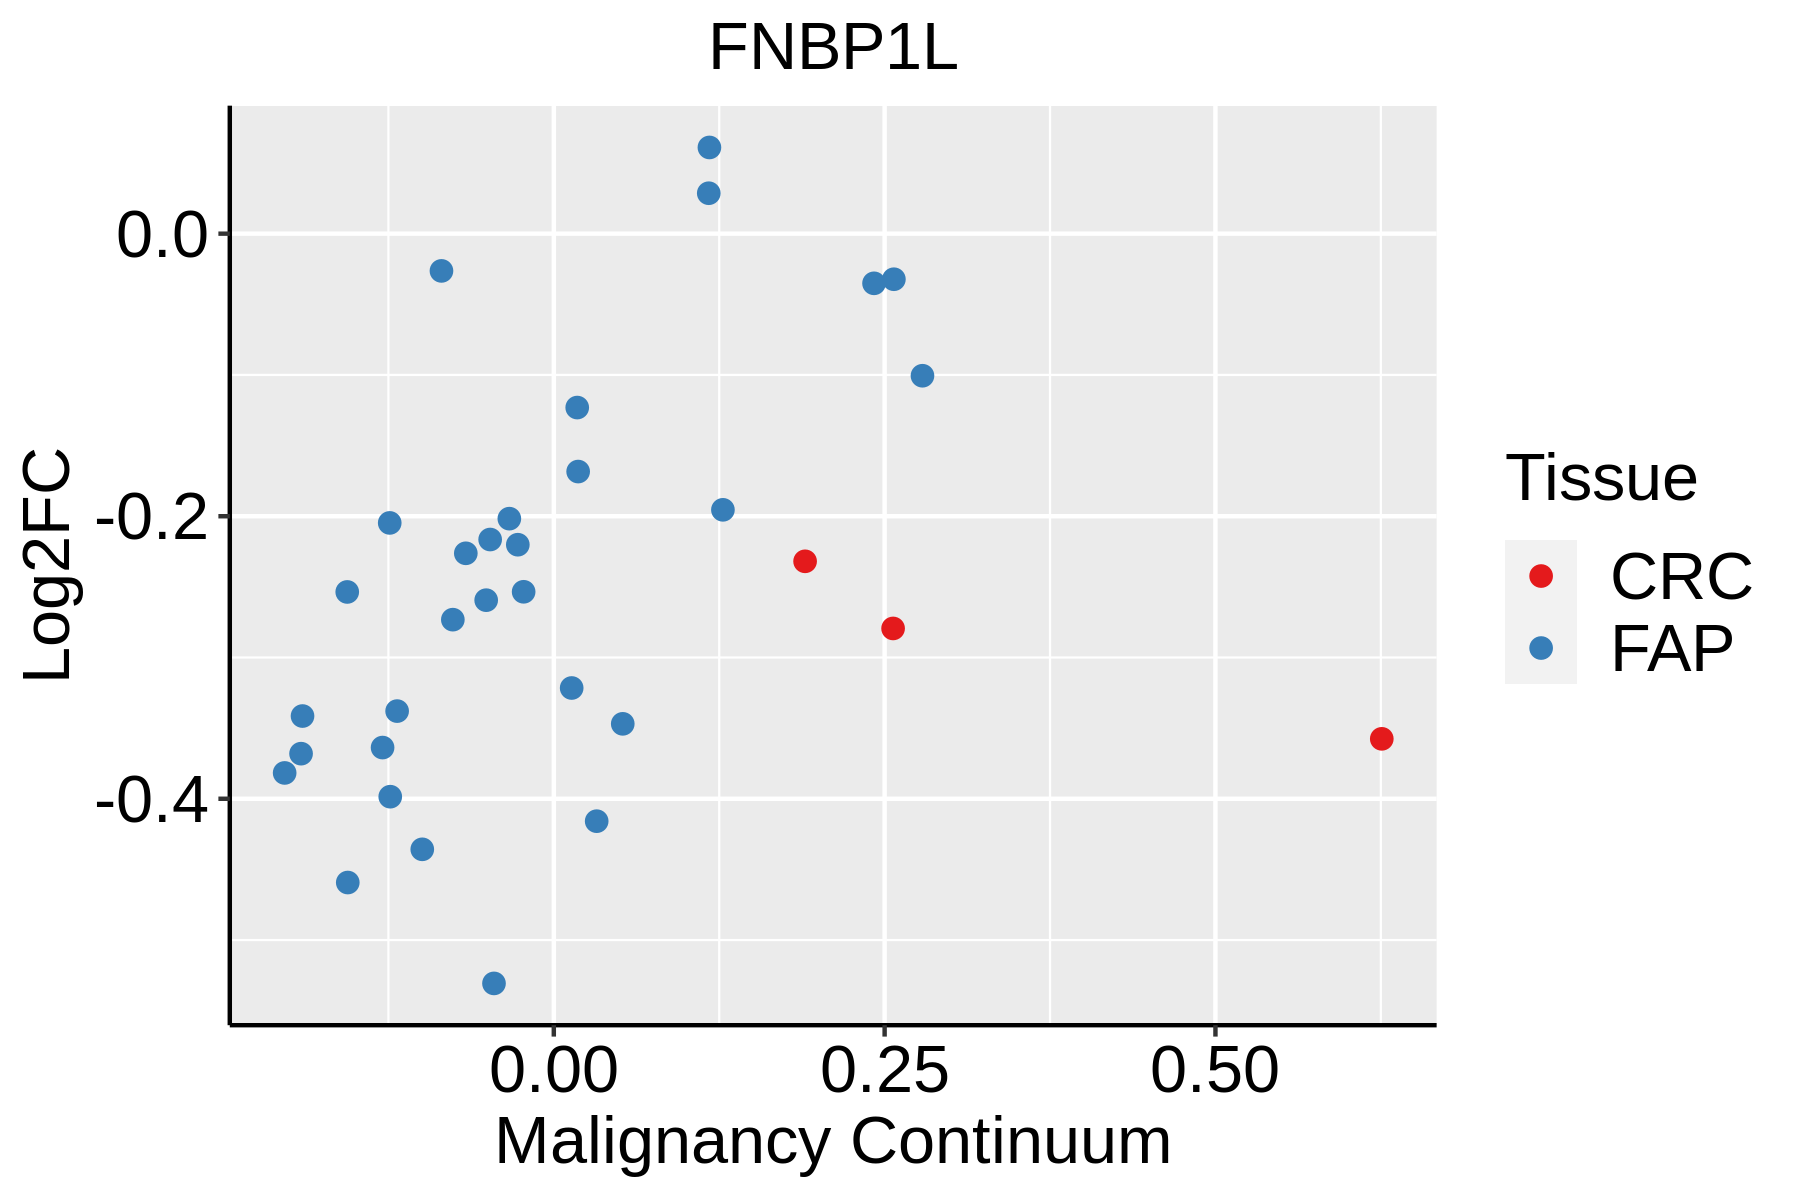 | FAP: Familial adenomatous polyposis |
| CRC: Colorectal cancer | ||
| Colorectum (HTA11) | 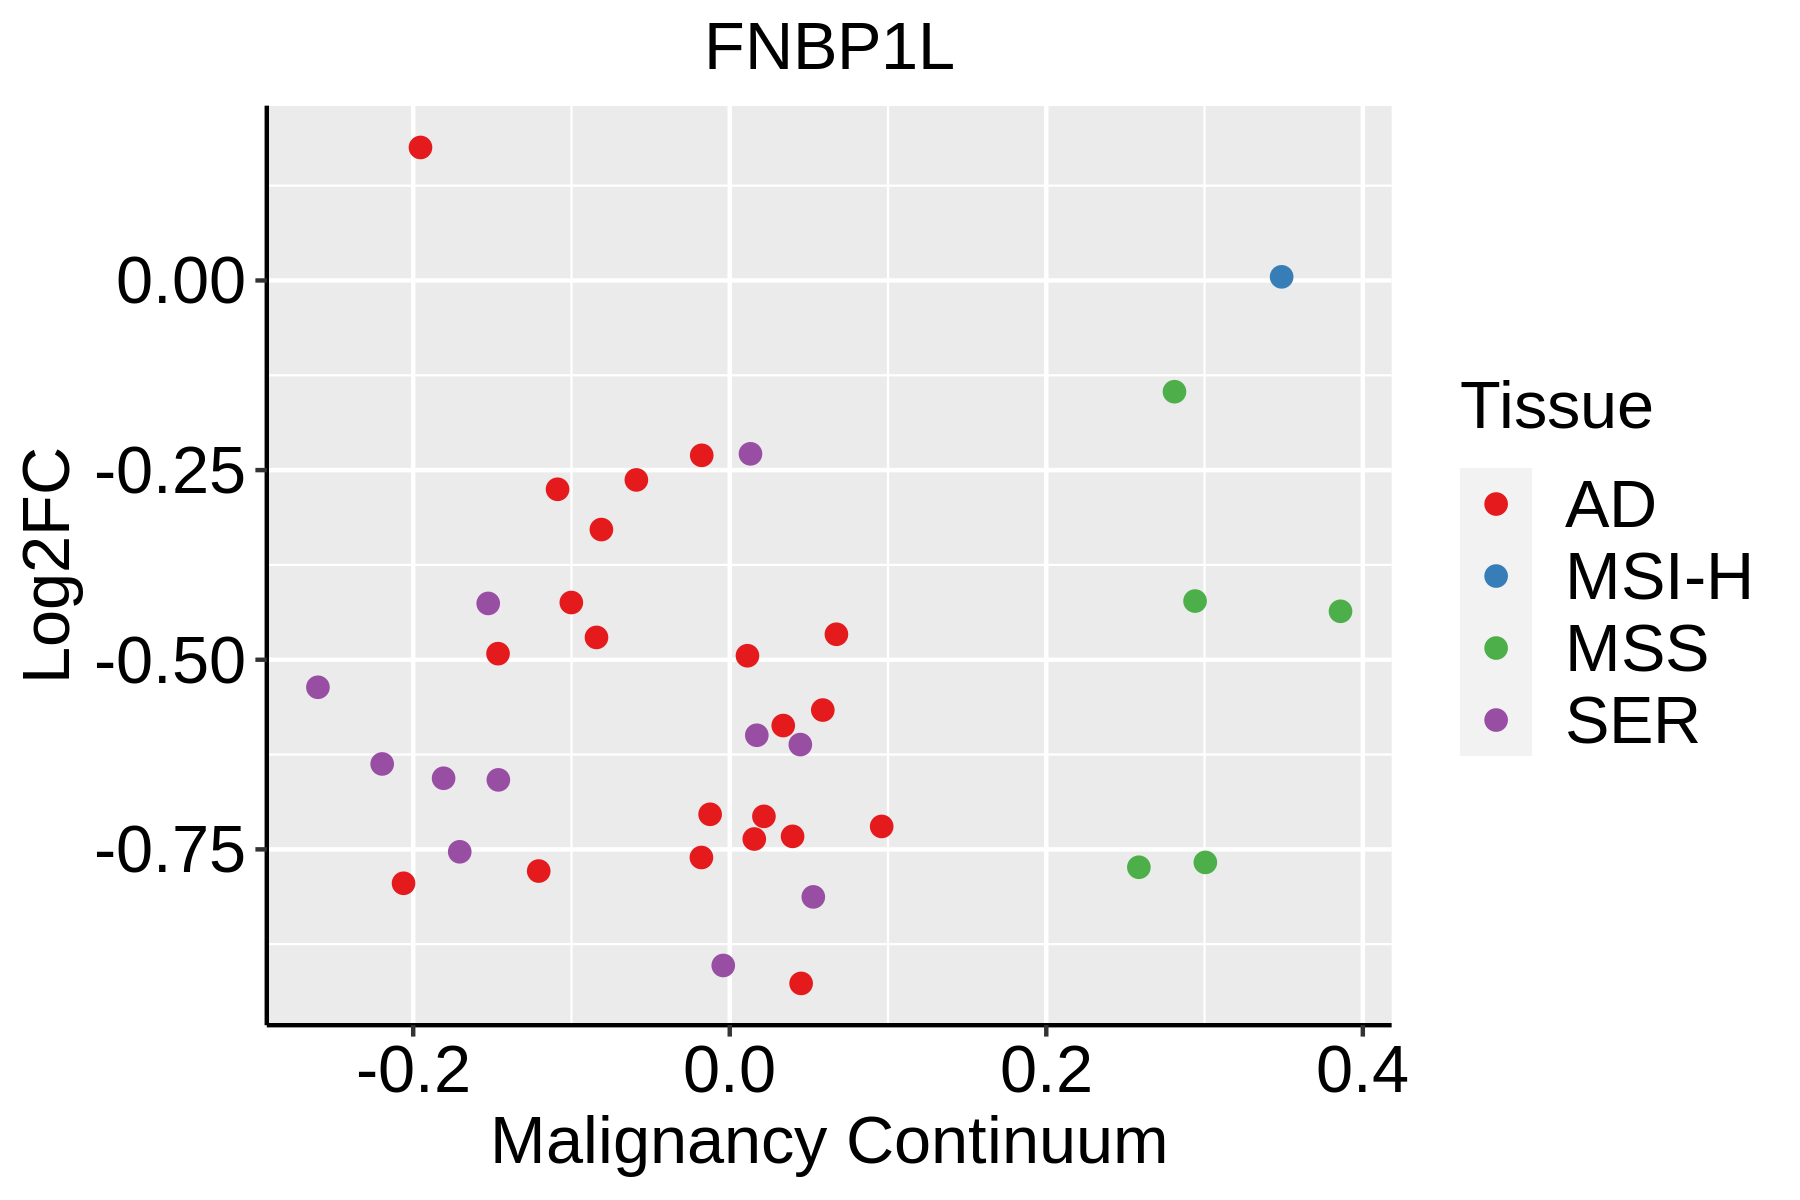 | AD: Adenomas |
| SER: Sessile serrated lesions | ||
| MSI-H: Microsatellite-high colorectal cancer | ||
| MSS: Microsatellite stable colorectal cancer | ||
| Endometrium | 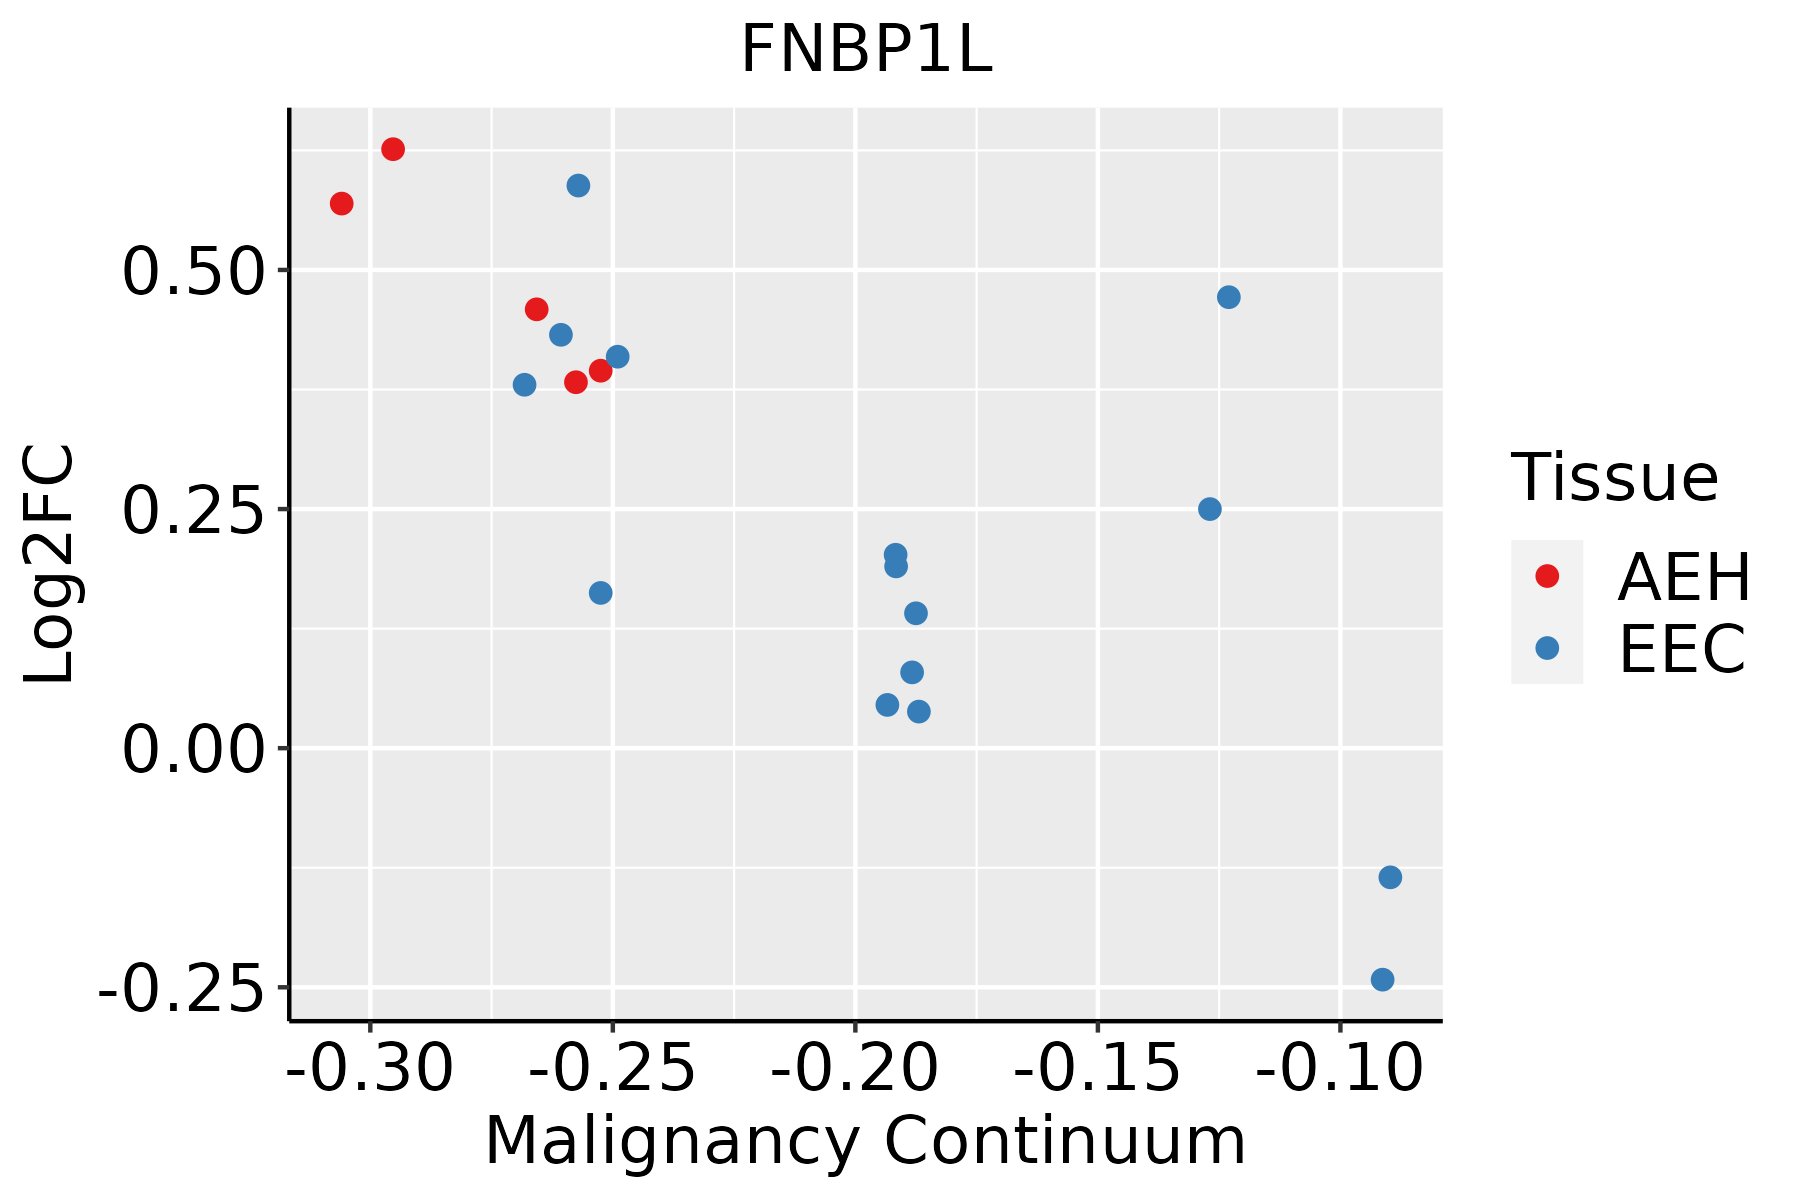 | AEH: Atypical endometrial hyperplasia |
| EEC: Endometrioid Cancer | ||
| Esophagus | 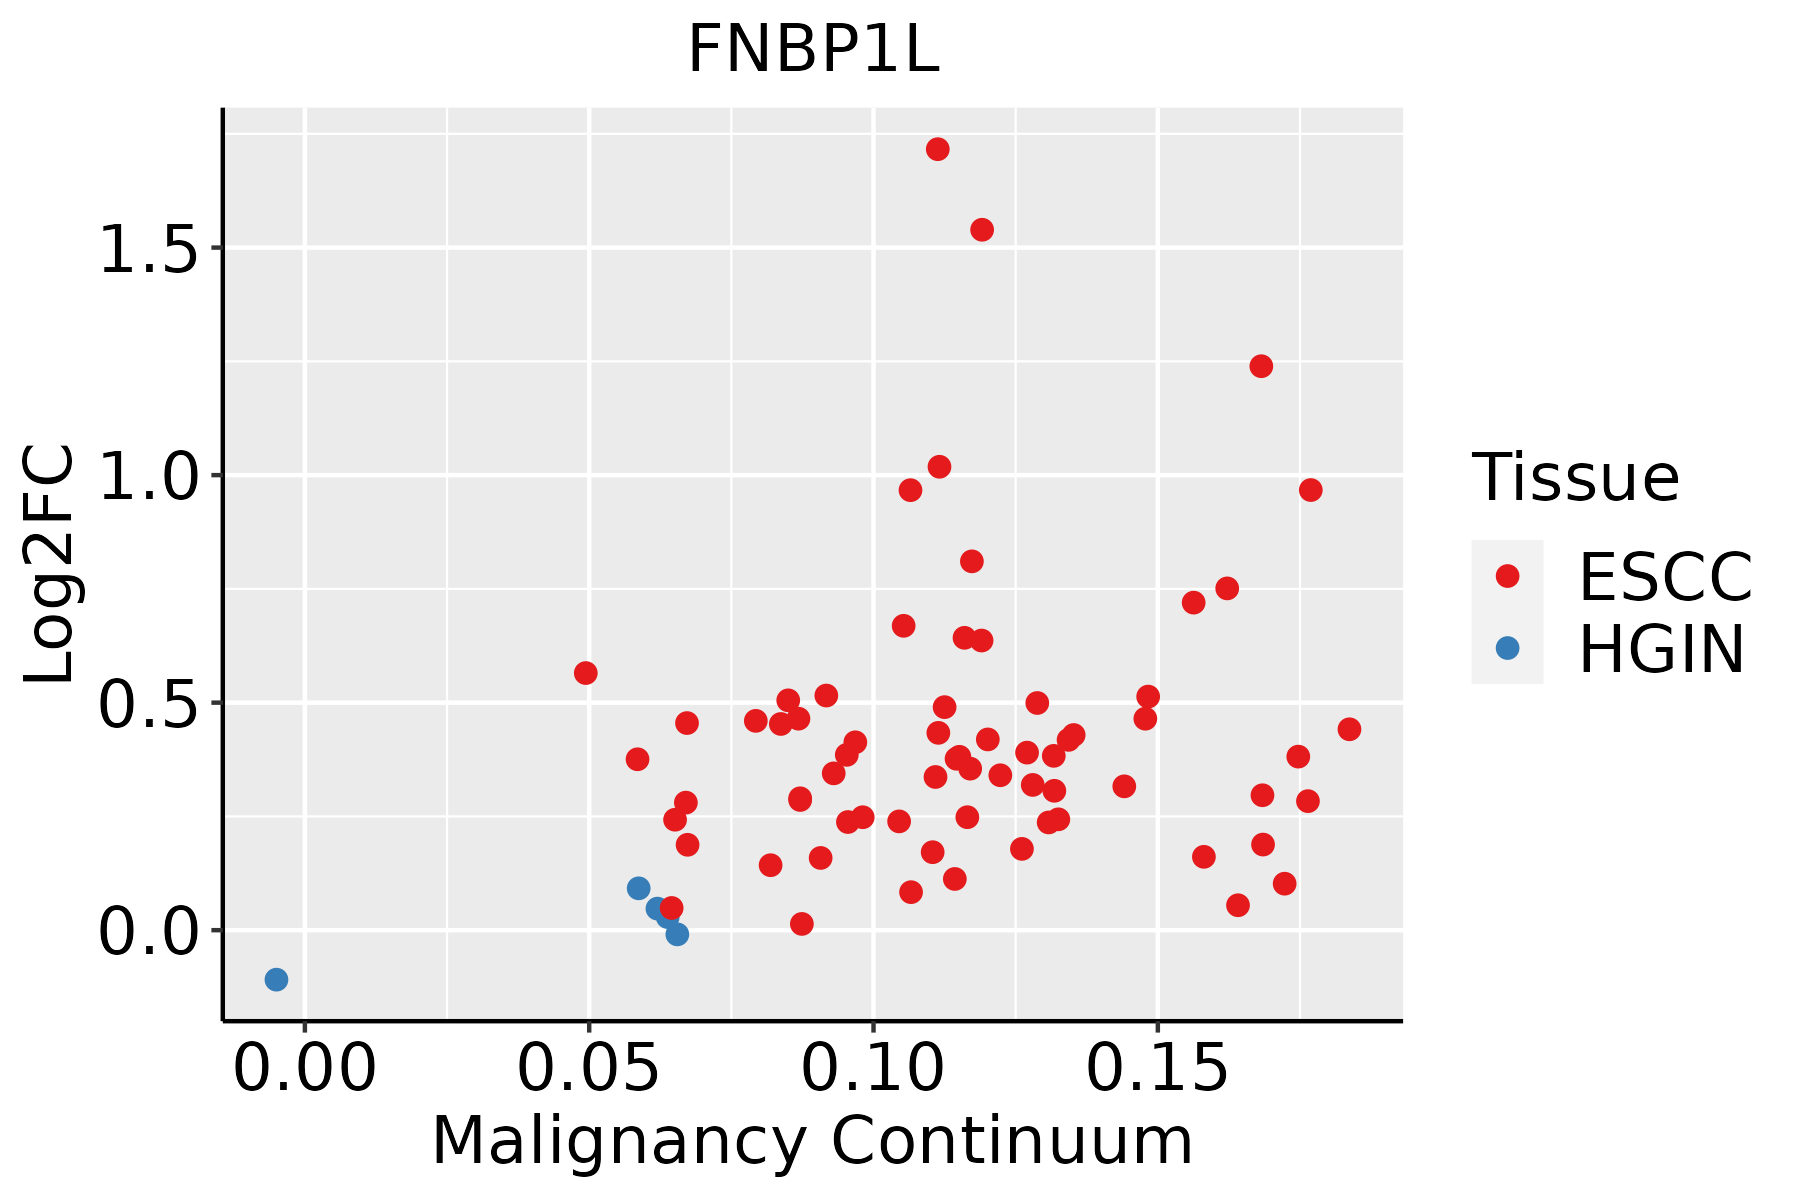 | ESCC: Esophageal squamous cell carcinoma |
| HGIN: High-grade intraepithelial neoplasias | ||
| LGIN: Low-grade intraepithelial neoplasias | ||
| Liver |  | HCC: Hepatocellular carcinoma |
| NAFLD: Non-alcoholic fatty liver disease | ||
| Lung |  | AAH: Atypical adenomatous hyperplasia |
| AIS: Adenocarcinoma in situ | ||
| IAC: Invasive lung adenocarcinoma | ||
| MIA: Minimally invasive adenocarcinoma | ||
| Oral Cavity | 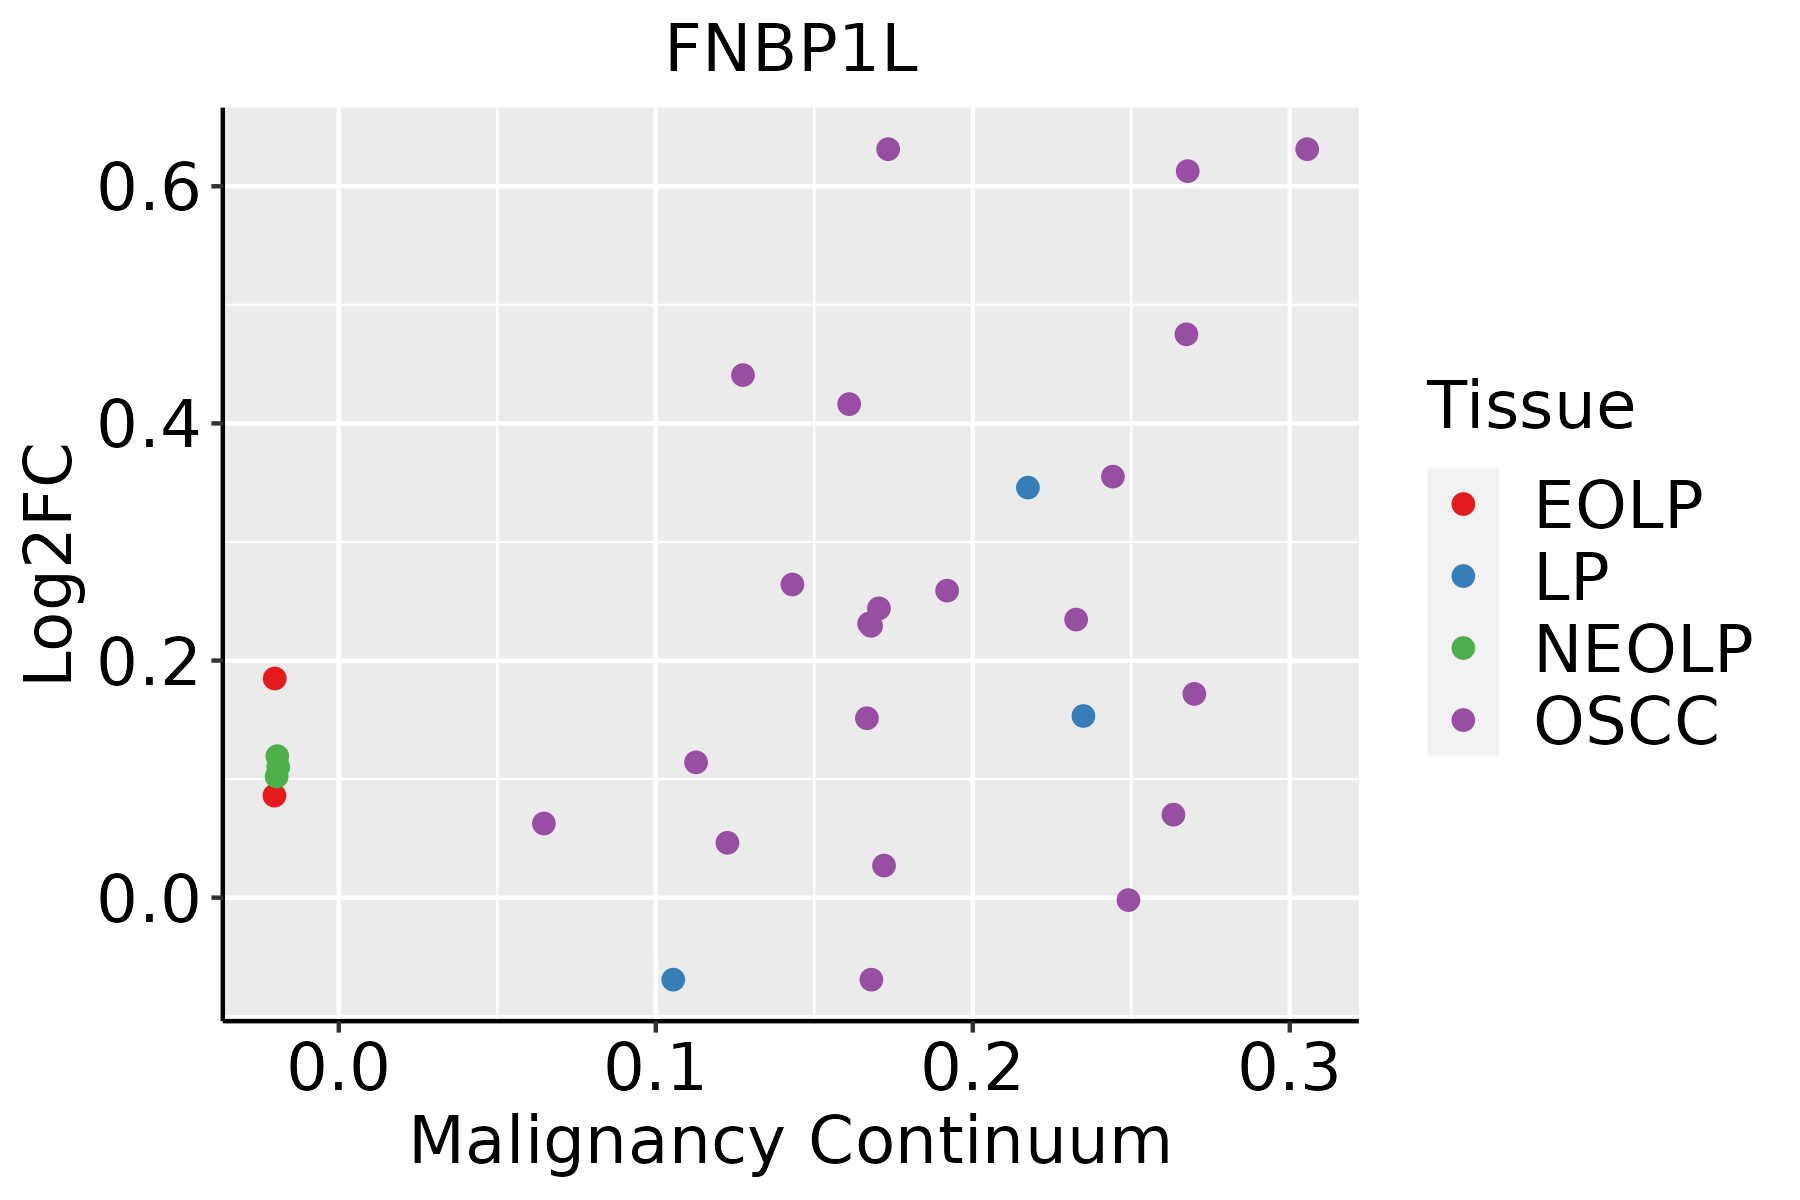 | EOLP: Erosive Oral lichen planus |
| LP: leukoplakia | ||
| NEOLP: Non-erosive oral lichen planus | ||
| OSCC: Oral squamous cell carcinoma | ||
| Prostate | 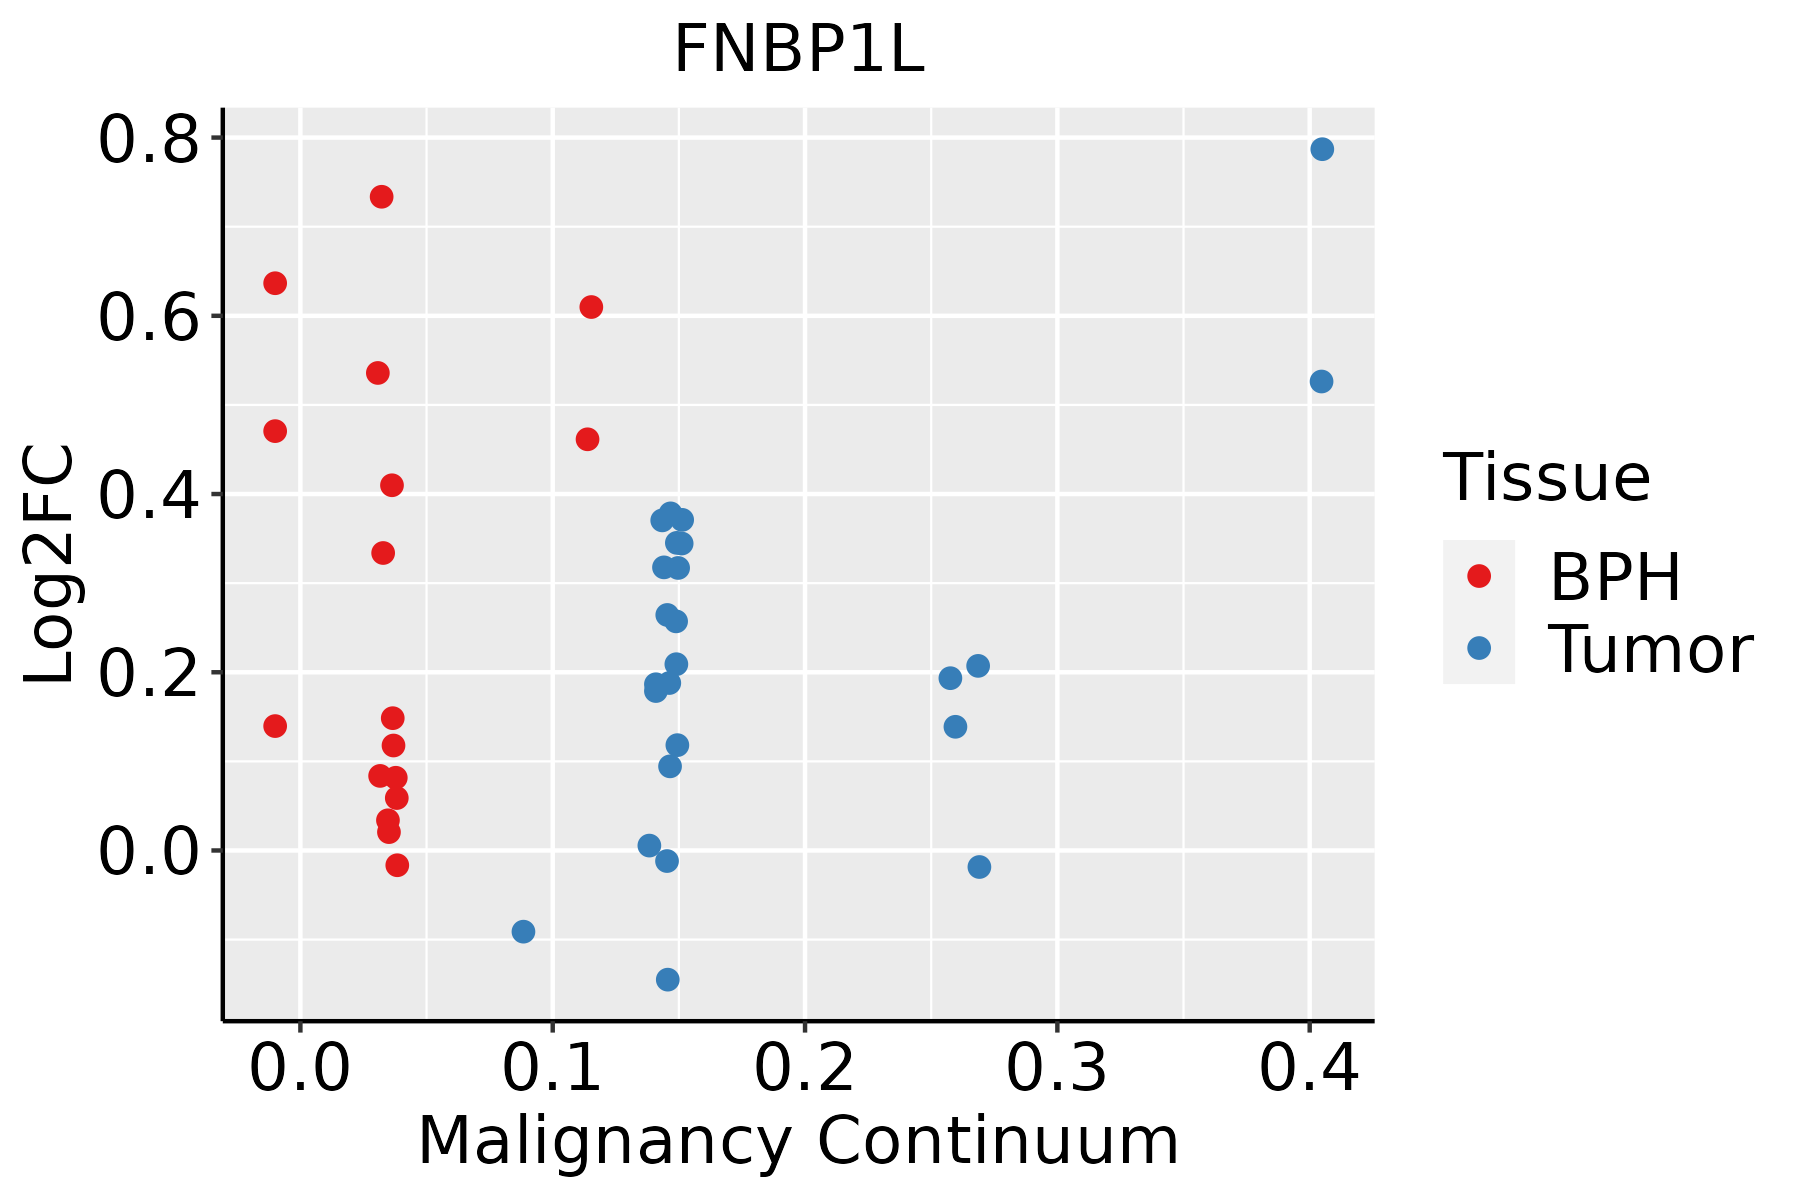 | BPH: Benign Prostatic Hyperplasia |
| Skin | 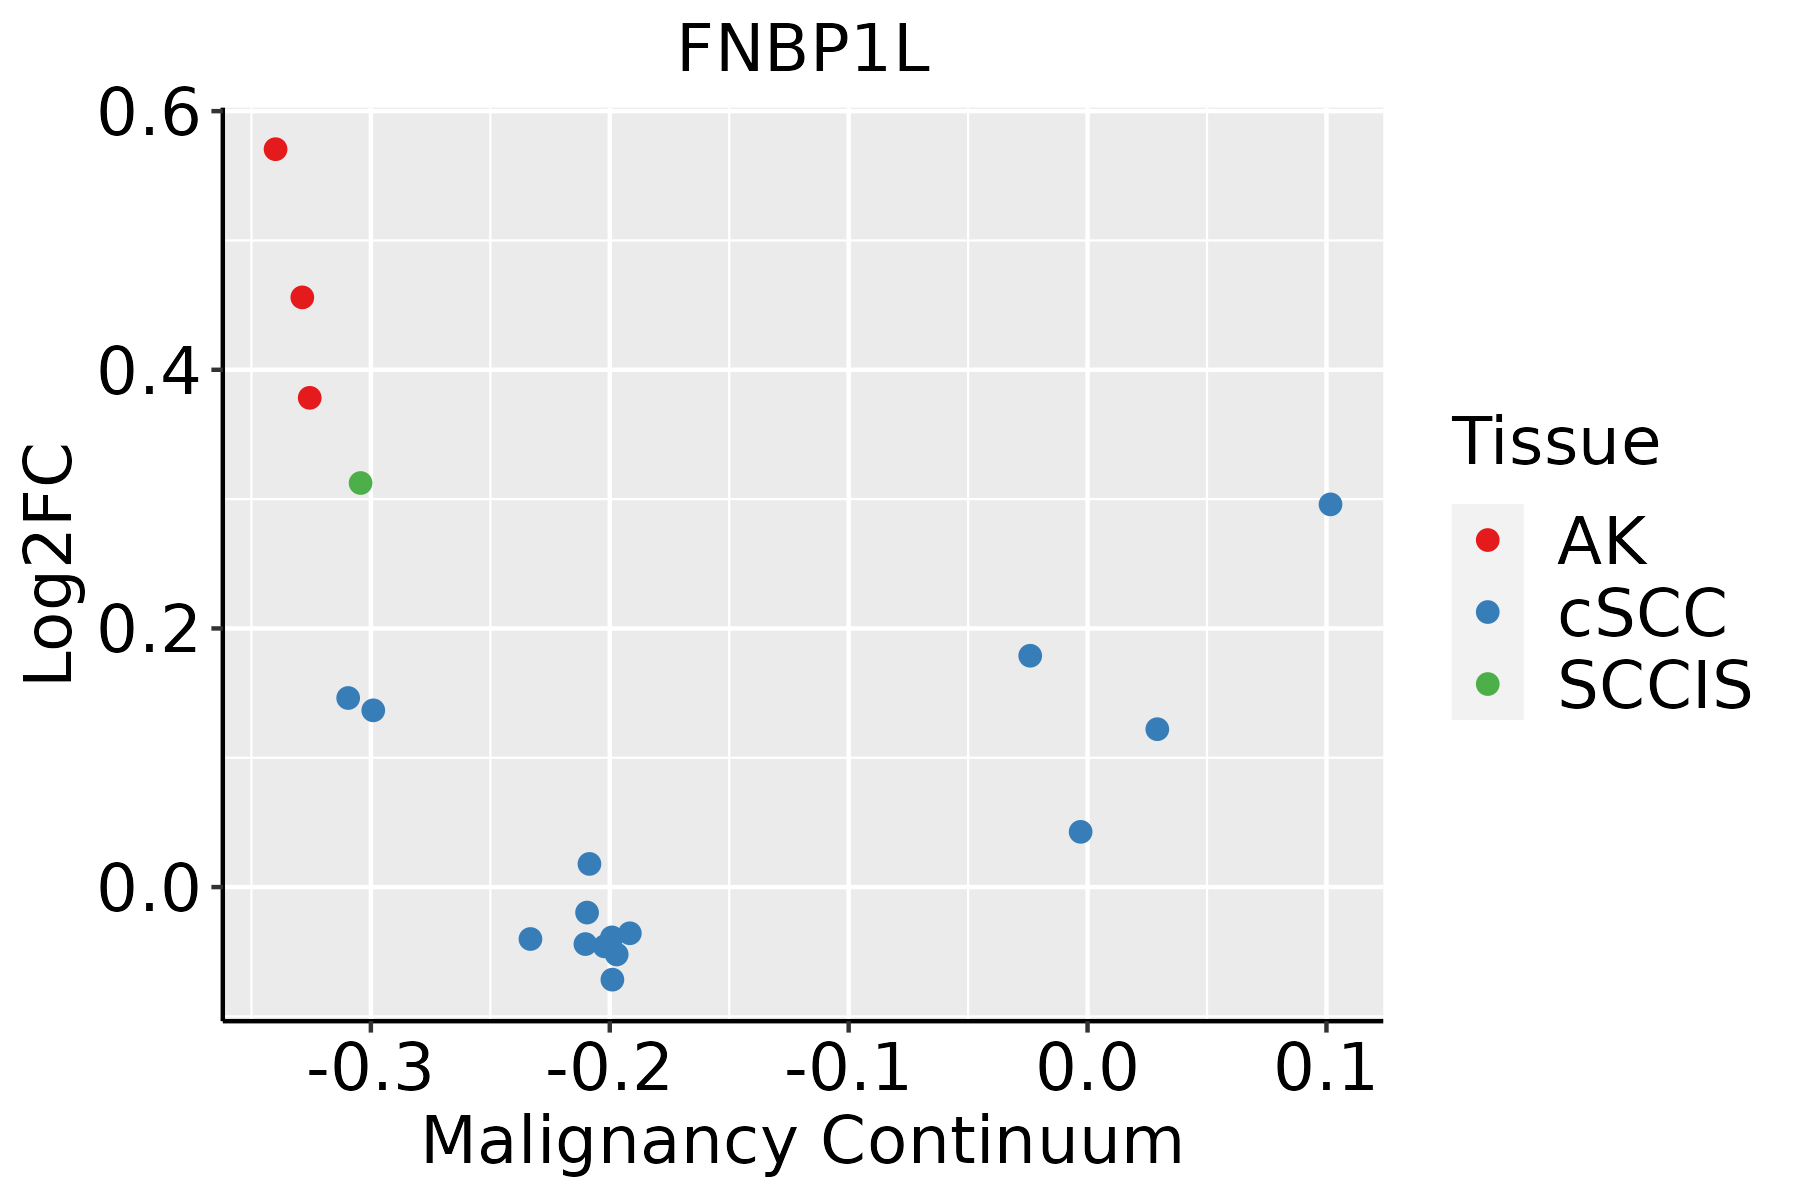 | AK: Actinic keratosis |
| cSCC: Cutaneous squamous cell carcinoma | ||
| SCCIS:squamous cell carcinoma in situ | ||
| Thyroid |  | ATC: Anaplastic thyroid cancer |
| HT: Hashimoto's thyroiditis | ||
| PTC: Papillary thyroid cancer |
| ∗log2FC in expression of this searched gene in stem-like cells from each diseased tissue sample relative to stem-like cells in normal samples in each tissue plotted against the malignancy continuum. Samples are colored based on if they are from different disease stage. |
Top |
Malignant transformation related pathway analysis |
| Find out the enriched GO biological processes and KEGG pathways involved in transition from healthy to precancer to cancer |
| Tissue | Disease Stage | Enriched GO biological Processes |
| Colorectum | AD |  |
| Colorectum | SER |  |
| Colorectum | MSS |  |
| Colorectum | MSI-H |  |
| Colorectum | FAP |  |
| ∗Top 15 enriched GO BP terms are showed in the bar plot of each disease state in each tissue. Each row represents a significant GO biological process which is colored according to the -log10(p.adjust). |
| Page: 1 2 3 4 5 6 7 8 9 |
| GO ID | Tissue | Disease Stage | Description | Gene Ratio | Bg Ratio | pvalue | p.adjust | Count |
| GO:0097320 | Oral cavity | OSCC | plasma membrane tubulation | 15/7305 | 20/18723 | 1.19e-03 | 5.99e-03 | 15 |
| GO:00995184 | Oral cavity | OSCC | vesicle cytoskeletal trafficking | 41/7305 | 73/18723 | 2.18e-03 | 9.95e-03 | 41 |
| GO:01200346 | Oral cavity | OSCC | positive regulation of plasma membrane bounded cell projection assembly | 55/7305 | 105/18723 | 3.64e-03 | 1.51e-02 | 55 |
| GO:001605013 | Oral cavity | LP | vesicle organization | 128/4623 | 300/18723 | 4.96e-12 | 3.98e-10 | 128 |
| GO:005165615 | Oral cavity | LP | establishment of organelle localization | 147/4623 | 390/18723 | 6.01e-09 | 2.46e-07 | 147 |
| GO:0006900110 | Oral cavity | LP | vesicle budding from membrane | 36/4623 | 61/18723 | 1.19e-08 | 4.50e-07 | 36 |
| GO:005165015 | Oral cavity | LP | establishment of vesicle localization | 64/4623 | 161/18723 | 1.65e-05 | 2.86e-04 | 64 |
| GO:000689817 | Oral cavity | LP | receptor-mediated endocytosis | 87/4623 | 244/18723 | 7.83e-05 | 1.02e-03 | 87 |
| GO:005164814 | Oral cavity | LP | vesicle localization | 66/4623 | 177/18723 | 1.25e-04 | 1.46e-03 | 66 |
| GO:006049116 | Oral cavity | LP | regulation of cell projection assembly | 66/4623 | 188/18723 | 8.62e-04 | 7.49e-03 | 66 |
| GO:003070516 | Oral cavity | LP | cytoskeleton-dependent intracellular transport | 68/4623 | 195/18723 | 8.92e-04 | 7.64e-03 | 68 |
| GO:012003217 | Oral cavity | LP | regulation of plasma membrane bounded cell projection assembly | 64/4623 | 186/18723 | 1.81e-03 | 1.37e-02 | 64 |
| GO:003134615 | Oral cavity | LP | positive regulation of cell projection organization | 109/4623 | 353/18723 | 4.59e-03 | 2.93e-02 | 109 |
| GO:007258313 | Oral cavity | LP | clathrin-dependent endocytosis | 20/4623 | 47/18723 | 5.42e-03 | 3.30e-02 | 20 |
| GO:00307059 | Prostate | BPH | cytoskeleton-dependent intracellular transport | 68/3107 | 195/18723 | 3.78e-10 | 1.98e-08 | 68 |
| GO:000690017 | Prostate | BPH | vesicle budding from membrane | 30/3107 | 61/18723 | 3.85e-09 | 1.44e-07 | 30 |
| GO:00516569 | Prostate | BPH | establishment of organelle localization | 107/3107 | 390/18723 | 3.67e-08 | 1.03e-06 | 107 |
| GO:00313469 | Prostate | BPH | positive regulation of cell projection organization | 98/3107 | 353/18723 | 7.34e-08 | 1.88e-06 | 98 |
| GO:00160507 | Prostate | BPH | vesicle organization | 82/3107 | 300/18723 | 1.64e-06 | 2.78e-05 | 82 |
| GO:00516508 | Prostate | BPH | establishment of vesicle localization | 49/3107 | 161/18723 | 9.12e-06 | 1.28e-04 | 49 |
| Page: 1 2 3 4 5 6 7 8 9 10 11 12 13 14 15 16 |
| Pathway ID | Tissue | Disease Stage | Description | Gene Ratio | Bg Ratio | pvalue | p.adjust | qvalue | Count |
| hsa0513120 | Cervix | CC | Shigellosis | 69/1267 | 247/8465 | 7.64e-08 | 1.03e-06 | 6.10e-07 | 69 |
| hsa05131110 | Cervix | CC | Shigellosis | 69/1267 | 247/8465 | 7.64e-08 | 1.03e-06 | 6.10e-07 | 69 |
| hsa0513125 | Cervix | HSIL_HPV | Shigellosis | 27/459 | 247/8465 | 3.78e-04 | 3.49e-03 | 2.82e-03 | 27 |
| hsa0513135 | Cervix | HSIL_HPV | Shigellosis | 27/459 | 247/8465 | 3.78e-04 | 3.49e-03 | 2.82e-03 | 27 |
| hsa05131 | Colorectum | AD | Shigellosis | 109/2092 | 247/8465 | 1.09e-11 | 2.44e-10 | 1.55e-10 | 109 |
| hsa051311 | Colorectum | AD | Shigellosis | 109/2092 | 247/8465 | 1.09e-11 | 2.44e-10 | 1.55e-10 | 109 |
| hsa051312 | Colorectum | SER | Shigellosis | 87/1580 | 247/8465 | 3.07e-10 | 7.27e-09 | 5.28e-09 | 87 |
| hsa051313 | Colorectum | SER | Shigellosis | 87/1580 | 247/8465 | 3.07e-10 | 7.27e-09 | 5.28e-09 | 87 |
| hsa051314 | Colorectum | MSS | Shigellosis | 94/1875 | 247/8465 | 6.82e-09 | 1.34e-07 | 8.23e-08 | 94 |
| hsa051315 | Colorectum | MSS | Shigellosis | 94/1875 | 247/8465 | 6.82e-09 | 1.34e-07 | 8.23e-08 | 94 |
| hsa051318 | Colorectum | FAP | Shigellosis | 76/1404 | 247/8465 | 1.57e-08 | 5.84e-07 | 3.55e-07 | 76 |
| hsa051319 | Colorectum | FAP | Shigellosis | 76/1404 | 247/8465 | 1.57e-08 | 5.84e-07 | 3.55e-07 | 76 |
| hsa0513110 | Colorectum | CRC | Shigellosis | 59/1091 | 247/8465 | 1.19e-06 | 5.41e-05 | 3.66e-05 | 59 |
| hsa0513111 | Colorectum | CRC | Shigellosis | 59/1091 | 247/8465 | 1.19e-06 | 5.41e-05 | 3.66e-05 | 59 |
| hsa0513126 | Endometrium | AEH | Shigellosis | 78/1197 | 247/8465 | 9.23e-13 | 2.00e-11 | 1.46e-11 | 78 |
| hsa05131111 | Endometrium | AEH | Shigellosis | 78/1197 | 247/8465 | 9.23e-13 | 2.00e-11 | 1.46e-11 | 78 |
| hsa0513127 | Endometrium | EEC | Shigellosis | 79/1237 | 247/8465 | 1.80e-12 | 3.95e-11 | 2.95e-11 | 79 |
| hsa0513136 | Endometrium | EEC | Shigellosis | 79/1237 | 247/8465 | 1.80e-12 | 3.95e-11 | 2.95e-11 | 79 |
| hsa05131211 | Esophagus | ESCC | Shigellosis | 176/4205 | 247/8465 | 2.27e-12 | 4.01e-11 | 2.05e-11 | 176 |
| hsa05131310 | Esophagus | ESCC | Shigellosis | 176/4205 | 247/8465 | 2.27e-12 | 4.01e-11 | 2.05e-11 | 176 |
| Page: 1 2 |
Top |
Cell-cell communication analysis |
| Identification of potential cell-cell interactions between two cell types and their ligand-receptor pairs for different disease states |
| Ligand | Receptor | LRpair | Pathway | Tissue | Disease Stage |
| Page: 1 |
Top |
Single-cell gene regulatory network inference analysis |
| Find out the significant the regulons (TFs) and the target genes of each regulon across cell types for different disease states |
| TF | Cell Type | Tissue | Disease Stage | Target Gene | RSS | Regulon Activity |
| ∗The dot plots of a searched regulon are shown for all cell subpopulations in each disease state of each tissue based on the regulon specific score inferred using pySCENIC and by calculating the average expression. |
| Page: 1 |
Top |
Somatic mutation of malignant transformation related genes |
| Annotation of somatic variants for genes involved in malignant transformation |
| Hugo Symbol | Variant Class | Variant Classification | dbSNP RS | HGVSc | HGVSp | HGVSp Short | SWISSPROT | BIOTYPE | SIFT | PolyPhen | Tumor Sample Barcode | Tissue | Histology | Sex | Age | Stage | Therapy Types | Drugs | Outcome |
| FNBP1L | SNV | Missense_Mutation | c.390N>C | p.Trp130Cys | p.W130C | Q5T0N5 | protein_coding | deleterious(0) | probably_damaging(0.998) | TCGA-A2-A0YK-01 | Breast | breast invasive carcinoma | Female | <65 | I/II | Chemotherapy | cytoxan | SD | |
| FNBP1L | SNV | Missense_Mutation | c.1171N>A | p.Ala391Thr | p.A391T | Q5T0N5 | protein_coding | tolerated(0.56) | probably_damaging(0.997) | TCGA-A8-A09Z-01 | Breast | breast invasive carcinoma | Female | >=65 | I/II | Unknown | Unknown | SD | |
| FNBP1L | SNV | Missense_Mutation | rs769227073 | c.1783G>A | p.Asp595Asn | p.D595N | Q5T0N5 | protein_coding | deleterious(0.02) | probably_damaging(0.997) | TCGA-AN-A046-01 | Breast | breast invasive carcinoma | Female | >=65 | I/II | Unknown | Unknown | SD |
| FNBP1L | SNV | Missense_Mutation | c.753G>C | p.Met251Ile | p.M251I | Q5T0N5 | protein_coding | tolerated(0.61) | possibly_damaging(0.782) | TCGA-C8-A26Y-01 | Breast | breast invasive carcinoma | Female | >=65 | I/II | Unknown | Unknown | SD | |
| FNBP1L | SNV | Missense_Mutation | c.287G>T | p.Arg96Ile | p.R96I | Q5T0N5 | protein_coding | deleterious(0.04) | probably_damaging(0.99) | TCGA-C5-A3HE-01 | Cervix | cervical & endocervical cancer | Female | <65 | I/II | Unknown | Unknown | PD | |
| FNBP1L | SNV | Missense_Mutation | novel | c.1168N>A | p.Pro390Thr | p.P390T | Q5T0N5 | protein_coding | tolerated(0.18) | benign(0.005) | TCGA-AA-3845-01 | Colorectum | colon adenocarcinoma | Female | >=65 | I/II | Unknown | Unknown | PD |
| FNBP1L | SNV | Missense_Mutation | c.824N>G | p.Phe275Cys | p.F275C | Q5T0N5 | protein_coding | deleterious(0) | probably_damaging(0.998) | TCGA-CA-6718-01 | Colorectum | colon adenocarcinoma | Male | <65 | I/II | Unknown | Unknown | PD | |
| FNBP1L | SNV | Missense_Mutation | c.14C>T | p.Thr5Met | p.T5M | Q5T0N5 | protein_coding | deleterious(0) | benign(0.035) | TCGA-CK-4951-01 | Colorectum | colon adenocarcinoma | Female | >=65 | I/II | Unknown | Unknown | PD | |
| FNBP1L | SNV | Missense_Mutation | c.1381N>A | p.Leu461Ile | p.L461I | Q5T0N5 | protein_coding | deleterious(0) | probably_damaging(0.977) | TCGA-CK-5916-01 | Colorectum | colon adenocarcinoma | Female | >=65 | I/II | Unknown | Unknown | PD | |
| FNBP1L | SNV | Missense_Mutation | novel | c.397A>G | p.Met133Val | p.M133V | Q5T0N5 | protein_coding | deleterious(0) | possibly_damaging(0.841) | TCGA-AG-3732-01 | Colorectum | rectum adenocarcinoma | Female | >=65 | I/II | Chemotherapy | capecitabine | SD |
| Page: 1 2 3 4 5 |
Top |
Related drugs of malignant transformation related genes |
| Identification of chemicals and drugs interact with genes involved in malignant transfromation |
| (DGIdb 4.0) |
| Entrez ID | Symbol | Category | Interaction Types | Drug Claim Name | Drug Name | PMIDs |
| Page: 1 |

Copyright 2023-Present -The University of Texas Health Science Center at Houston |