Schematic overview of the cellular and molecular mechanisms involved in the cancer progression, including the proposed cellular and molecular mechanisms in cancer cells trajectory. AT1: alveolar type 1 cells; AT2: alveolar type 2 cells; AAH: atypical adenomatous hyperplasia; AIS: adenocarcinoma in situ; MIA: minimally invasive adenocarcinoma; IA: invasive adenocarcinoma; EMT: epithelial-mesenchymal transition

Home

Download

Statistics

Help

Contact

Center for Computational Systems Medicine
leaf

Gene summary

leaf

Malignant transformation analysis

leaf

Malignant transformation related pathway analysis

leaf

Cell-cell communication analysis

leaf

Single-cell gene regulatory network inference analysis

leaf

Somatic mutation of malignant transformation related genes

leaf

Related drugs of malignant transformation related genes

Gene: EPB41L5

Gene summary for EPB41L5

check button Gene summary.

Gene informationSpeciesHuman
Gene symbol

EPB41L5

Gene ID

57669

Gene nameerythrocyte membrane protein band 4.1 like 5
Gene AliasBE37
Cytomap2q14.2
Gene Typeprotein-coding
GO ID

GO:0000578

UniProtAcc

Q9HCM4


Top

Malignant transformation analysis

check button Identification of the aberrant gene expression in precancerous and cancerous lesions by comparing the gene expression of stem-like cells in diseased tissues with normal stem cells
check button Malignant transformation involving gene list.
Entrez IDSymbolReplicatesSpeciesOrganTissueAdj P-valueLog2FCMalignancy
57669EPB41L5CCI_1HumanCervixCC1.27e-036.38e-010.528
57669EPB41L5AEH-subject1HumanEndometriumAEH1.72e-518.78e-01-0.3059
57669EPB41L5AEH-subject2HumanEndometriumAEH2.98e-073.98e-01-0.2525
57669EPB41L5AEH-subject3HumanEndometriumAEH1.34e-195.45e-01-0.2576
57669EPB41L5AEH-subject4HumanEndometriumAEH2.61e-084.65e-01-0.2657
57669EPB41L5AEH-subject5HumanEndometriumAEH1.20e-317.46e-01-0.2953
57669EPB41L5EEC-subject1HumanEndometriumEEC1.26e-368.90e-01-0.2682
57669EPB41L5EEC-subject2HumanEndometriumEEC9.82e-174.64e-01-0.2607
57669EPB41L5EEC-subject3HumanEndometriumEEC8.74e-062.70e-01-0.2525
57669EPB41L5EEC-subject4HumanEndometriumEEC1.61e-114.07e-01-0.2571
57669EPB41L5EEC-subject5HumanEndometriumEEC4.13e-154.96e-01-0.249
57669EPB41L5GSM5276935HumanEndometriumEEC2.16e-041.60e-01-0.123
57669EPB41L5GSM6177621_NYU_UCEC2_lib1_lib1HumanEndometriumEEC1.42e-027.43e-02-0.1934
57669EPB41L5GSM6177622_NYU_UCEC3_lib1_lib1HumanEndometriumEEC7.66e-034.95e-03-0.1917
57669EPB41L5LZE4THumanEsophagusESCC2.17e-073.06e-010.0811
57669EPB41L5LZE20THumanEsophagusESCC5.83e-032.56e-010.0662
57669EPB41L5LZE22THumanEsophagusESCC1.72e-034.49e-010.068
57669EPB41L5LZE24THumanEsophagusESCC1.72e-155.22e-010.0596
57669EPB41L5P1T-EHumanEsophagusESCC9.90e-077.23e-010.0875
57669EPB41L5P2T-EHumanEsophagusESCC1.17e-204.34e-010.1177
Page: 1 2 3 4 5 6 7 

check button Transcriptomic changes along malignancy continuum.
TissueExpression DynamicsAbbreviation
CervixThe image shows the transcriptomic changes along malignancy continuum.log2FC in expression of this searched gene in stem-like cells from each diseased tissue sample relative to stem-like cells in normal samples in each tissue plotted against the malignancy continuum. Samples are colored based on if they are from different disease stage.CC: Cervix cancer
HSIL_HPV: HPV-infected high-grade squamous intraepithelial lesions
N_HPV: HPV-infected normal cervix
EndometriumThe image shows the transcriptomic changes along malignancy continuum.log2FC in expression of this searched gene in stem-like cells from each diseased tissue sample relative to stem-like cells in normal samples in each tissue plotted against the malignancy continuum. Samples are colored based on if they are from different disease stage.
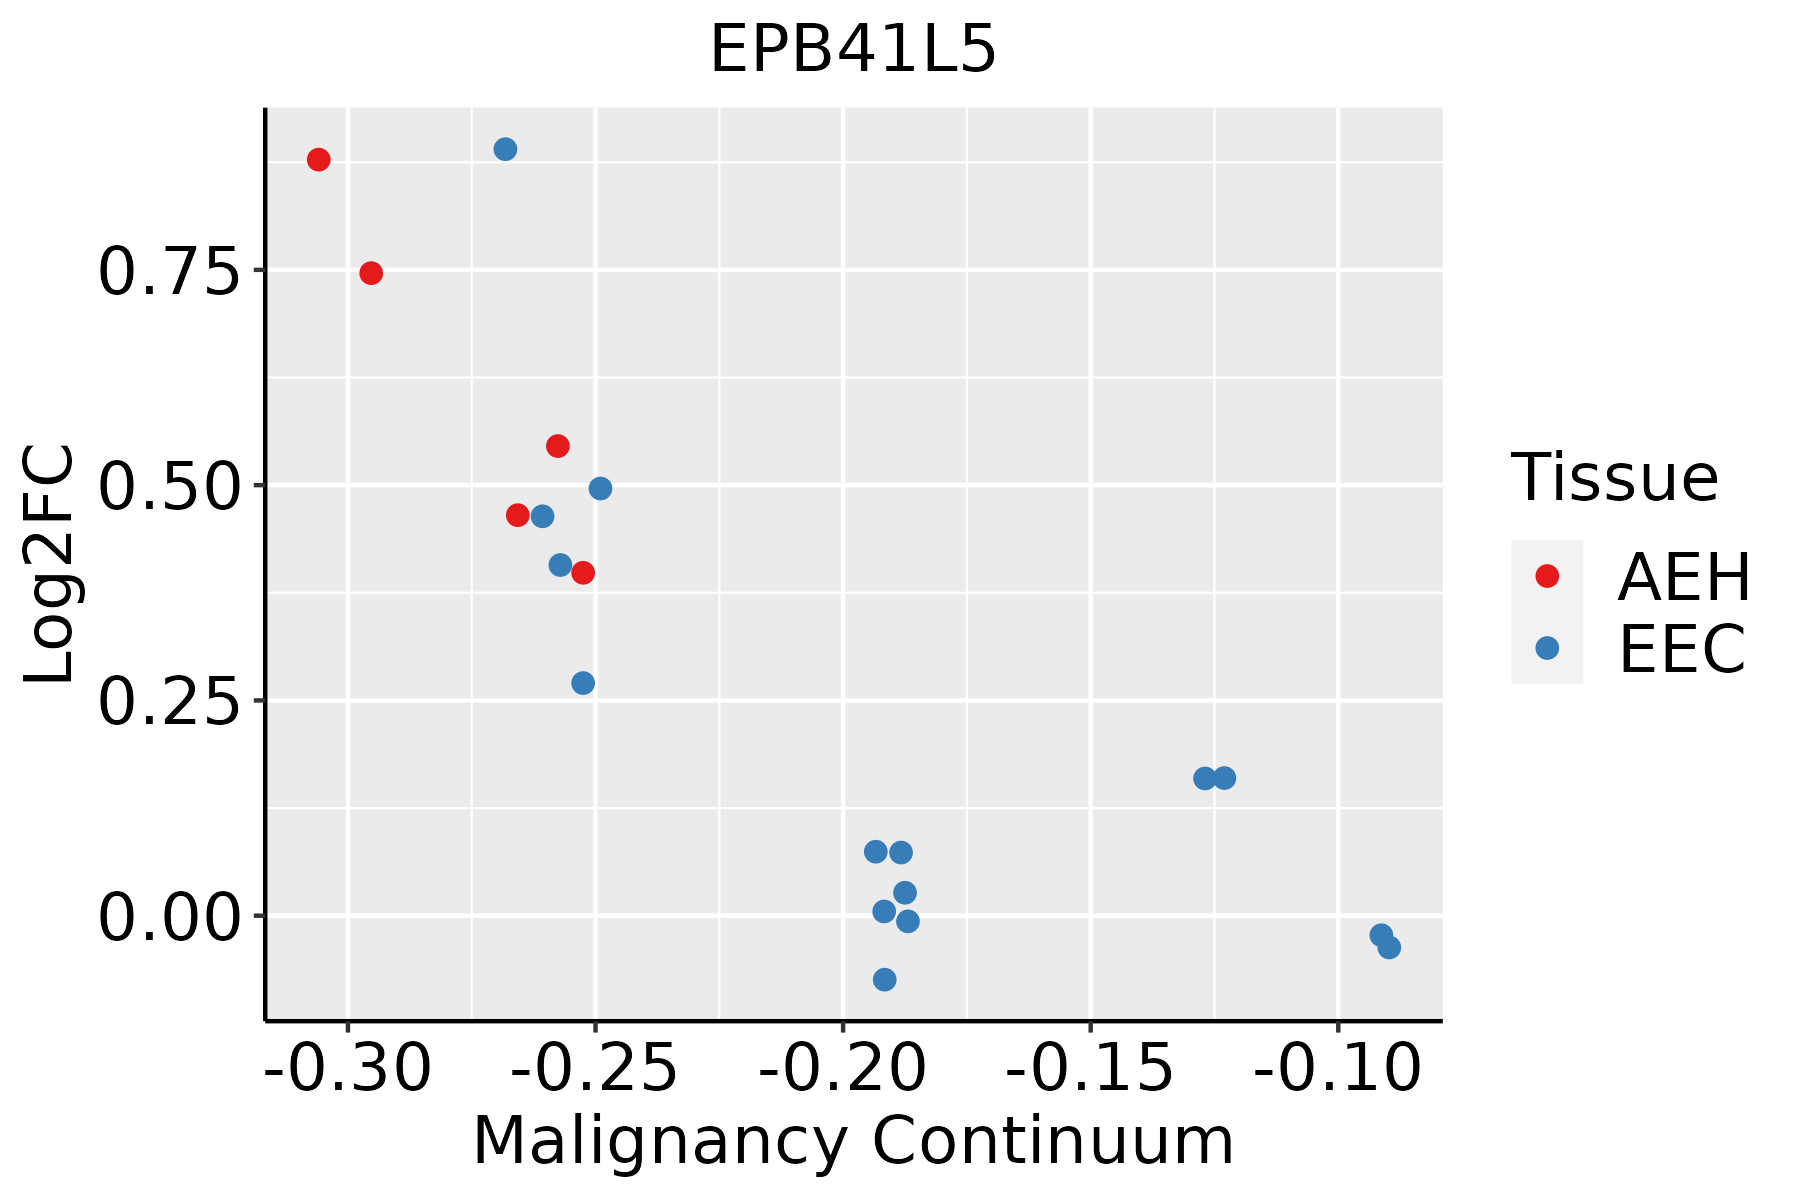
AEH: Atypical endometrial hyperplasia
EEC: Endometrioid Cancer
EsophagusThe image shows the transcriptomic changes along malignancy continuum.log2FC in expression of this searched gene in stem-like cells from each diseased tissue sample relative to stem-like cells in normal samples in each tissue plotted against the malignancy continuum. Samples are colored based on if they are from different disease stage.ESCC: Esophageal squamous cell carcinoma
HGIN: High-grade intraepithelial neoplasias
LGIN: Low-grade intraepithelial neoplasias
LiverThe image shows the transcriptomic changes along malignancy continuum.log2FC in expression of this searched gene in stem-like cells from each diseased tissue sample relative to stem-like cells in normal samples in each tissue plotted against the malignancy continuum. Samples are colored based on if they are from different disease stage.
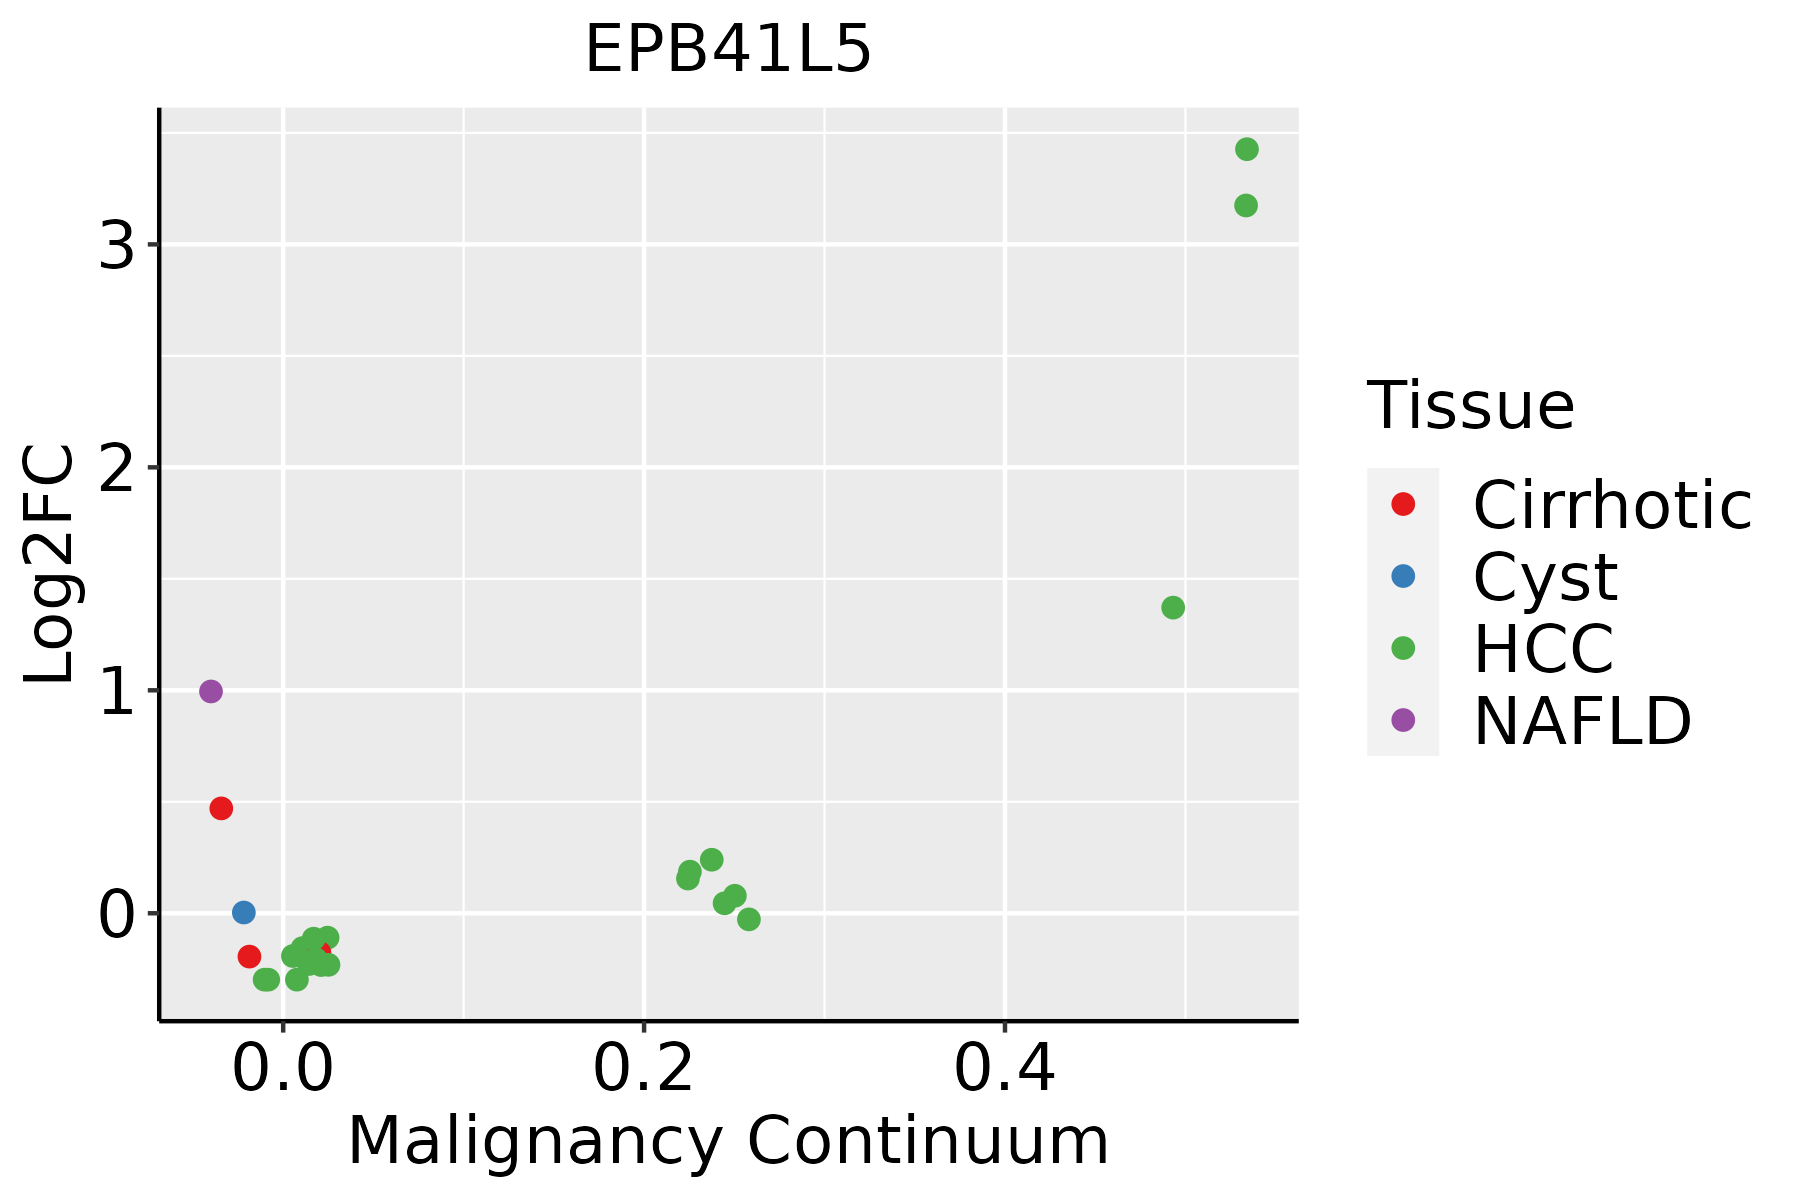
HCC: Hepatocellular carcinoma
NAFLD: Non-alcoholic fatty liver disease
LungThe image shows the transcriptomic changes along malignancy continuum.log2FC in expression of this searched gene in stem-like cells from each diseased tissue sample relative to stem-like cells in normal samples in each tissue plotted against the malignancy continuum. Samples are colored based on if they are from different disease stage.
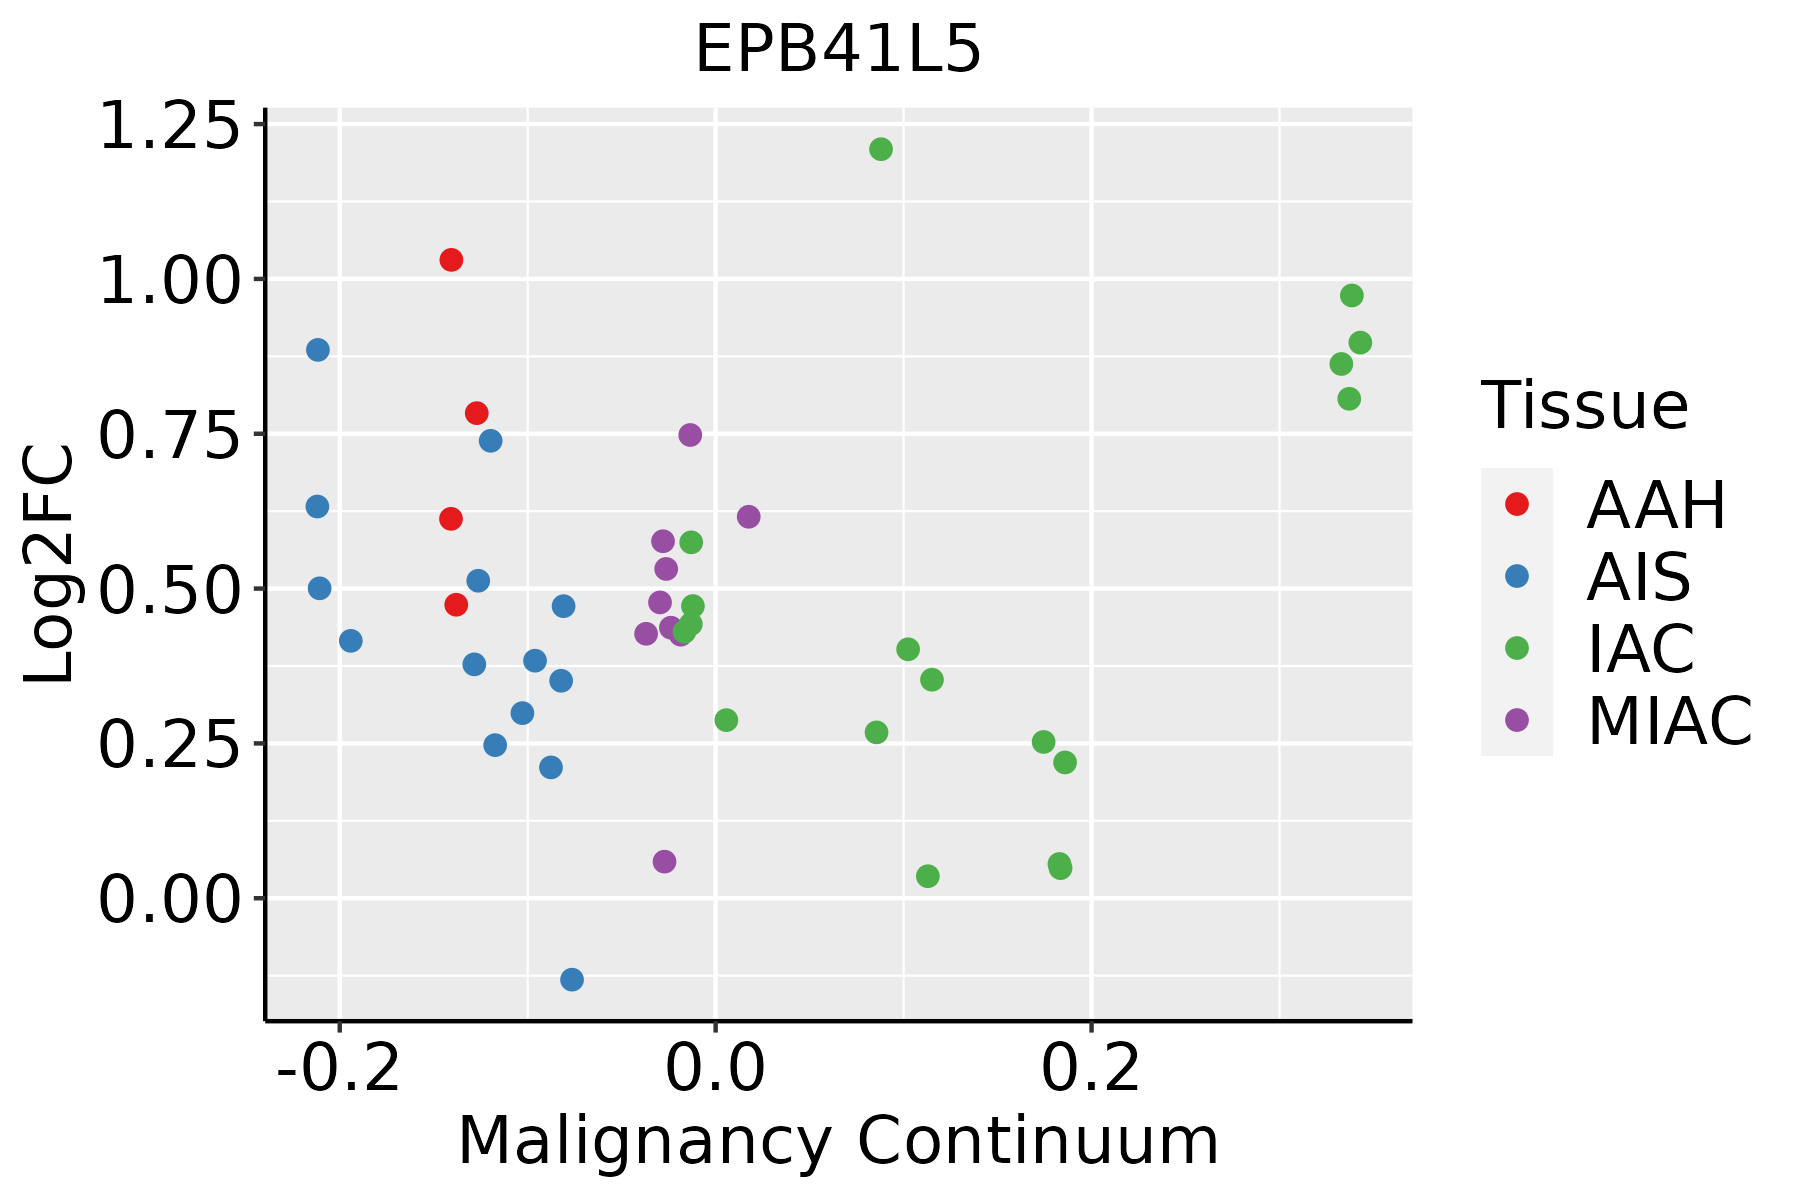
AAH: Atypical adenomatous hyperplasia
AIS: Adenocarcinoma in situ
IAC: Invasive lung adenocarcinoma
MIA: Minimally invasive adenocarcinoma
SkinThe image shows the transcriptomic changes along malignancy continuum.log2FC in expression of this searched gene in stem-like cells from each diseased tissue sample relative to stem-like cells in normal samples in each tissue plotted against the malignancy continuum. Samples are colored based on if they are from different disease stage.
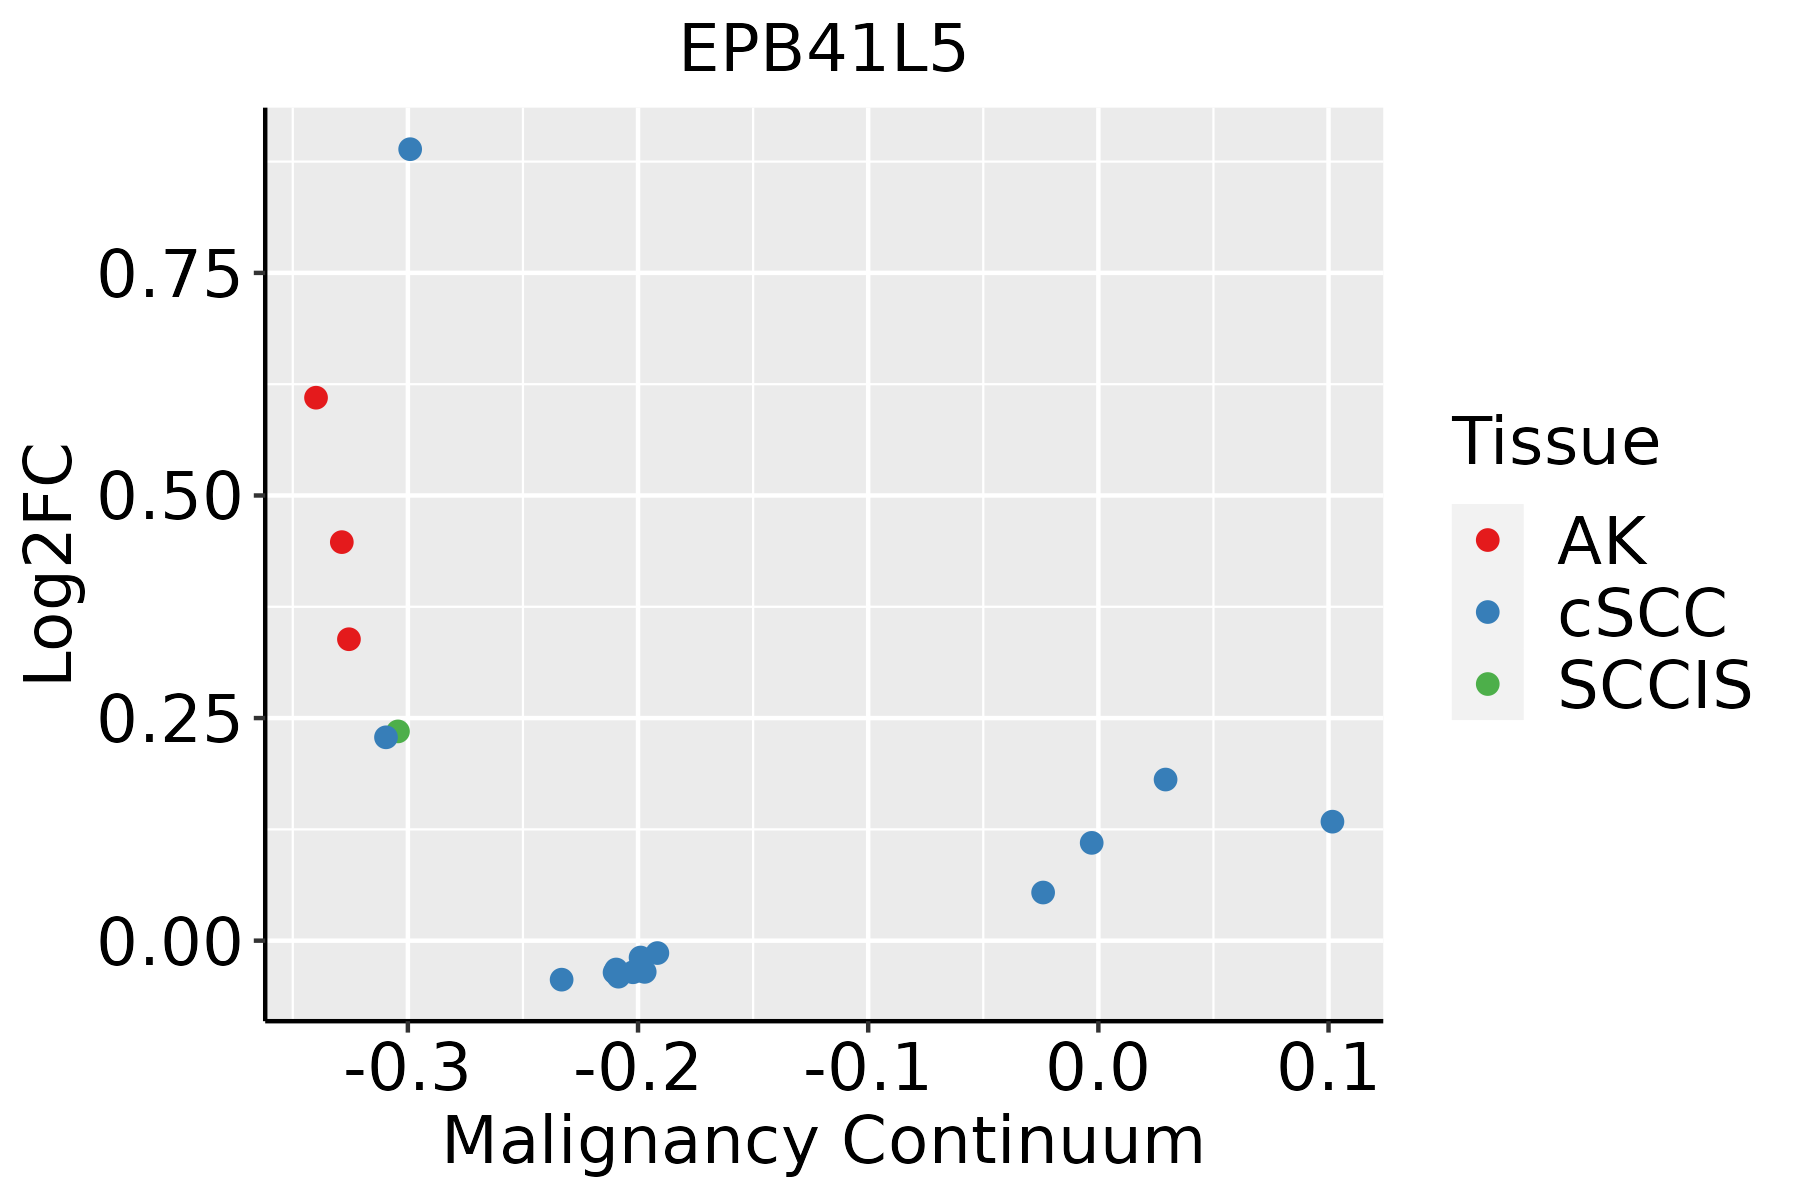
AK: Actinic keratosis
cSCC: Cutaneous squamous cell carcinoma
SCCIS:squamous cell carcinoma in situ
ThyroidThe image shows the transcriptomic changes along malignancy continuum.log2FC in expression of this searched gene in stem-like cells from each diseased tissue sample relative to stem-like cells in normal samples in each tissue plotted against the malignancy continuum. Samples are colored based on if they are from different disease stage.ATC: Anaplastic thyroid cancer
HT: Hashimoto's thyroiditis
PTC: Papillary thyroid cancer
∗log2FC in expression of this searched gene in stem-like cells from each diseased tissue sample relative to stem-like cells in normal samples in each tissue plotted against the malignancy continuum. Samples are colored based on if they are from different disease stage.

Top

Malignant transformation related pathway analysis

check buttonFind out the enriched GO biological processes and KEGG pathways involved in transition from healthy to precancer to cancer
check button Figure of enriched GO biological processes.
TissueDisease StageEnriched GO biological Processes
ColorectumADGO analysis - Figure of enriched GO biological processes: Top 15 enriched GO BP terms are showed in the bar plot of each disease state in each tissue. Each row represents a significant GO biological process which is colored according to the -log10(p.adjust).
ColorectumSERGO analysis - Figure of enriched GO biological processes: Top 15 enriched GO BP terms are showed in the bar plot of each disease state in each tissue. Each row represents a significant GO biological process which is colored according to the -log10(p.adjust).
ColorectumMSSGO analysis - Figure of enriched GO biological processes: Top 15 enriched GO BP terms are showed in the bar plot of each disease state in each tissue. Each row represents a significant GO biological process which is colored according to the -log10(p.adjust).
ColorectumMSI-HGO analysis - Figure of enriched GO biological processes: Top 15 enriched GO BP terms are showed in the bar plot of each disease state in each tissue. Each row represents a significant GO biological process which is colored according to the -log10(p.adjust).
ColorectumFAPGO analysis - Figure of enriched GO biological processes: Top 15 enriched GO BP terms are showed in the bar plot of each disease state in each tissue. Each row represents a significant GO biological process which is colored according to the -log10(p.adjust).
∗Top 15 enriched GO BP terms are showed in the bar plot of each disease state in each tissue. Each row represents a significant GO biological process which is colored according to the -log10(p.adjust).
Page: 1 2 3 4 5 6 7 8 9 

check button Enriched GO biological processes.
GO IDTissueDisease StageDescriptionGene RatioBg Ratiopvaluep.adjustCount
GO:00433937LiverNAFLDregulation of protein binding34/1882196/187231.11e-031.28e-0234
GO:00510997LiverNAFLDpositive regulation of binding30/1882173/187232.11e-032.07e-0230
GO:00019545LiverNAFLDpositive regulation of cell-matrix adhesion13/188258/187234.32e-033.55e-0213
GO:00016676LiverNAFLDameboidal-type cell migration65/1882475/187236.32e-034.69e-0265
GO:005109812LiverCirrhoticregulation of binding148/4634363/187239.14e-125.97e-10148
GO:015011512LiverCirrhoticcell-substrate junction organization51/4634101/187232.08e-087.47e-0751
GO:004339312LiverCirrhoticregulation of protein binding83/4634196/187234.44e-081.42e-0683
GO:005109912LiverCirrhoticpositive regulation of binding74/4634173/187231.44e-073.87e-0674
GO:015011612LiverCirrhoticregulation of cell-substrate junction organization38/463471/187231.84e-074.82e-0638
GO:00017015LiverCirrhoticin utero embryonic development134/4634367/187232.78e-076.86e-06134
GO:001081012LiverCirrhoticregulation of cell-substrate adhesion88/4634221/187234.89e-071.10e-0588
GO:000704412LiverCirrhoticcell-substrate junction assembly46/463495/187234.89e-071.10e-0546
GO:003209211LiverCirrhoticpositive regulation of protein binding41/463485/187232.28e-064.19e-0541
GO:01501171LiverCirrhoticpositive regulation of cell-substrate junction organization21/463433/187232.55e-064.63e-0521
GO:007155911LiverCirrhoticresponse to transforming growth factor beta96/4634256/187233.55e-066.09e-0596
GO:003158912LiverCirrhoticcell-substrate adhesion128/4634363/187234.10e-066.90e-05128
GO:000195211LiverCirrhoticregulation of cell-matrix adhesion55/4634128/187234.64e-067.65e-0555
GO:004804111LiverCirrhoticfocal adhesion assembly41/463487/187234.78e-067.86e-0541
GO:001081112LiverCirrhoticpositive regulation of cell-substrate adhesion53/4634123/187236.21e-069.88e-0553
GO:007156011LiverCirrhoticcellular response to transforming growth factor beta stimulus93/4634250/187237.34e-061.13e-0493
Page: 1 2 3 4 5 6 7 8 9 10 11 12 13 14 15 16 17 18 19 20 21 22 23 24 25 26 27 28 

check button Enriched KEGG pathways.
Pathway IDTissueDisease StageDescriptionGene RatioBg Ratiopvaluep.adjustqvalueCount
Page: 1 

Top

Cell-cell communication analysis

check buttonIdentification of potential cell-cell interactions between two cell types and their ligand-receptor pairs for different disease states
LigandReceptorLRpairPathwayTissueDisease Stage
Page: 1 

Top

Single-cell gene regulatory network inference analysis

check buttonFind out the significant the regulons (TFs) and the target genes of each regulon across cell types for different disease states
TFCell TypeTissueDisease StageTarget GeneRSSRegulon Activity
∗The dot plots of a searched regulon are shown for all cell subpopulations in each disease state of each tissue based on the regulon specific score inferred using pySCENIC and by calculating the average expression.
Page: 1 

Top

Somatic mutation of malignant transformation related genes

check buttonAnnotation of somatic variants for genes involved in malignant transformation
Hugo SymbolVariant ClassVariant ClassificationdbSNP RSHGVScHGVSpHGVSp ShortSWISSPROTBIOTYPESIFTPolyPhenTumor Sample BarcodeTissueHistologySexAgeStageTherapy TypesDrugsOutcome
EPB41L5SNVMissense_Mutationc.391C>Tp.Arg131Cysp.R131CQ9HCM4protein_codingdeleterious(0)probably_damaging(0.912)TCGA-A7-A26F-01Breastbreast invasive carcinomaFemale<65I/IIChemotherapytaxotereSD
EPB41L5SNVMissense_Mutationc.966C>Gp.Phe322Leup.F322LQ9HCM4protein_codingdeleterious(0)probably_damaging(0.999)TCGA-AR-A0TX-01Breastbreast invasive carcinomaFemale<65I/IIUnknownUnknownSD
EPB41L5SNVMissense_Mutationc.1851N>Tp.Met617Ilep.M617IQ9HCM4protein_codingtolerated_low_confidence(0.5)benign(0.003)TCGA-BH-A0DK-01Breastbreast invasive carcinomaFemale<65I/IIHormone TherapytamoxiphenSD
EPB41L5SNVMissense_Mutationnovelc.1279N>Tp.Pro427Serp.P427SQ9HCM4protein_codingtolerated(0.54)benign(0.075)TCGA-D8-A1JF-01Breastbreast invasive carcinomaFemale>=65III/IVUnknownUnknownSD
EPB41L5SNVMissense_Mutationc.274N>Cp.Ala92Prop.A92PQ9HCM4protein_codingtolerated(0.09)probably_damaging(0.994)TCGA-D8-A27F-01Breastbreast invasive carcinomaFemale<65I/IIChemotherapyadriamycin+cyclophosphamideSD
EPB41L5SNVMissense_Mutationnovelc.1900G>Ap.Glu634Lysp.E634KQ9HCM4protein_codingdeleterious_low_confidence(0.04)benign(0.214)TCGA-VS-A9UP-01Cervixcervical & endocervical cancerFemale<65I/IIChemotherapycisplatinPD
EPB41L5SNVMissense_Mutationc.473C>Tp.Thr158Ilep.T158IQ9HCM4protein_codingdeleterious(0.03)probably_damaging(0.989)TCGA-AA-3502-01Colorectumcolon adenocarcinomaMale>=65I/IIUnknownUnknownSD
EPB41L5SNVMissense_Mutationc.563N>Cp.Arg188Thrp.R188TQ9HCM4protein_codingdeleterious(0)probably_damaging(1)TCGA-AA-3697-01Colorectumcolon adenocarcinomaMale>=65I/IIUnknownUnknownSD
EPB41L5SNVMissense_Mutationc.2079A>Tp.Lys693Asnp.K693NQ9HCM4protein_codingtolerated_low_confidence(0.4)benign(0.007)TCGA-AA-3875-01Colorectumcolon adenocarcinomaFemale>=65I/IIUnknownUnknownSD
EPB41L5SNVMissense_Mutationrs150028843c.433C>Gp.Gln145Glup.Q145EQ9HCM4protein_codingdeleterious(0.04)possibly_damaging(0.892)TCGA-AA-3984-01Colorectumcolon adenocarcinomaFemale<65I/IIUnknownUnknownSD
Page: 1 2 3 4 5 6 7 8 9 

Top

Related drugs of malignant transformation related genes

check buttonIdentification of chemicals and drugs interact with genes involved in malignant transfromation
(DGIdb 4.0)
Entrez IDSymbolCategoryInteraction TypesDrug Claim NameDrug NamePMIDs
Page: 1