
|
|||||
|
 | |
| |
| |
| |
| |
| |
|
Gene: CX3CL1 |
Gene summary for CX3CL1 |
| Gene information | Species | Human | Gene symbol | CX3CL1 | Gene ID | 6376 |
| Gene name | C-X3-C motif chemokine ligand 1 | |
| Gene Alias | ABCD-3 | |
| Cytomap | 16q21 | |
| Gene Type | protein-coding | GO ID | GO:0000165 | UniProtAcc | A0N0N7 |
Top |
Malignant transformation analysis |
| Identification of the aberrant gene expression in precancerous and cancerous lesions by comparing the gene expression of stem-like cells in diseased tissues with normal stem cells |
| Entrez ID | Symbol | Replicates | Species | Organ | Tissue | Adj P-value | Log2FC | Malignancy |
| 6376 | CX3CL1 | LZE4T | Human | Esophagus | ESCC | 2.32e-10 | 1.04e-01 | 0.0811 |
| 6376 | CX3CL1 | LZE5T | Human | Esophagus | ESCC | 2.94e-03 | -2.92e-04 | 0.0514 |
| 6376 | CX3CL1 | LZE8T | Human | Esophagus | ESCC | 6.67e-08 | 2.02e-01 | 0.067 |
| 6376 | CX3CL1 | LZE21T | Human | Esophagus | ESCC | 1.83e-05 | 5.53e-01 | 0.0655 |
| 6376 | CX3CL1 | P1T-E | Human | Esophagus | ESCC | 9.34e-05 | 6.28e-01 | 0.0875 |
| 6376 | CX3CL1 | P2T-E | Human | Esophagus | ESCC | 4.34e-04 | 4.40e-01 | 0.1177 |
| 6376 | CX3CL1 | P4T-E | Human | Esophagus | ESCC | 1.33e-11 | -3.29e-02 | 0.1323 |
| 6376 | CX3CL1 | P5T-E | Human | Esophagus | ESCC | 3.37e-06 | 2.72e-01 | 0.1327 |
| 6376 | CX3CL1 | P8T-E | Human | Esophagus | ESCC | 1.20e-36 | 1.27e+00 | 0.0889 |
| 6376 | CX3CL1 | P10T-E | Human | Esophagus | ESCC | 3.73e-05 | -1.81e-01 | 0.116 |
| 6376 | CX3CL1 | P11T-E | Human | Esophagus | ESCC | 2.52e-07 | 7.25e-01 | 0.1426 |
| 6376 | CX3CL1 | P12T-E | Human | Esophagus | ESCC | 3.44e-04 | 1.46e-01 | 0.1122 |
| 6376 | CX3CL1 | P15T-E | Human | Esophagus | ESCC | 6.94e-14 | 5.78e-01 | 0.1149 |
| 6376 | CX3CL1 | P16T-E | Human | Esophagus | ESCC | 3.50e-03 | 2.44e-01 | 0.1153 |
| 6376 | CX3CL1 | P22T-E | Human | Esophagus | ESCC | 1.36e-16 | 4.19e-02 | 0.1236 |
| 6376 | CX3CL1 | P23T-E | Human | Esophagus | ESCC | 2.74e-03 | 6.08e-02 | 0.108 |
| 6376 | CX3CL1 | P26T-E | Human | Esophagus | ESCC | 1.01e-22 | 7.38e-01 | 0.1276 |
| 6376 | CX3CL1 | P27T-E | Human | Esophagus | ESCC | 1.87e-05 | 2.31e-01 | 0.1055 |
| 6376 | CX3CL1 | P30T-E | Human | Esophagus | ESCC | 3.09e-08 | 7.85e-01 | 0.137 |
| 6376 | CX3CL1 | P32T-E | Human | Esophagus | ESCC | 1.11e-08 | 1.12e-01 | 0.1666 |
| Page: 1 2 3 |
| Tissue | Expression Dynamics | Abbreviation |
| Esophagus | 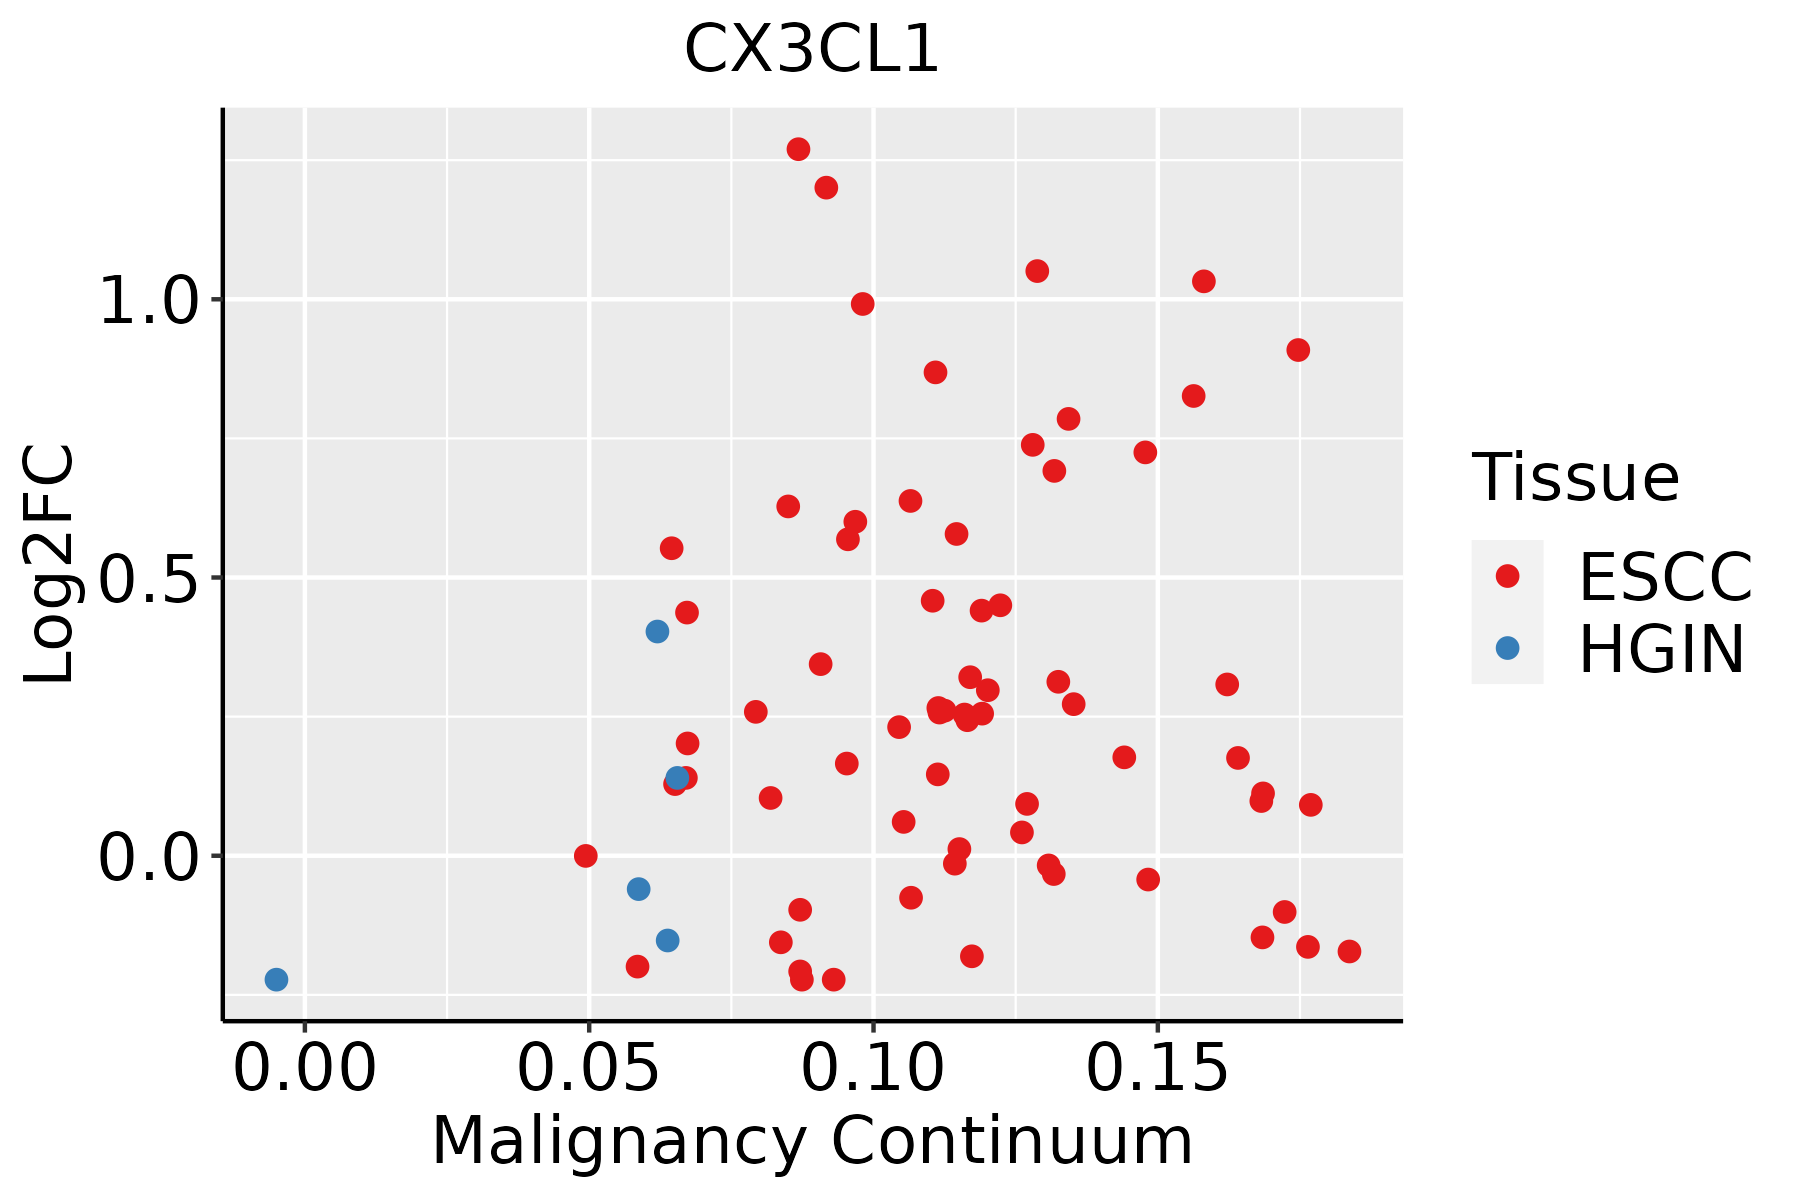 | ESCC: Esophageal squamous cell carcinoma |
| HGIN: High-grade intraepithelial neoplasias | ||
| LGIN: Low-grade intraepithelial neoplasias | ||
| Liver | 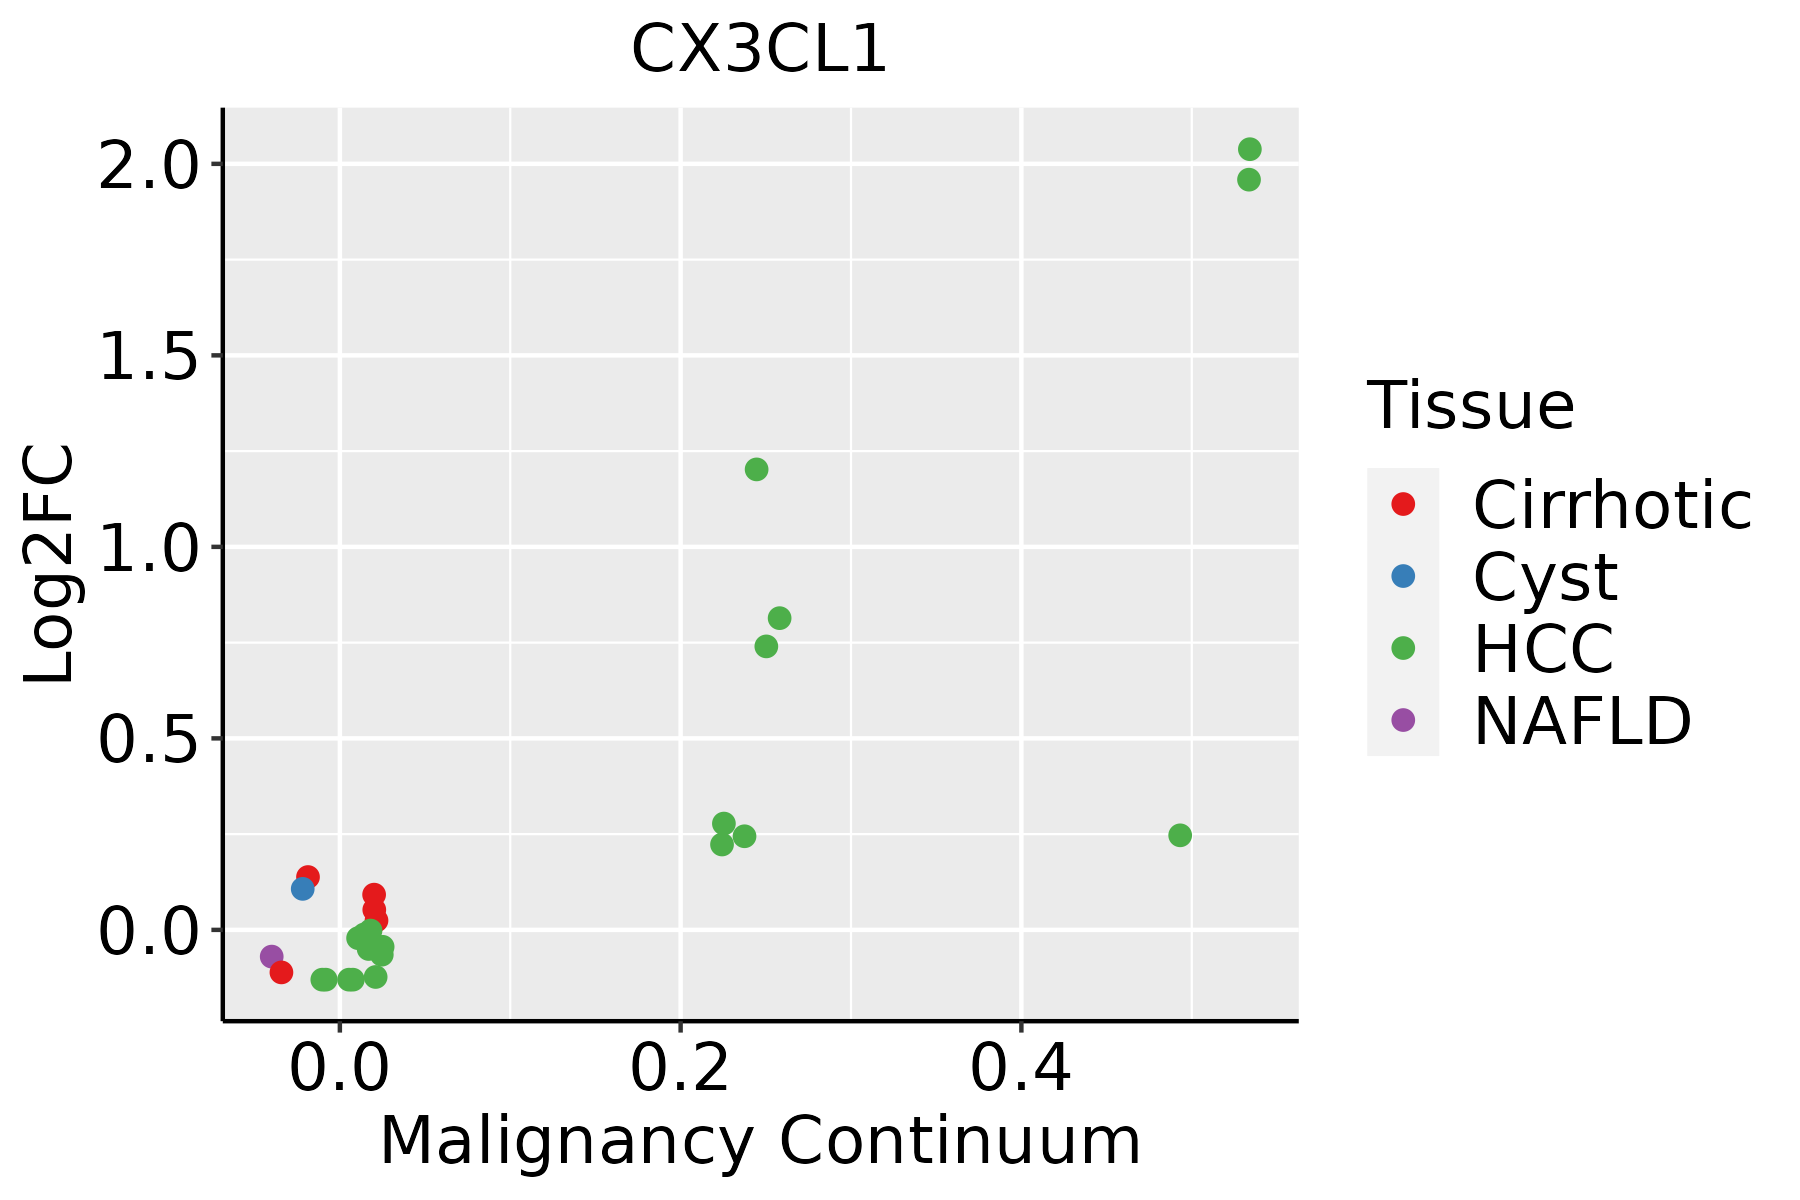 | HCC: Hepatocellular carcinoma |
| NAFLD: Non-alcoholic fatty liver disease | ||
| Oral Cavity |  | EOLP: Erosive Oral lichen planus |
| LP: leukoplakia | ||
| NEOLP: Non-erosive oral lichen planus | ||
| OSCC: Oral squamous cell carcinoma | ||
| Prostate |  | BPH: Benign Prostatic Hyperplasia |
| ∗log2FC in expression of this searched gene in stem-like cells from each diseased tissue sample relative to stem-like cells in normal samples in each tissue plotted against the malignancy continuum. Samples are colored based on if they are from different disease stage. |
Top |
Malignant transformation related pathway analysis |
| Find out the enriched GO biological processes and KEGG pathways involved in transition from healthy to precancer to cancer |
| Tissue | Disease Stage | Enriched GO biological Processes |
| Colorectum | AD |  |
| Colorectum | SER |  |
| Colorectum | MSS |  |
| Colorectum | MSI-H |  |
| Colorectum | FAP |  |
| ∗Top 15 enriched GO BP terms are showed in the bar plot of each disease state in each tissue. Each row represents a significant GO biological process which is colored according to the -log10(p.adjust). |
| Page: 1 2 3 4 5 6 7 8 9 |
| GO ID | Tissue | Disease Stage | Description | Gene Ratio | Bg Ratio | pvalue | p.adjust | Count |
| GO:200123620 | Oral cavity | OSCC | regulation of extrinsic apoptotic signaling pathway | 100/7305 | 151/18723 | 1.07e-11 | 3.90e-10 | 100 |
| GO:007099720 | Oral cavity | OSCC | neuron death | 202/7305 | 361/18723 | 3.75e-11 | 1.23e-09 | 202 |
| GO:190290320 | Oral cavity | OSCC | regulation of supramolecular fiber organization | 211/7305 | 383/18723 | 9.45e-11 | 2.88e-09 | 211 |
| GO:005149518 | Oral cavity | OSCC | positive regulation of cytoskeleton organization | 135/7305 | 226/18723 | 1.98e-10 | 5.66e-09 | 135 |
| GO:005123518 | Oral cavity | OSCC | maintenance of location | 182/7305 | 327/18723 | 6.16e-10 | 1.58e-08 | 182 |
| GO:003461218 | Oral cavity | OSCC | response to tumor necrosis factor | 143/7305 | 253/18723 | 1.09e-08 | 2.23e-07 | 143 |
| GO:190121420 | Oral cavity | OSCC | regulation of neuron death | 174/7305 | 319/18723 | 1.09e-08 | 2.23e-07 | 174 |
| GO:000701520 | Oral cavity | OSCC | actin filament organization | 230/7305 | 442/18723 | 1.37e-08 | 2.77e-07 | 230 |
| GO:00028317 | Oral cavity | OSCC | regulation of response to biotic stimulus | 177/7305 | 327/18723 | 1.73e-08 | 3.43e-07 | 177 |
| GO:003297020 | Oral cavity | OSCC | regulation of actin filament-based process | 209/7305 | 397/18723 | 1.89e-08 | 3.72e-07 | 209 |
| GO:003158917 | Oral cavity | OSCC | cell-substrate adhesion | 193/7305 | 363/18723 | 2.48e-08 | 4.82e-07 | 193 |
| GO:001081019 | Oral cavity | OSCC | regulation of cell-substrate adhesion | 126/7305 | 221/18723 | 4.02e-08 | 7.55e-07 | 126 |
| GO:004578520 | Oral cavity | OSCC | positive regulation of cell adhesion | 225/7305 | 437/18723 | 6.06e-08 | 1.09e-06 | 225 |
| GO:003295620 | Oral cavity | OSCC | regulation of actin cytoskeleton organization | 189/7305 | 358/18723 | 6.81e-08 | 1.21e-06 | 189 |
| GO:005165120 | Oral cavity | OSCC | maintenance of location in cell | 121/7305 | 214/18723 | 1.39e-07 | 2.32e-06 | 121 |
| GO:007135618 | Oral cavity | OSCC | cellular response to tumor necrosis factor | 128/7305 | 229/18723 | 1.49e-07 | 2.49e-06 | 128 |
| GO:011005320 | Oral cavity | OSCC | regulation of actin filament organization | 150/7305 | 278/18723 | 2.68e-07 | 4.15e-06 | 150 |
| GO:00107209 | Oral cavity | OSCC | positive regulation of cell development | 159/7305 | 298/18723 | 3.06e-07 | 4.66e-06 | 159 |
| GO:000195215 | Oral cavity | OSCC | regulation of cell-matrix adhesion | 78/7305 | 128/18723 | 4.05e-07 | 6.02e-06 | 78 |
| GO:005140217 | Oral cavity | OSCC | neuron apoptotic process | 134/7305 | 246/18723 | 5.65e-07 | 8.19e-06 | 134 |
| Page: 1 2 3 4 5 6 7 8 9 10 11 12 13 14 15 16 17 18 19 20 21 22 23 24 |
| Pathway ID | Tissue | Disease Stage | Description | Gene Ratio | Bg Ratio | pvalue | p.adjust | qvalue | Count |
| hsa0466810 | Esophagus | ESCC | TNF signaling pathway | 89/4205 | 114/8465 | 3.36e-10 | 4.01e-09 | 2.06e-09 | 89 |
| hsa05163210 | Esophagus | ESCC | Human cytomegalovirus infection | 148/4205 | 225/8465 | 5.73e-07 | 4.00e-06 | 2.05e-06 | 148 |
| hsa0466817 | Esophagus | ESCC | TNF signaling pathway | 89/4205 | 114/8465 | 3.36e-10 | 4.01e-09 | 2.06e-09 | 89 |
| hsa0516338 | Esophagus | ESCC | Human cytomegalovirus infection | 148/4205 | 225/8465 | 5.73e-07 | 4.00e-06 | 2.05e-06 | 148 |
| hsa0516312 | Liver | Cirrhotic | Human cytomegalovirus infection | 87/2530 | 225/8465 | 2.67e-03 | 1.10e-02 | 6.76e-03 | 87 |
| hsa0516313 | Liver | Cirrhotic | Human cytomegalovirus infection | 87/2530 | 225/8465 | 2.67e-03 | 1.10e-02 | 6.76e-03 | 87 |
| hsa046684 | Liver | HCC | TNF signaling pathway | 73/4020 | 114/8465 | 2.53e-04 | 1.19e-03 | 6.63e-04 | 73 |
| hsa0516322 | Liver | HCC | Human cytomegalovirus infection | 131/4020 | 225/8465 | 6.86e-04 | 2.77e-03 | 1.54e-03 | 131 |
| hsa0466811 | Liver | HCC | TNF signaling pathway | 73/4020 | 114/8465 | 2.53e-04 | 1.19e-03 | 6.63e-04 | 73 |
| hsa0516332 | Liver | HCC | Human cytomegalovirus infection | 131/4020 | 225/8465 | 6.86e-04 | 2.77e-03 | 1.54e-03 | 131 |
| hsa0516326 | Prostate | BPH | Human cytomegalovirus infection | 74/1718 | 225/8465 | 4.87e-06 | 3.92e-05 | 2.43e-05 | 74 |
| hsa046688 | Prostate | BPH | TNF signaling pathway | 41/1718 | 114/8465 | 6.86e-05 | 4.35e-04 | 2.69e-04 | 41 |
| hsa05163111 | Prostate | BPH | Human cytomegalovirus infection | 74/1718 | 225/8465 | 4.87e-06 | 3.92e-05 | 2.43e-05 | 74 |
| hsa0466815 | Prostate | BPH | TNF signaling pathway | 41/1718 | 114/8465 | 6.86e-05 | 4.35e-04 | 2.69e-04 | 41 |
| hsa0516327 | Prostate | Tumor | Human cytomegalovirus infection | 74/1791 | 225/8465 | 2.27e-05 | 1.79e-04 | 1.11e-04 | 74 |
| hsa0466821 | Prostate | Tumor | TNF signaling pathway | 40/1791 | 114/8465 | 3.88e-04 | 2.07e-03 | 1.29e-03 | 40 |
| hsa0516336 | Prostate | Tumor | Human cytomegalovirus infection | 74/1791 | 225/8465 | 2.27e-05 | 1.79e-04 | 1.11e-04 | 74 |
| hsa0466831 | Prostate | Tumor | TNF signaling pathway | 40/1791 | 114/8465 | 3.88e-04 | 2.07e-03 | 1.29e-03 | 40 |
| Page: 1 |
Top |
Cell-cell communication analysis |
| Identification of potential cell-cell interactions between two cell types and their ligand-receptor pairs for different disease states |
| Ligand | Receptor | LRpair | Pathway | Tissue | Disease Stage |
| CX3CL1 | CX3CR1 | CX3CL1_CX3CR1 | CX3C | Breast | ADJ |
| CX3CL1 | CX3CR1 | CX3CL1_CX3CR1 | CX3C | Breast | Healthy |
| CX3CL1 | CX3CR1 | CX3CL1_CX3CR1 | CX3C | Lung | ADJ |
| CX3CL1 | CX3CR1 | CX3CL1_CX3CR1 | CX3C | Lung | MIAC |
| CX3CL1 | CX3CR1 | CX3CL1_CX3CR1 | CX3C | Prostate | ADJ |
| CX3CL1 | CX3CR1 | CX3CL1_CX3CR1 | CX3C | Prostate | BPH |
| CX3CL1 | CX3CR1 | CX3CL1_CX3CR1 | CX3C | THCA | ADJ |
| CX3CL1 | CX3CR1 | CX3CL1_CX3CR1 | CX3C | THCA | Cancer |
| CX3CL1 | CX3CR1 | CX3CL1_CX3CR1 | CX3C | THCA | PTC |
| Page: 1 |
Top |
Single-cell gene regulatory network inference analysis |
| Find out the significant the regulons (TFs) and the target genes of each regulon across cell types for different disease states |
| TF | Cell Type | Tissue | Disease Stage | Target Gene | RSS | Regulon Activity |
| ∗The dot plots of a searched regulon are shown for all cell subpopulations in each disease state of each tissue based on the regulon specific score inferred using pySCENIC and by calculating the average expression. |
| Page: 1 |
Top |
Somatic mutation of malignant transformation related genes |
| Annotation of somatic variants for genes involved in malignant transformation |
| Hugo Symbol | Variant Class | Variant Classification | dbSNP RS | HGVSc | HGVSp | HGVSp Short | SWISSPROT | BIOTYPE | SIFT | PolyPhen | Tumor Sample Barcode | Tissue | Histology | Sex | Age | Stage | Therapy Types | Drugs | Outcome |
| CX3CL1 | SNV | Missense_Mutation | rs760976659 | c.270N>A | p.Asp90Glu | p.D90E | P78423 | protein_coding | tolerated(0.06) | benign(0.065) | TCGA-A8-A0A7-01 | Breast | breast invasive carcinoma | Female | <65 | I/II | Unknown | Unknown | SD |
| CX3CL1 | SNV | Missense_Mutation | c.575N>G | p.Ser192Cys | p.S192C | P78423 | protein_coding | deleterious(0) | possibly_damaging(0.707) | TCGA-AC-A23H-01 | Breast | breast invasive carcinoma | Female | >=65 | I/II | Unknown | Unknown | PD | |
| CX3CL1 | SNV | Missense_Mutation | c.184G>A | p.Ala62Thr | p.A62T | P78423 | protein_coding | deleterious(0.05) | probably_damaging(0.968) | TCGA-AR-A252-01 | Breast | breast invasive carcinoma | Female | <65 | I/II | Chemotherapy | doxorubicin | SD | |
| CX3CL1 | SNV | Missense_Mutation | novel | c.875N>G | p.Ser292Cys | p.S292C | P78423 | protein_coding | deleterious(0.01) | probably_damaging(0.936) | TCGA-C5-A1MH-01 | Cervix | cervical & endocervical cancer | Female | >=65 | III/IV | Chemotherapy | cisplatin | PD |
| CX3CL1 | SNV | Missense_Mutation | c.649N>A | p.Glu217Lys | p.E217K | P78423 | protein_coding | tolerated(0.13) | benign(0.147) | TCGA-C5-A1MJ-01 | Cervix | cervical & endocervical cancer | Female | <65 | I/II | Unknown | Unknown | SD | |
| CX3CL1 | SNV | Missense_Mutation | c.761N>T | p.Pro254Leu | p.P254L | P78423 | protein_coding | tolerated(0.13) | benign(0.001) | TCGA-IR-A3LI-01 | Cervix | cervical & endocervical cancer | Female | <65 | I/II | Chemotherapy | cisplatin | CR | |
| CX3CL1 | SNV | Missense_Mutation | novel | c.293N>A | p.Arg98Gln | p.R98Q | P78423 | protein_coding | tolerated(1) | benign(0) | TCGA-JW-A5VL-01 | Cervix | cervical & endocervical cancer | Female | <65 | I/II | Unknown | Unknown | SD |
| CX3CL1 | SNV | Missense_Mutation | novel | c.528N>T | p.Gln176His | p.Q176H | P78423 | protein_coding | tolerated(0.14) | benign(0.215) | TCGA-ZJ-AAXF-01 | Cervix | cervical & endocervical cancer | Female | <65 | I/II | Unknown | Unknown | SD |
| CX3CL1 | SNV | Missense_Mutation | c.824T>A | p.Phe275Tyr | p.F275Y | P78423 | protein_coding | deleterious(0) | possibly_damaging(0.693) | TCGA-CK-4951-01 | Colorectum | colon adenocarcinoma | Female | >=65 | I/II | Unknown | Unknown | PD | |
| CX3CL1 | SNV | Missense_Mutation | c.362N>C | p.Met121Thr | p.M121T | P78423 | protein_coding | tolerated(0.51) | benign(0) | TCGA-CM-5861-01 | Colorectum | colon adenocarcinoma | Female | <65 | I/II | Unknown | Unknown | PD |
| Page: 1 2 3 4 5 |
Top |
Related drugs of malignant transformation related genes |
| Identification of chemicals and drugs interact with genes involved in malignant transfromation |
| (DGIdb 4.0) |
| Entrez ID | Symbol | Category | Interaction Types | Drug Claim Name | Drug Name | PMIDs |
| 6376 | CX3CL1 | CELL SURFACE, DRUGGABLE GENOME | COMPLETE FREUND&APOS;S ADJUVANT | 15993821 | ||
| 6376 | CX3CL1 | CELL SURFACE, DRUGGABLE GENOME | ATEZOLIZUMAB | ATEZOLIZUMAB | 25428504 |
| Page: 1 |

Copyright 2023-Present -The University of Texas Health Science Center at Houston |