
|
|||||
|
 | |
| |
| |
| |
| |
| |
|
Gene: CPT1A |
Gene summary for CPT1A |
| Gene information | Species | Human | Gene symbol | CPT1A | Gene ID | 1374 |
| Gene name | carnitine palmitoyltransferase 1A | |
| Gene Alias | CPT1 | |
| Cytomap | 11q13.3 | |
| Gene Type | protein-coding | GO ID | GO:0001676 | UniProtAcc | P50416 |
Top |
Malignant transformation analysis |
| Identification of the aberrant gene expression in precancerous and cancerous lesions by comparing the gene expression of stem-like cells in diseased tissues with normal stem cells |
| Entrez ID | Symbol | Replicates | Species | Organ | Tissue | Adj P-value | Log2FC | Malignancy |
| 1374 | CPT1A | HTA11_3410_2000001011 | Human | Colorectum | AD | 4.48e-05 | -2.95e-01 | 0.0155 |
| 1374 | CPT1A | HTA11_347_2000001011 | Human | Colorectum | AD | 7.05e-37 | 1.23e+00 | -0.1954 |
| 1374 | CPT1A | HTA11_83_2000001011 | Human | Colorectum | SER | 6.79e-04 | 5.63e-01 | -0.1526 |
| 1374 | CPT1A | HTA11_5212_2000001011 | Human | Colorectum | AD | 5.29e-03 | 6.30e-01 | -0.2061 |
| 1374 | CPT1A | HTA11_99999970781_79442 | Human | Colorectum | MSS | 7.27e-04 | -2.96e-01 | 0.294 |
| 1374 | CPT1A | HTA11_99999974143_84620 | Human | Colorectum | MSS | 1.25e-15 | -4.29e-01 | 0.3005 |
| 1374 | CPT1A | F007 | Human | Colorectum | FAP | 1.90e-08 | -5.04e-01 | 0.1176 |
| 1374 | CPT1A | A002-C-010 | Human | Colorectum | FAP | 2.21e-15 | -4.96e-01 | 0.242 |
| 1374 | CPT1A | A001-C-207 | Human | Colorectum | FAP | 2.59e-14 | -6.02e-01 | 0.1278 |
| 1374 | CPT1A | A015-C-203 | Human | Colorectum | FAP | 9.80e-36 | -5.12e-01 | -0.1294 |
| 1374 | CPT1A | A015-C-204 | Human | Colorectum | FAP | 3.17e-07 | -2.72e-01 | -0.0228 |
| 1374 | CPT1A | A014-C-040 | Human | Colorectum | FAP | 1.84e-08 | -5.86e-01 | -0.1184 |
| 1374 | CPT1A | A002-C-201 | Human | Colorectum | FAP | 3.61e-20 | -5.05e-01 | 0.0324 |
| 1374 | CPT1A | A002-C-203 | Human | Colorectum | FAP | 3.83e-15 | -4.45e-01 | 0.2786 |
| 1374 | CPT1A | A001-C-119 | Human | Colorectum | FAP | 3.77e-07 | -4.66e-01 | -0.1557 |
| 1374 | CPT1A | A001-C-108 | Human | Colorectum | FAP | 2.66e-24 | -5.04e-01 | -0.0272 |
| 1374 | CPT1A | A002-C-021 | Human | Colorectum | FAP | 6.73e-05 | -2.87e-01 | 0.1171 |
| 1374 | CPT1A | A002-C-205 | Human | Colorectum | FAP | 7.21e-30 | -5.82e-01 | -0.1236 |
| 1374 | CPT1A | A001-C-104 | Human | Colorectum | FAP | 1.72e-08 | -2.77e-01 | 0.0184 |
| 1374 | CPT1A | A015-C-005 | Human | Colorectum | FAP | 8.57e-12 | -4.51e-01 | -0.0336 |
| Page: 1 2 3 4 5 6 |
| Tissue | Expression Dynamics | Abbreviation |
| Colorectum (GSE201348) |  | FAP: Familial adenomatous polyposis |
| CRC: Colorectal cancer | ||
| Colorectum (HTA11) |  | AD: Adenomas |
| SER: Sessile serrated lesions | ||
| MSI-H: Microsatellite-high colorectal cancer | ||
| MSS: Microsatellite stable colorectal cancer | ||
| Esophagus | 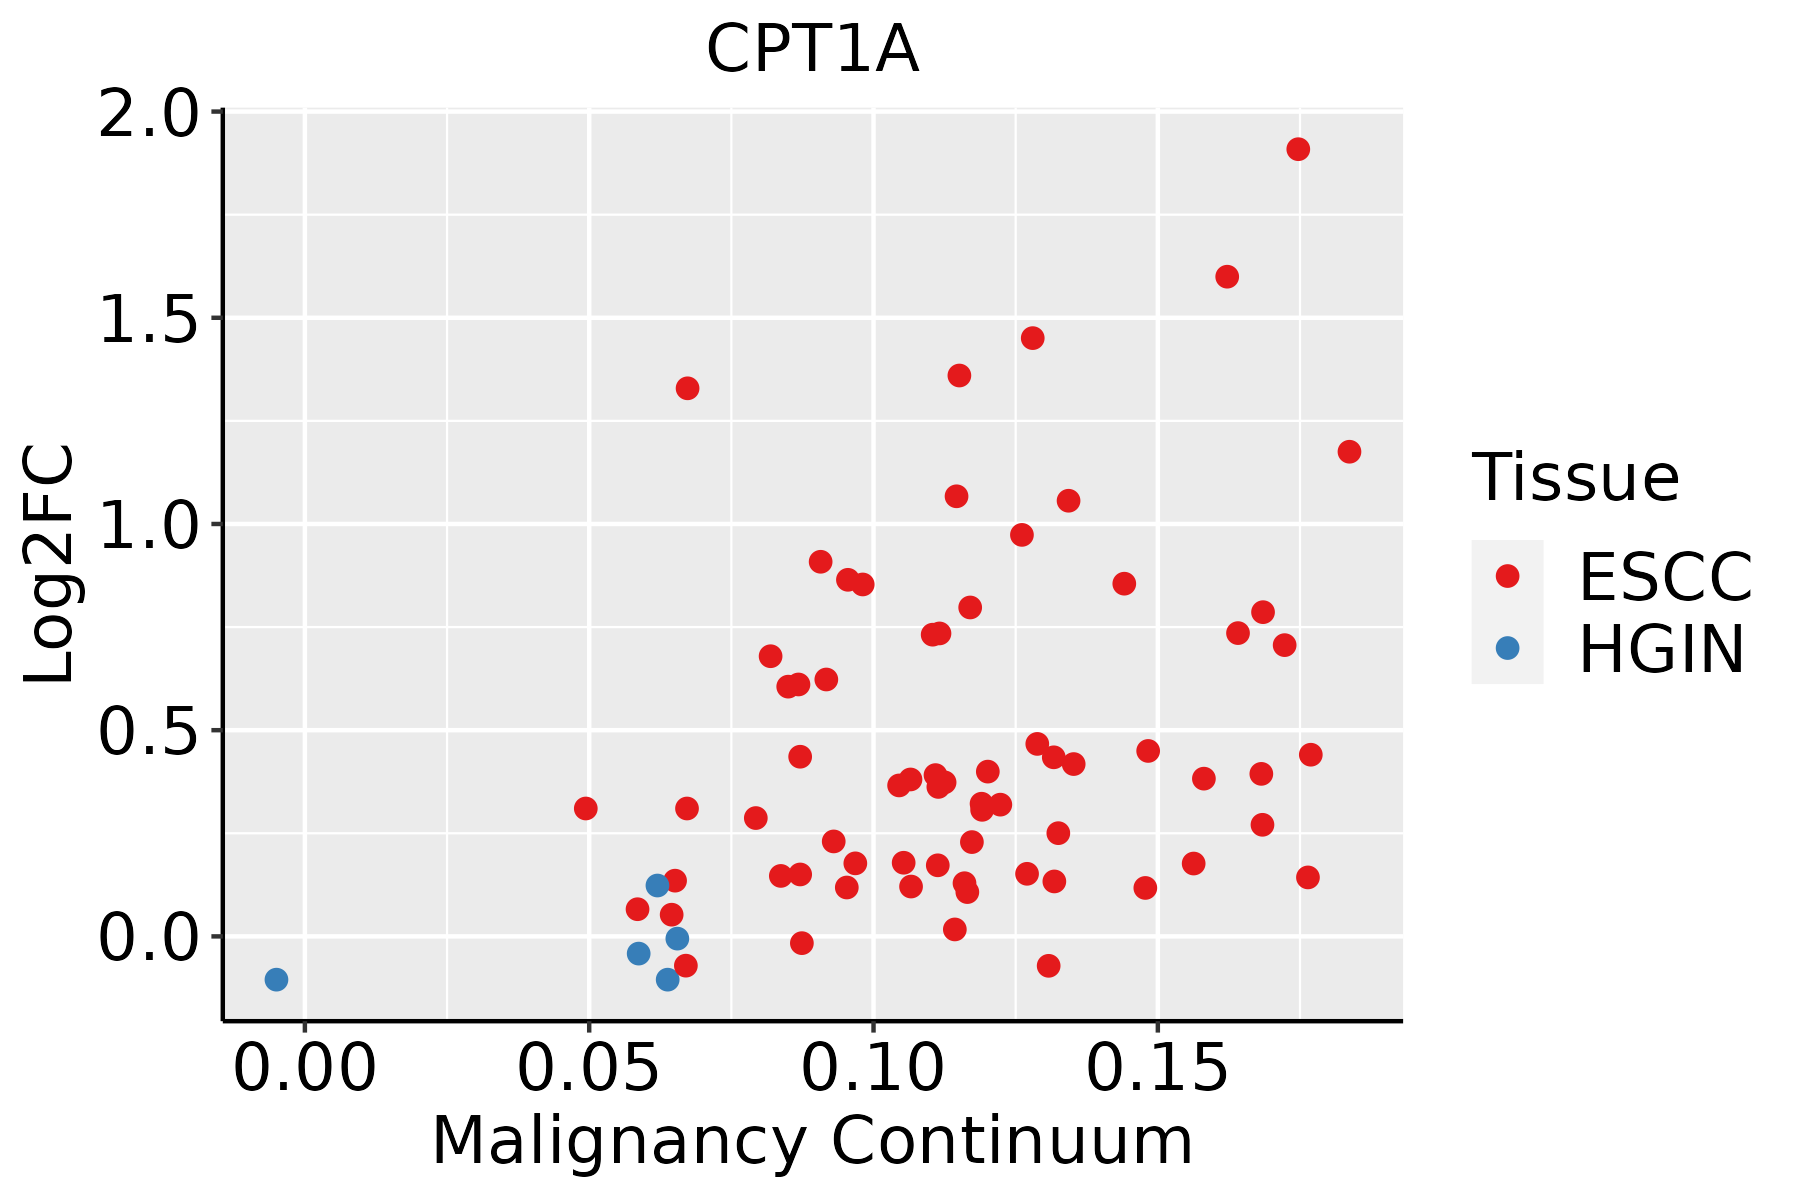 | ESCC: Esophageal squamous cell carcinoma |
| HGIN: High-grade intraepithelial neoplasias | ||
| LGIN: Low-grade intraepithelial neoplasias | ||
| Liver | 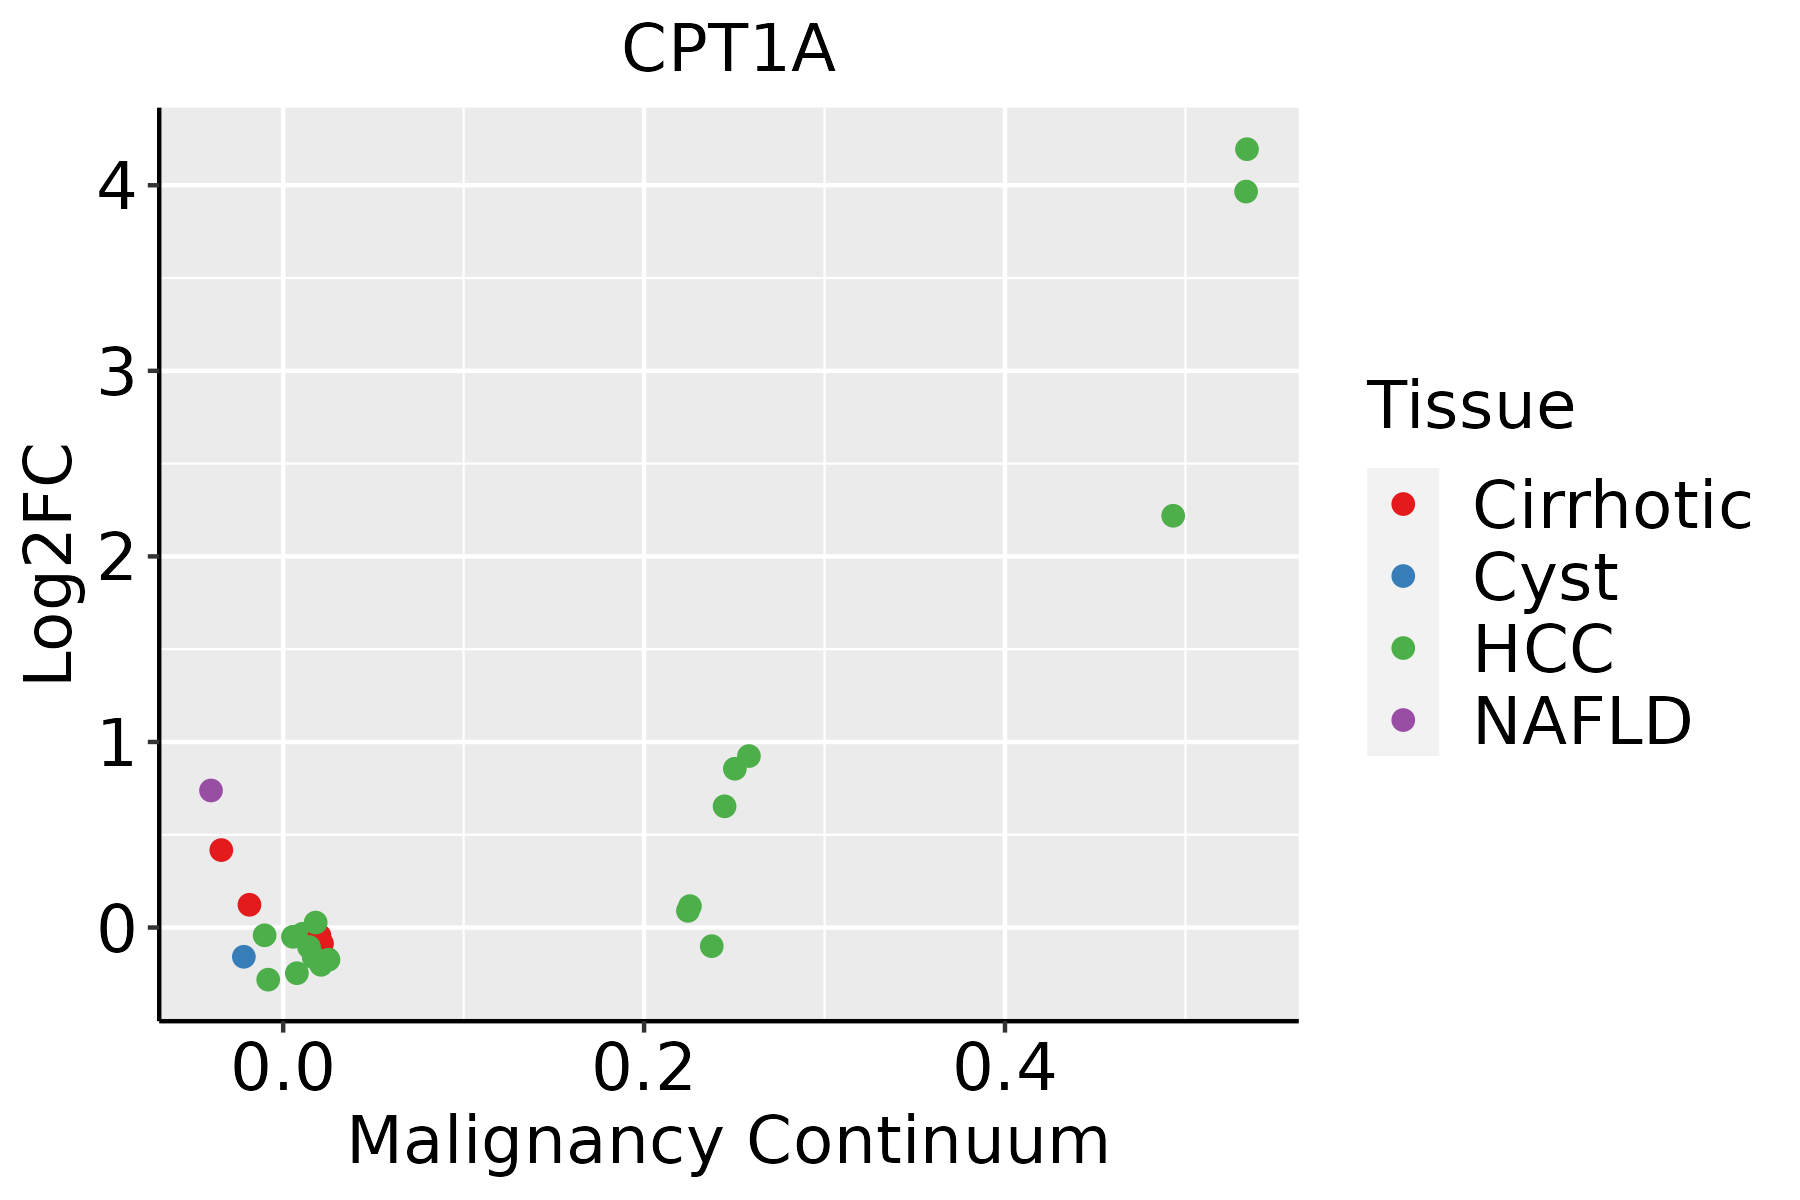 | HCC: Hepatocellular carcinoma |
| NAFLD: Non-alcoholic fatty liver disease |
| ∗log2FC in expression of this searched gene in stem-like cells from each diseased tissue sample relative to stem-like cells in normal samples in each tissue plotted against the malignancy continuum. Samples are colored based on if they are from different disease stage. |
Top |
Malignant transformation related pathway analysis |
| Find out the enriched GO biological processes and KEGG pathways involved in transition from healthy to precancer to cancer |
| Tissue | Disease Stage | Enriched GO biological Processes |
| Colorectum | AD |  |
| Colorectum | SER |  |
| Colorectum | MSS |  |
| Colorectum | MSI-H |  |
| Colorectum | FAP |  |
| ∗Top 15 enriched GO BP terms are showed in the bar plot of each disease state in each tissue. Each row represents a significant GO biological process which is colored according to the -log10(p.adjust). |
| Page: 1 2 3 4 5 6 7 8 9 |
| GO ID | Tissue | Disease Stage | Description | Gene Ratio | Bg Ratio | pvalue | p.adjust | Count |
| GO:0006839110 | Esophagus | ESCC | mitochondrial transport | 187/8552 | 254/18723 | 8.35e-20 | 9.81e-18 | 187 |
| GO:0048732111 | Esophagus | ESCC | gland development | 269/8552 | 436/18723 | 7.81e-12 | 2.95e-10 | 269 |
| GO:0031667111 | Esophagus | ESCC | response to nutrient levels | 289/8552 | 474/18723 | 9.25e-12 | 3.47e-10 | 289 |
| GO:0051235110 | Esophagus | ESCC | maintenance of location | 200/8552 | 327/18723 | 1.01e-08 | 2.02e-07 | 200 |
| GO:00059969 | Esophagus | ESCC | monosaccharide metabolic process | 159/8552 | 257/18723 | 1.11e-07 | 1.81e-06 | 159 |
| GO:00193189 | Esophagus | ESCC | hexose metabolic process | 147/8552 | 237/18723 | 2.63e-07 | 3.94e-06 | 147 |
| GO:1990542110 | Esophagus | ESCC | mitochondrial transmembrane transport | 72/8552 | 102/18723 | 2.94e-07 | 4.23e-06 | 72 |
| GO:0061008110 | Esophagus | ESCC | hepaticobiliary system development | 98/8552 | 150/18723 | 8.91e-07 | 1.15e-05 | 98 |
| GO:0001889110 | Esophagus | ESCC | liver development | 96/8552 | 147/18723 | 1.18e-06 | 1.47e-05 | 96 |
| GO:003109910 | Esophagus | ESCC | regeneration | 122/8552 | 198/18723 | 4.26e-06 | 4.57e-05 | 122 |
| GO:00193958 | Esophagus | ESCC | fatty acid oxidation | 69/8552 | 103/18723 | 9.95e-06 | 9.44e-05 | 69 |
| GO:00060069 | Esophagus | ESCC | glucose metabolic process | 119/8552 | 196/18723 | 1.51e-05 | 1.36e-04 | 119 |
| GO:00344407 | Esophagus | ESCC | lipid oxidation | 71/8552 | 108/18723 | 2.00e-05 | 1.74e-04 | 71 |
| GO:00090628 | Esophagus | ESCC | fatty acid catabolic process | 66/8552 | 100/18723 | 3.21e-05 | 2.66e-04 | 66 |
| GO:00066318 | Esophagus | ESCC | fatty acid metabolic process | 217/8552 | 390/18723 | 4.21e-05 | 3.39e-04 | 217 |
| GO:000941020 | Esophagus | ESCC | response to xenobiotic stimulus | 253/8552 | 462/18723 | 4.55e-05 | 3.58e-04 | 253 |
| GO:00199155 | Esophagus | ESCC | lipid storage | 58/8552 | 87/18723 | 6.15e-05 | 4.72e-04 | 58 |
| GO:00065757 | Esophagus | ESCC | cellular modified amino acid metabolic process | 112/8552 | 188/18723 | 8.31e-05 | 6.06e-04 | 112 |
| GO:00066358 | Esophagus | ESCC | fatty acid beta-oxidation | 50/8552 | 74/18723 | 1.16e-04 | 8.04e-04 | 50 |
| GO:00466774 | Esophagus | ESCC | response to antibiotic | 34/8552 | 47/18723 | 1.91e-04 | 1.21e-03 | 34 |
| Page: 1 2 3 4 5 6 7 8 9 10 11 12 13 14 15 16 17 18 19 20 |
| Pathway ID | Tissue | Disease Stage | Description | Gene Ratio | Bg Ratio | pvalue | p.adjust | qvalue | Count |
| hsa04714 | Colorectum | AD | Thermogenesis | 120/2092 | 232/8465 | 2.76e-19 | 1.16e-17 | 7.37e-18 | 120 |
| hsa04152 | Colorectum | AD | AMPK signaling pathway | 47/2092 | 121/8465 | 3.74e-04 | 2.82e-03 | 1.80e-03 | 47 |
| hsa04922 | Colorectum | AD | Glucagon signaling pathway | 41/2092 | 107/8465 | 1.18e-03 | 7.75e-03 | 4.94e-03 | 41 |
| hsa00071 | Colorectum | AD | Fatty acid degradation | 20/2092 | 43/8465 | 1.50e-03 | 8.69e-03 | 5.54e-03 | 20 |
| hsa047141 | Colorectum | AD | Thermogenesis | 120/2092 | 232/8465 | 2.76e-19 | 1.16e-17 | 7.37e-18 | 120 |
| hsa041521 | Colorectum | AD | AMPK signaling pathway | 47/2092 | 121/8465 | 3.74e-04 | 2.82e-03 | 1.80e-03 | 47 |
| hsa049221 | Colorectum | AD | Glucagon signaling pathway | 41/2092 | 107/8465 | 1.18e-03 | 7.75e-03 | 4.94e-03 | 41 |
| hsa000711 | Colorectum | AD | Fatty acid degradation | 20/2092 | 43/8465 | 1.50e-03 | 8.69e-03 | 5.54e-03 | 20 |
| hsa047142 | Colorectum | SER | Thermogenesis | 106/1580 | 232/8465 | 1.15e-21 | 6.34e-20 | 4.61e-20 | 106 |
| hsa049222 | Colorectum | SER | Glucagon signaling pathway | 38/1580 | 107/8465 | 2.57e-05 | 3.28e-04 | 2.38e-04 | 38 |
| hsa000712 | Colorectum | SER | Fatty acid degradation | 15/1580 | 43/8465 | 8.60e-03 | 4.26e-02 | 3.09e-02 | 15 |
| hsa047143 | Colorectum | SER | Thermogenesis | 106/1580 | 232/8465 | 1.15e-21 | 6.34e-20 | 4.61e-20 | 106 |
| hsa049223 | Colorectum | SER | Glucagon signaling pathway | 38/1580 | 107/8465 | 2.57e-05 | 3.28e-04 | 2.38e-04 | 38 |
| hsa000713 | Colorectum | SER | Fatty acid degradation | 15/1580 | 43/8465 | 8.60e-03 | 4.26e-02 | 3.09e-02 | 15 |
| hsa047144 | Colorectum | MSS | Thermogenesis | 113/1875 | 232/8465 | 1.52e-19 | 4.62e-18 | 2.83e-18 | 113 |
| hsa049224 | Colorectum | MSS | Glucagon signaling pathway | 39/1875 | 107/8465 | 5.00e-04 | 3.45e-03 | 2.11e-03 | 39 |
| hsa041522 | Colorectum | MSS | AMPK signaling pathway | 41/1875 | 121/8465 | 1.91e-03 | 9.83e-03 | 6.03e-03 | 41 |
| hsa04931 | Colorectum | MSS | Insulin resistance | 36/1875 | 108/8465 | 4.74e-03 | 2.01e-02 | 1.23e-02 | 36 |
| hsa000714 | Colorectum | MSS | Fatty acid degradation | 17/1875 | 43/8465 | 7.50e-03 | 2.86e-02 | 1.75e-02 | 17 |
| hsa047145 | Colorectum | MSS | Thermogenesis | 113/1875 | 232/8465 | 1.52e-19 | 4.62e-18 | 2.83e-18 | 113 |
| Page: 1 2 3 4 5 |
Top |
Cell-cell communication analysis |
| Identification of potential cell-cell interactions between two cell types and their ligand-receptor pairs for different disease states |
| Ligand | Receptor | LRpair | Pathway | Tissue | Disease Stage |
| Page: 1 |
Top |
Single-cell gene regulatory network inference analysis |
| Find out the significant the regulons (TFs) and the target genes of each regulon across cell types for different disease states |
| TF | Cell Type | Tissue | Disease Stage | Target Gene | RSS | Regulon Activity |
| ∗The dot plots of a searched regulon are shown for all cell subpopulations in each disease state of each tissue based on the regulon specific score inferred using pySCENIC and by calculating the average expression. |
| Page: 1 |
Top |
Somatic mutation of malignant transformation related genes |
| Annotation of somatic variants for genes involved in malignant transformation |
| Hugo Symbol | Variant Class | Variant Classification | dbSNP RS | HGVSc | HGVSp | HGVSp Short | SWISSPROT | BIOTYPE | SIFT | PolyPhen | Tumor Sample Barcode | Tissue | Histology | Sex | Age | Stage | Therapy Types | Drugs | Outcome |
| CPT1A | SNV | Missense_Mutation | c.1450N>G | p.Leu484Val | p.L484V | P50416 | protein_coding | tolerated(0.11) | benign(0.262) | TCGA-A2-A0T4-01 | Breast | breast invasive carcinoma | Female | <65 | I/II | Hormone Therapy | femara | SD | |
| CPT1A | SNV | Missense_Mutation | c.575N>G | p.Pro192Arg | p.P192R | P50416 | protein_coding | deleterious(0) | probably_damaging(0.995) | TCGA-A8-A06X-01 | Breast | breast invasive carcinoma | Female | >=65 | I/II | Unknown | Unknown | SD | |
| CPT1A | SNV | Missense_Mutation | novel | c.1772N>G | p.Ala591Gly | p.A591G | P50416 | protein_coding | deleterious(0) | possibly_damaging(0.7) | TCGA-A8-A0A1-01 | Breast | breast invasive carcinoma | Female | >=65 | I/II | Hormone Therapy | tamoxiphen | SD |
| CPT1A | SNV | Missense_Mutation | c.1144N>T | p.Ala382Ser | p.A382S | P50416 | protein_coding | deleterious(0.05) | probably_damaging(0.986) | TCGA-AR-A0TZ-01 | Breast | breast invasive carcinoma | Female | <65 | III/IV | Unspecific | Doxorubicin | PD | |
| CPT1A | SNV | Missense_Mutation | c.1126N>T | p.Gly376Trp | p.G376W | P50416 | protein_coding | deleterious(0) | probably_damaging(0.999) | TCGA-AR-A5QQ-01 | Breast | breast invasive carcinoma | Female | >=65 | III/IV | Chemotherapy | carboplatin | PD | |
| CPT1A | SNV | Missense_Mutation | rs752187315 | c.281C>T | p.Ala94Val | p.A94V | P50416 | protein_coding | tolerated(0.51) | benign(0.03) | TCGA-BH-A18N-01 | Breast | breast invasive carcinoma | Female | >=65 | I/II | Unknown | Unknown | SD |
| CPT1A | SNV | Missense_Mutation | novel | c.677N>C | p.Trp226Ser | p.W226S | P50416 | protein_coding | deleterious(0.02) | possibly_damaging(0.906) | TCGA-LL-A441-01 | Breast | breast invasive carcinoma | Female | <65 | I/II | Chemotherapy | taxotere | CR |
| CPT1A | insertion | In_Frame_Ins | novel | c.226_227insTCC | p.Lys76delinsIleGln | p.K76delinsIQ | P50416 | protein_coding | TCGA-AC-A2BM-01 | Breast | breast invasive carcinoma | Female | <65 | I/II | Unknown | Unknown | SD | ||
| CPT1A | insertion | Frame_Shift_Ins | novel | c.224_225insTCCCTCCCTGACTGCCTGGTGTCCTTCTCCTGTGGCT | p.Lys76ProfsTer76 | p.K76Pfs*76 | P50416 | protein_coding | TCGA-AC-A2BM-01 | Breast | breast invasive carcinoma | Female | <65 | I/II | Unknown | Unknown | SD | ||
| CPT1A | SNV | Missense_Mutation | rs561244283 | c.524N>T | p.Pro175Leu | p.P175L | P50416 | protein_coding | deleterious(0.01) | probably_damaging(0.983) | TCGA-2W-A8YY-01 | Cervix | cervical & endocervical cancer | Female | <65 | I/II | Chemotherapy | cisplatin | CR |
| Page: 1 2 3 4 5 6 7 8 9 10 11 |
Top |
Related drugs of malignant transformation related genes |
| Identification of chemicals and drugs interact with genes involved in malignant transfromation |
| (DGIdb 4.0) |
| Entrez ID | Symbol | Category | Interaction Types | Drug Claim Name | Drug Name | PMIDs |
| 1374 | CPT1A | DRUGGABLE GENOME, ENZYME | PERHEXILINE | PERHEXILINE | ||
| 1374 | CPT1A | DRUGGABLE GENOME, ENZYME | PERHEXILINE | PERHEXILINE | ||
| 1374 | CPT1A | DRUGGABLE GENOME, ENZYME | PROPIONYL-L-CARNITINE |
| Page: 1 |

Copyright 2023-Present -The University of Texas Health Science Center at Houston |