Schematic overview of the cellular and molecular mechanisms involved in the cancer progression, including the proposed cellular and molecular mechanisms in cancer cells trajectory. AT1: alveolar type 1 cells; AT2: alveolar type 2 cells; AAH: atypical adenomatous hyperplasia; AIS: adenocarcinoma in situ; MIA: minimally invasive adenocarcinoma; IA: invasive adenocarcinoma; EMT: epithelial-mesenchymal transition

Home

Download

Statistics

Help

Contact

Center for Computational Systems Medicine
leaf

Gene summary

leaf

Malignant transformation analysis

leaf

Malignant transformation related pathway analysis

leaf

Cell-cell communication analysis

leaf

Single-cell gene regulatory network inference analysis

leaf

Somatic mutation of malignant transformation related genes

leaf

Related drugs of malignant transformation related genes

Gene: CLIC4

Gene summary for CLIC4

check button Gene summary.

Gene informationSpeciesHuman
Gene symbol

CLIC4

Gene ID

25932

Gene namechloride intracellular channel 4
Gene AliasCLIC4L
Cytomap1p36.11
Gene Typeprotein-coding
GO ID

GO:0000003

UniProtAcc

Q6FIC5


Top

Malignant transformation analysis

check button Identification of the aberrant gene expression in precancerous and cancerous lesions by comparing the gene expression of stem-like cells in diseased tissues with normal stem cells
check button Malignant transformation involving gene list.
Entrez IDSymbolReplicatesSpeciesOrganTissueAdj P-valueLog2FCMalignancy
25932CLIC4LZE2THumanEsophagusESCC2.30e-023.06e-010.082
25932CLIC4LZE4THumanEsophagusESCC1.72e-081.72e-010.0811
25932CLIC4LZE7THumanEsophagusESCC3.31e-067.16e-010.0667
25932CLIC4LZE8THumanEsophagusESCC2.52e-03-3.04e-020.067
25932CLIC4LZE20THumanEsophagusESCC4.73e-052.28e-010.0662
25932CLIC4LZE22THumanEsophagusESCC1.93e-074.43e-010.068
25932CLIC4LZE24THumanEsophagusESCC4.01e-195.98e-010.0596
25932CLIC4LZE6THumanEsophagusESCC3.65e-072.69e-010.0845
25932CLIC4P1T-EHumanEsophagusESCC8.16e-076.66e-010.0875
25932CLIC4P2T-EHumanEsophagusESCC2.04e-831.52e+000.1177
25932CLIC4P4T-EHumanEsophagusESCC1.92e-401.04e+000.1323
25932CLIC4P5T-EHumanEsophagusESCC2.67e-601.28e+000.1327
25932CLIC4P8T-EHumanEsophagusESCC8.76e-113.63e-010.0889
25932CLIC4P9T-EHumanEsophagusESCC3.92e-146.62e-010.1131
25932CLIC4P10T-EHumanEsophagusESCC2.55e-328.49e-010.116
25932CLIC4P11T-EHumanEsophagusESCC1.56e-301.53e+000.1426
25932CLIC4P12T-EHumanEsophagusESCC1.31e-267.34e-010.1122
25932CLIC4P15T-EHumanEsophagusESCC1.77e-238.07e-010.1149
25932CLIC4P16T-EHumanEsophagusESCC1.51e-357.77e-010.1153
25932CLIC4P17T-EHumanEsophagusESCC4.37e-141.29e+000.1278
Page: 1 2 3 4 5 6 7 

check button Transcriptomic changes along malignancy continuum.
TissueExpression DynamicsAbbreviation
EsophagusThe image shows the transcriptomic changes along malignancy continuum.log2FC in expression of this searched gene in stem-like cells from each diseased tissue sample relative to stem-like cells in normal samples in each tissue plotted against the malignancy continuum. Samples are colored based on if they are from different disease stage.
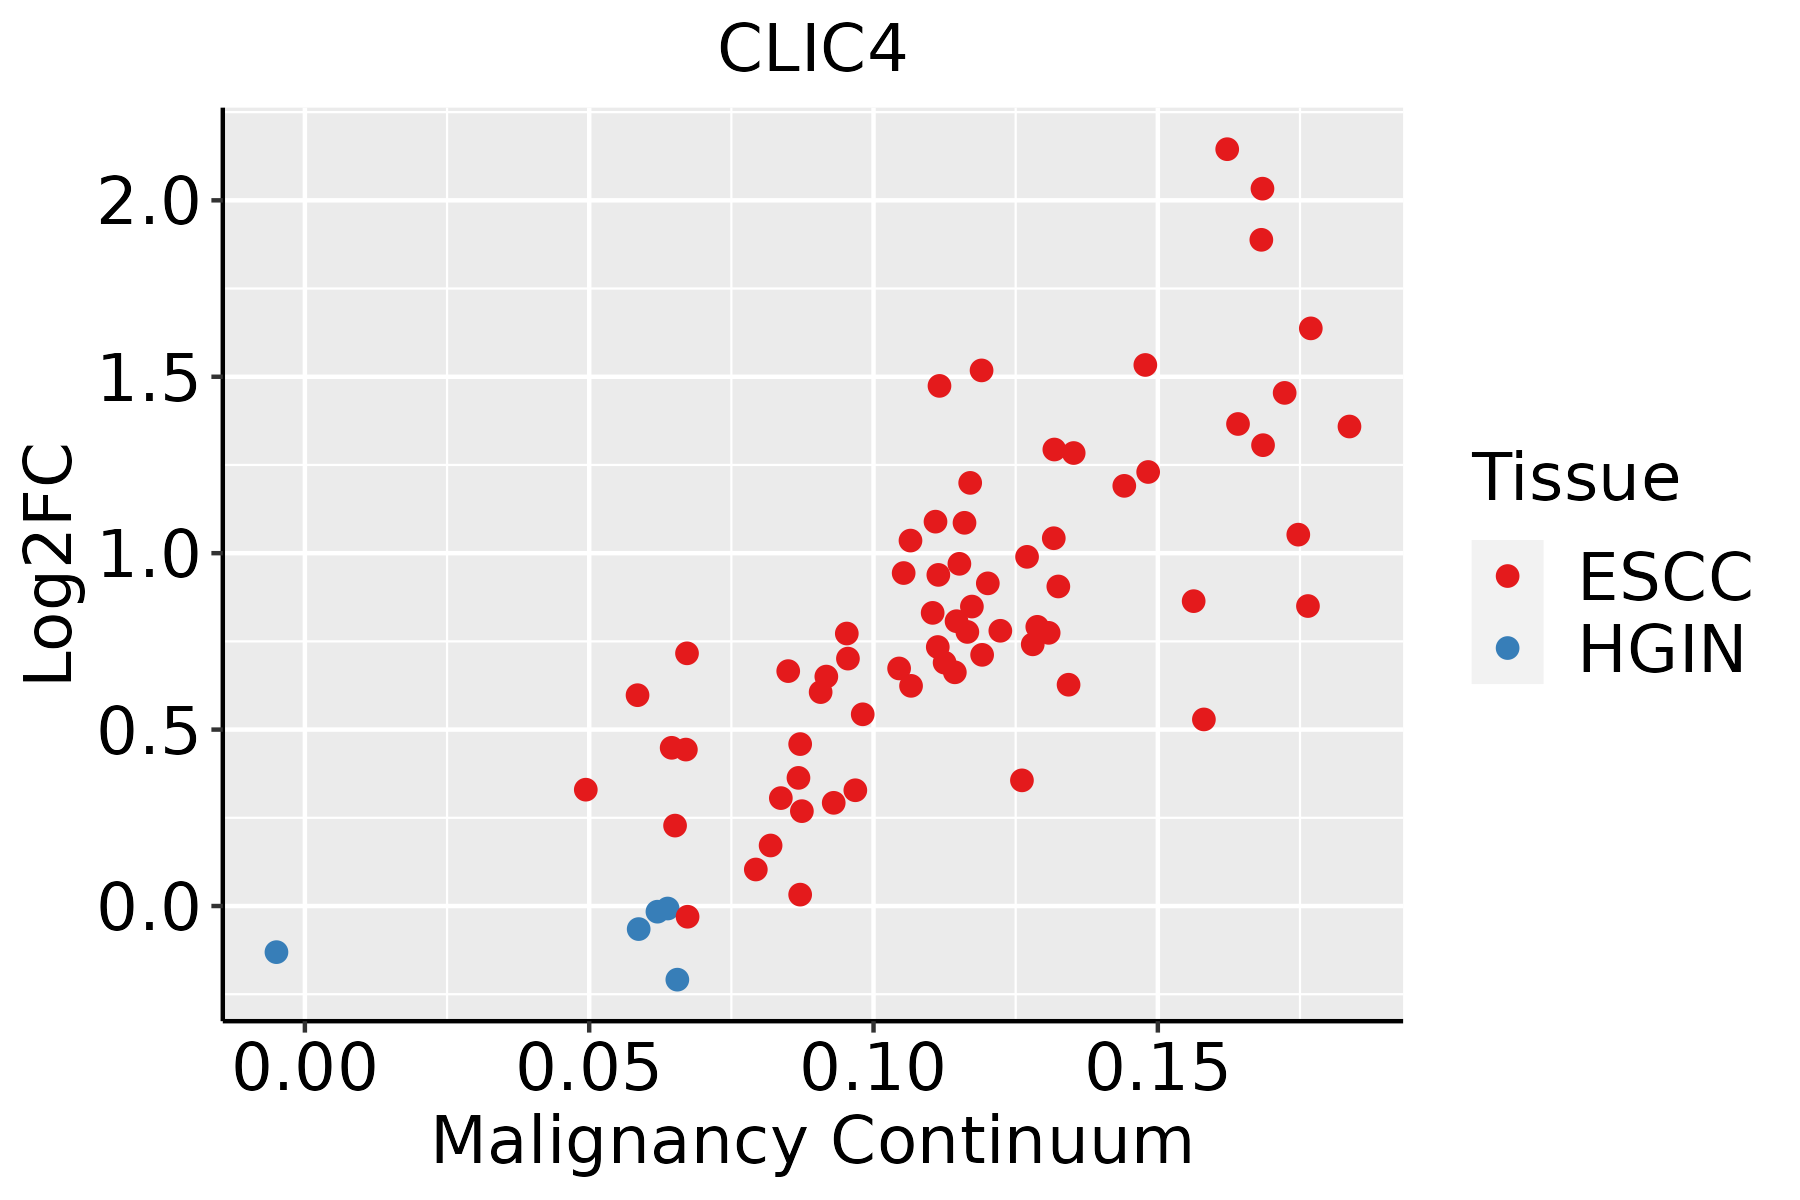
ESCC: Esophageal squamous cell carcinoma
HGIN: High-grade intraepithelial neoplasias
LGIN: Low-grade intraepithelial neoplasias
LiverThe image shows the transcriptomic changes along malignancy continuum.log2FC in expression of this searched gene in stem-like cells from each diseased tissue sample relative to stem-like cells in normal samples in each tissue plotted against the malignancy continuum. Samples are colored based on if they are from different disease stage.
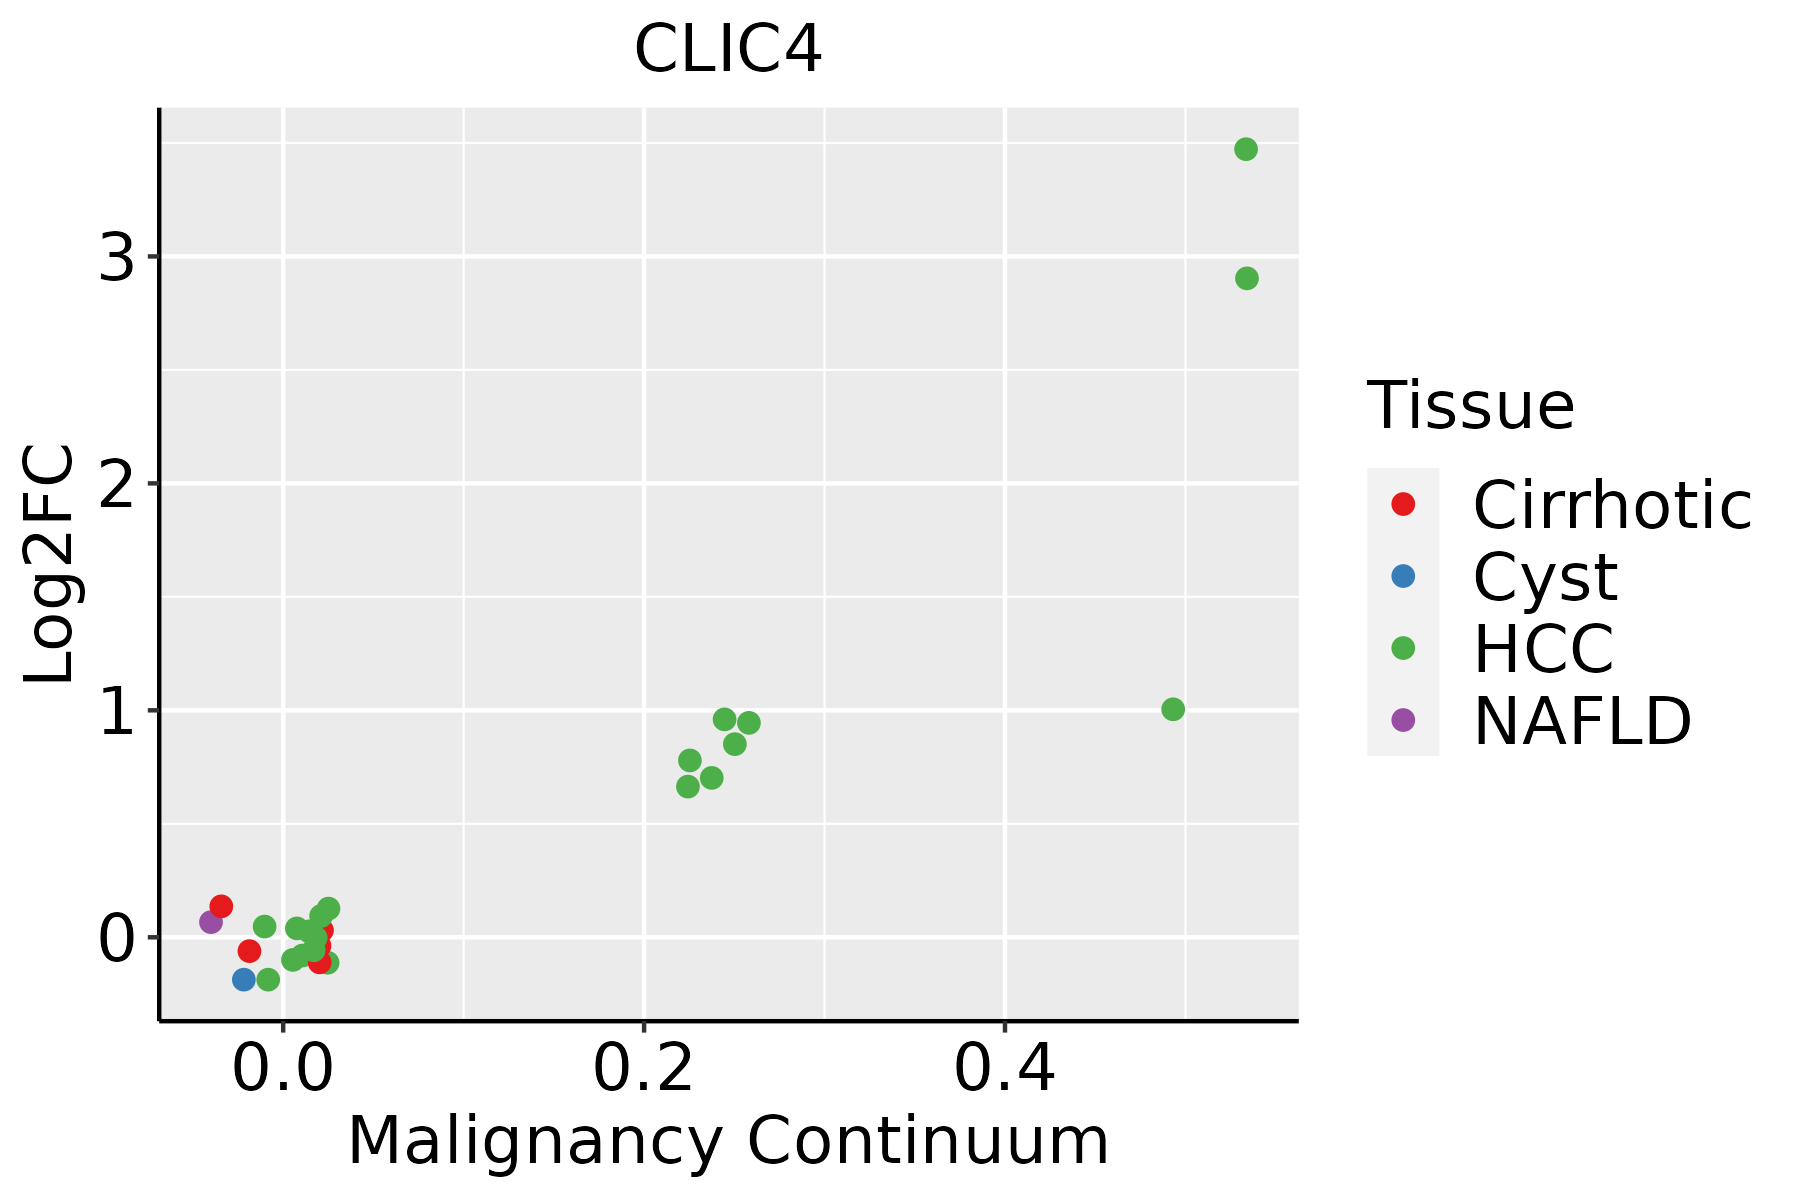
HCC: Hepatocellular carcinoma
NAFLD: Non-alcoholic fatty liver disease
LungThe image shows the transcriptomic changes along malignancy continuum.log2FC in expression of this searched gene in stem-like cells from each diseased tissue sample relative to stem-like cells in normal samples in each tissue plotted against the malignancy continuum. Samples are colored based on if they are from different disease stage.
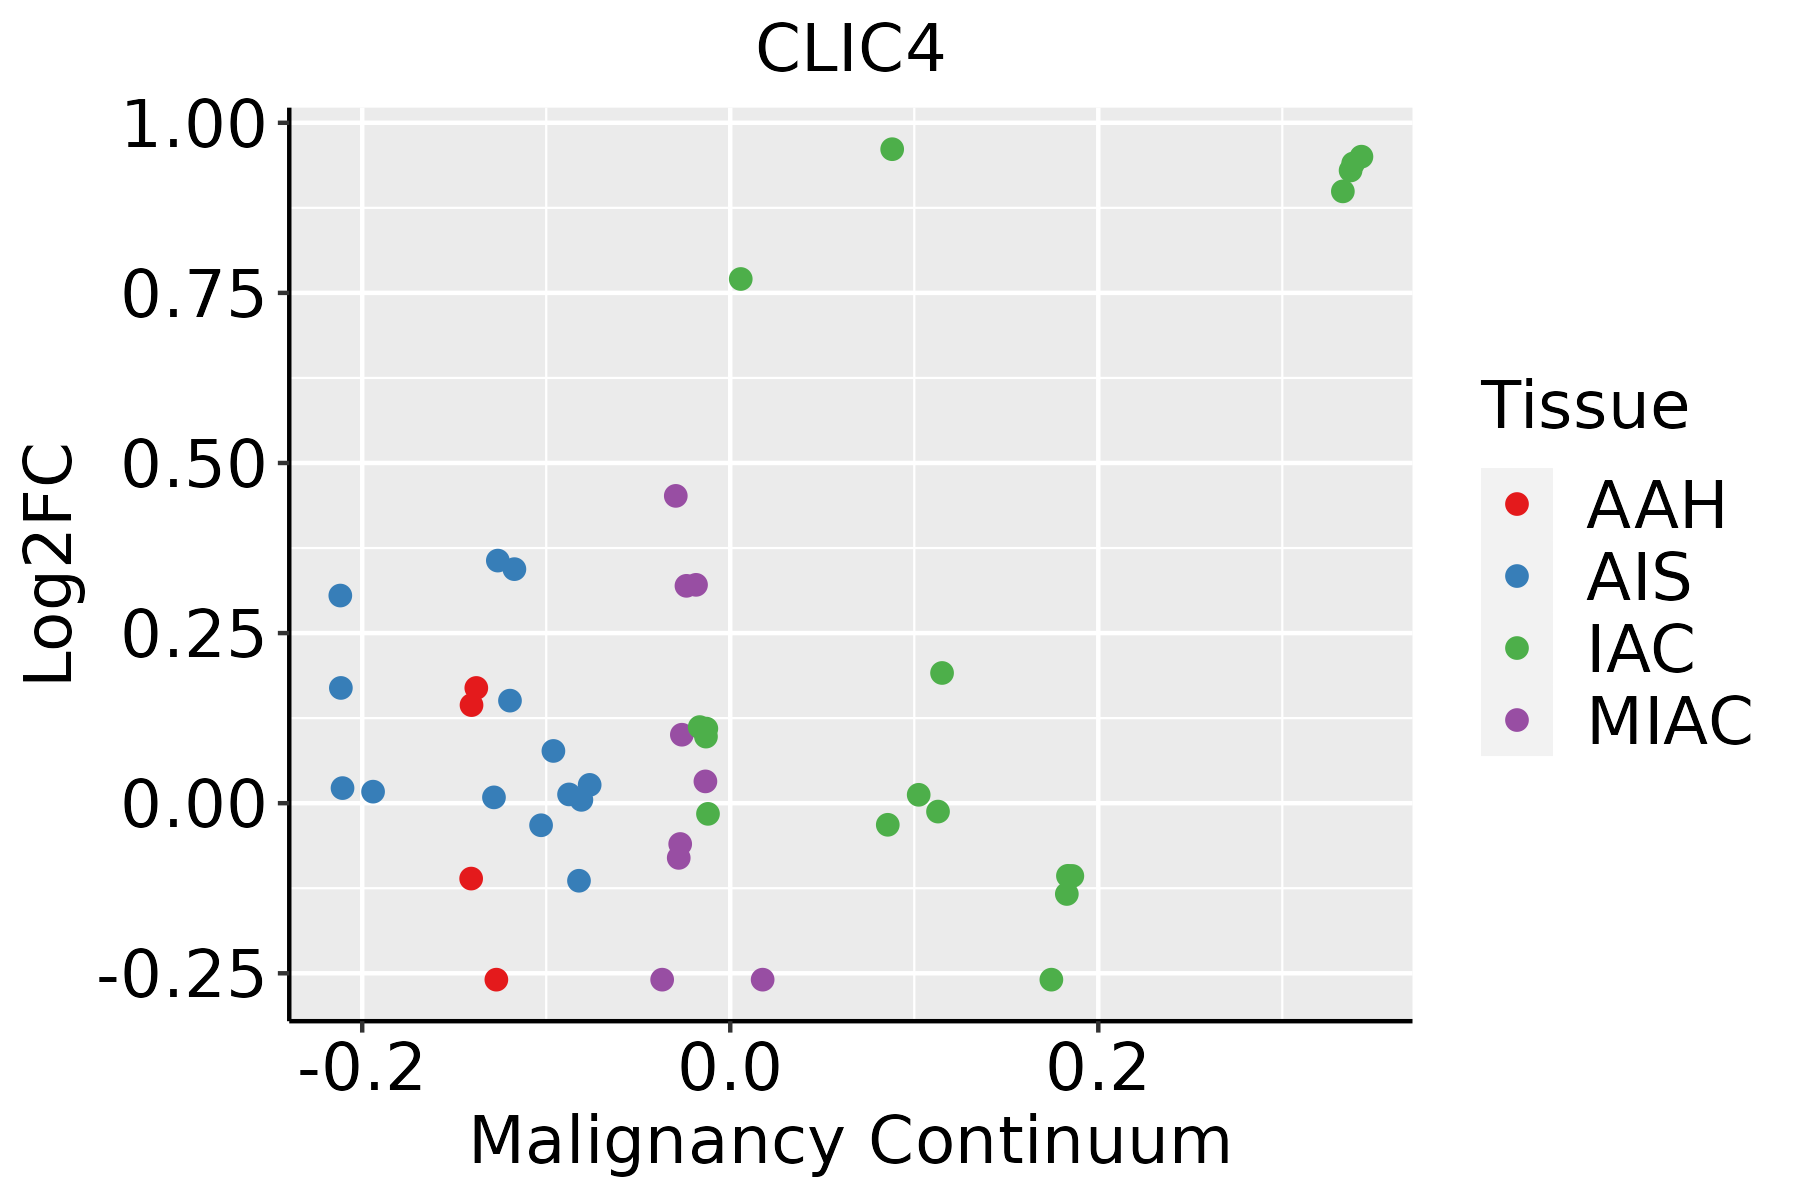
AAH: Atypical adenomatous hyperplasia
AIS: Adenocarcinoma in situ
IAC: Invasive lung adenocarcinoma
MIA: Minimally invasive adenocarcinoma
Oral CavityThe image shows the transcriptomic changes along malignancy continuum.log2FC in expression of this searched gene in stem-like cells from each diseased tissue sample relative to stem-like cells in normal samples in each tissue plotted against the malignancy continuum. Samples are colored based on if they are from different disease stage.
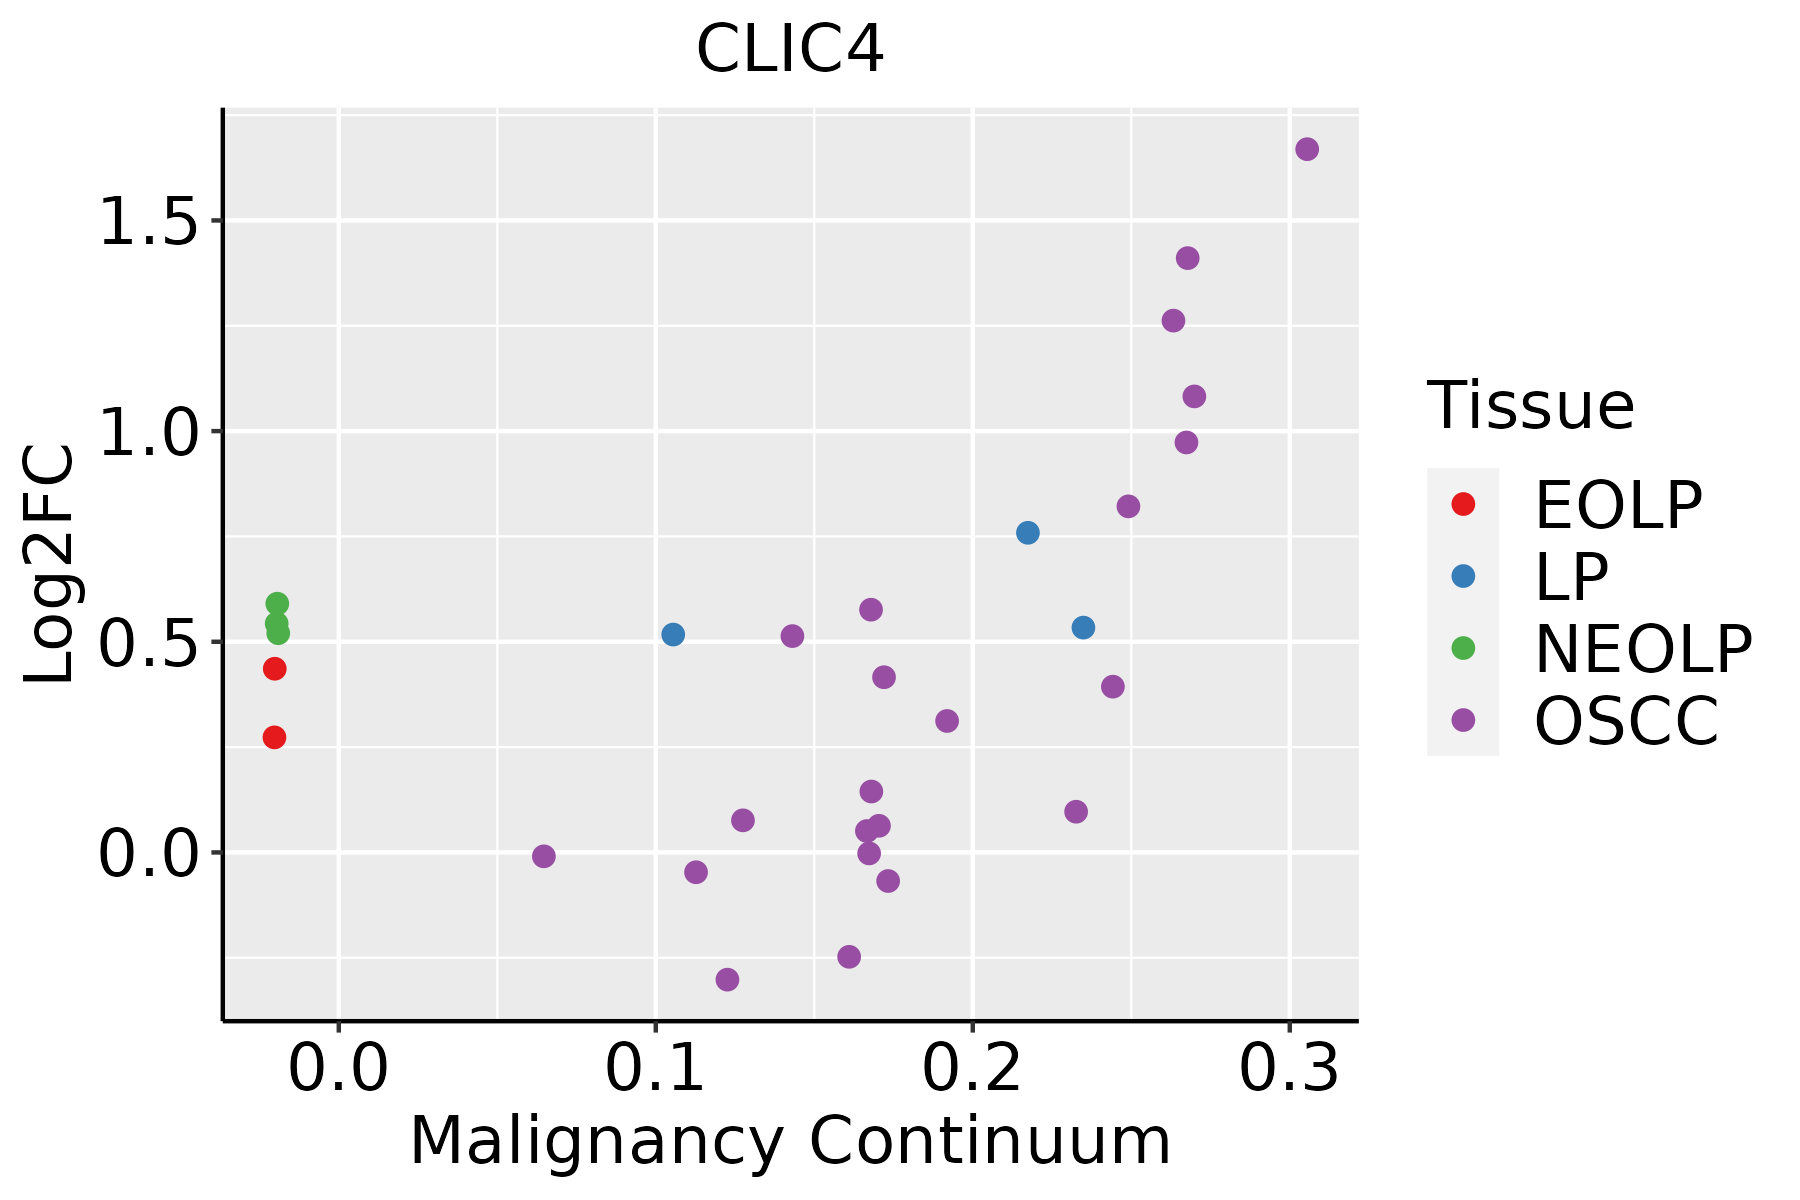
EOLP: Erosive Oral lichen planus
LP: leukoplakia
NEOLP: Non-erosive oral lichen planus
OSCC: Oral squamous cell carcinoma
ProstateThe image shows the transcriptomic changes along malignancy continuum.log2FC in expression of this searched gene in stem-like cells from each diseased tissue sample relative to stem-like cells in normal samples in each tissue plotted against the malignancy continuum. Samples are colored based on if they are from different disease stage.
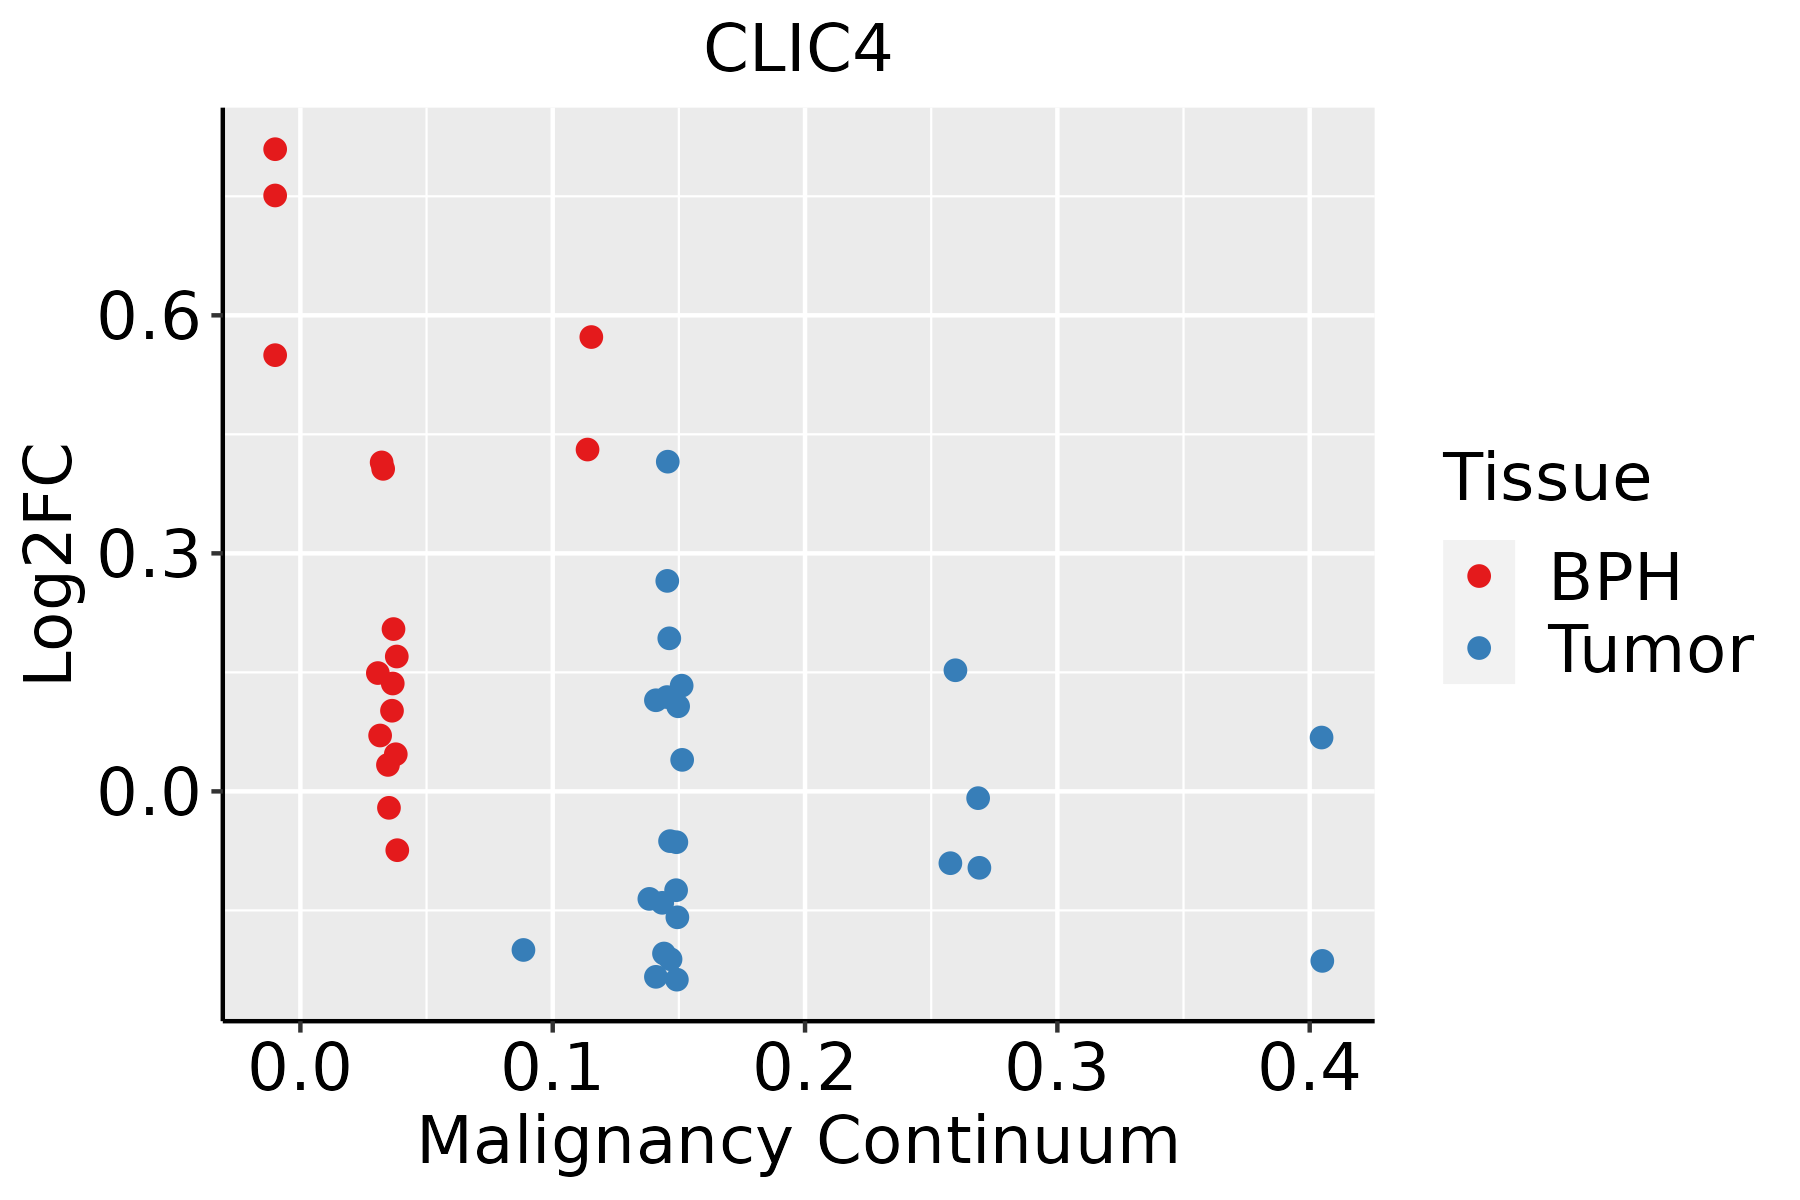
BPH: Benign Prostatic Hyperplasia
SkinThe image shows the transcriptomic changes along malignancy continuum.log2FC in expression of this searched gene in stem-like cells from each diseased tissue sample relative to stem-like cells in normal samples in each tissue plotted against the malignancy continuum. Samples are colored based on if they are from different disease stage.
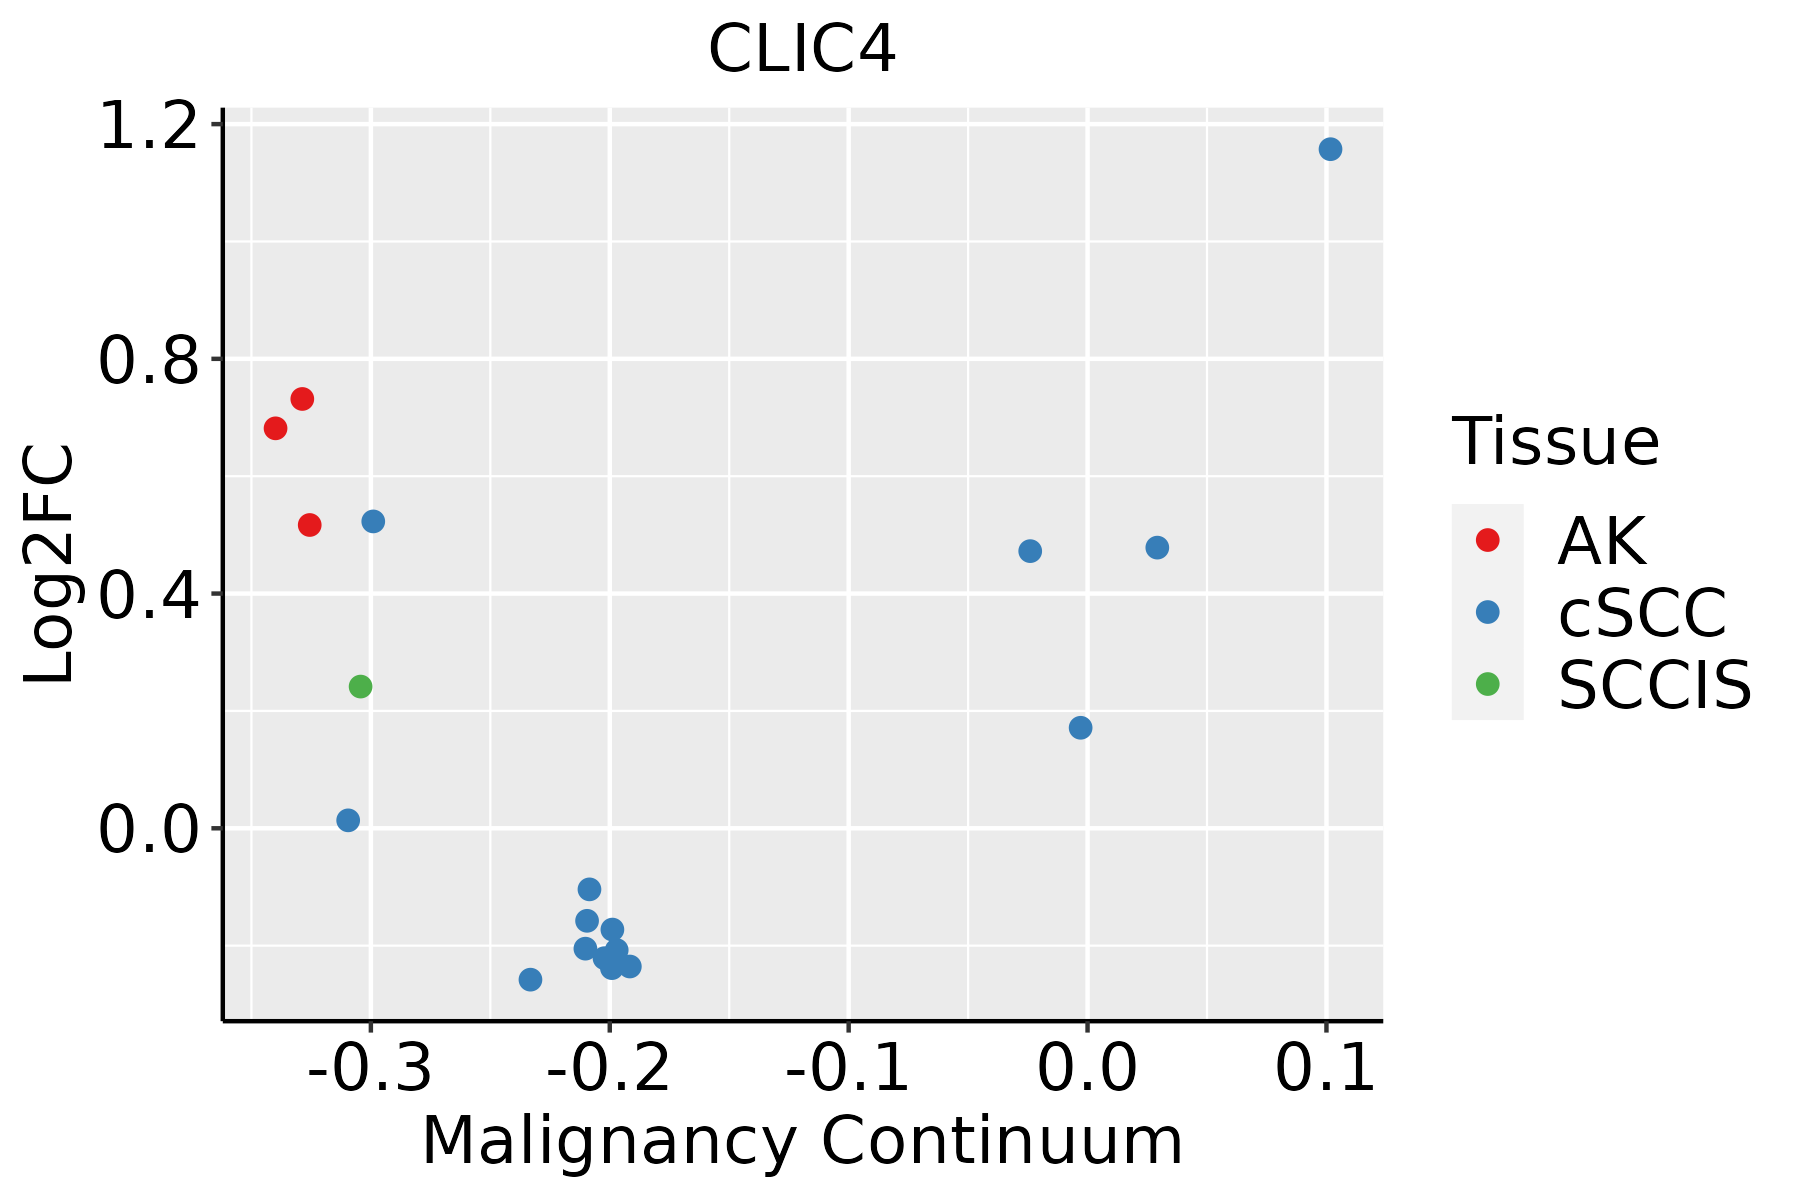
AK: Actinic keratosis
cSCC: Cutaneous squamous cell carcinoma
SCCIS:squamous cell carcinoma in situ
ThyroidThe image shows the transcriptomic changes along malignancy continuum.log2FC in expression of this searched gene in stem-like cells from each diseased tissue sample relative to stem-like cells in normal samples in each tissue plotted against the malignancy continuum. Samples are colored based on if they are from different disease stage.
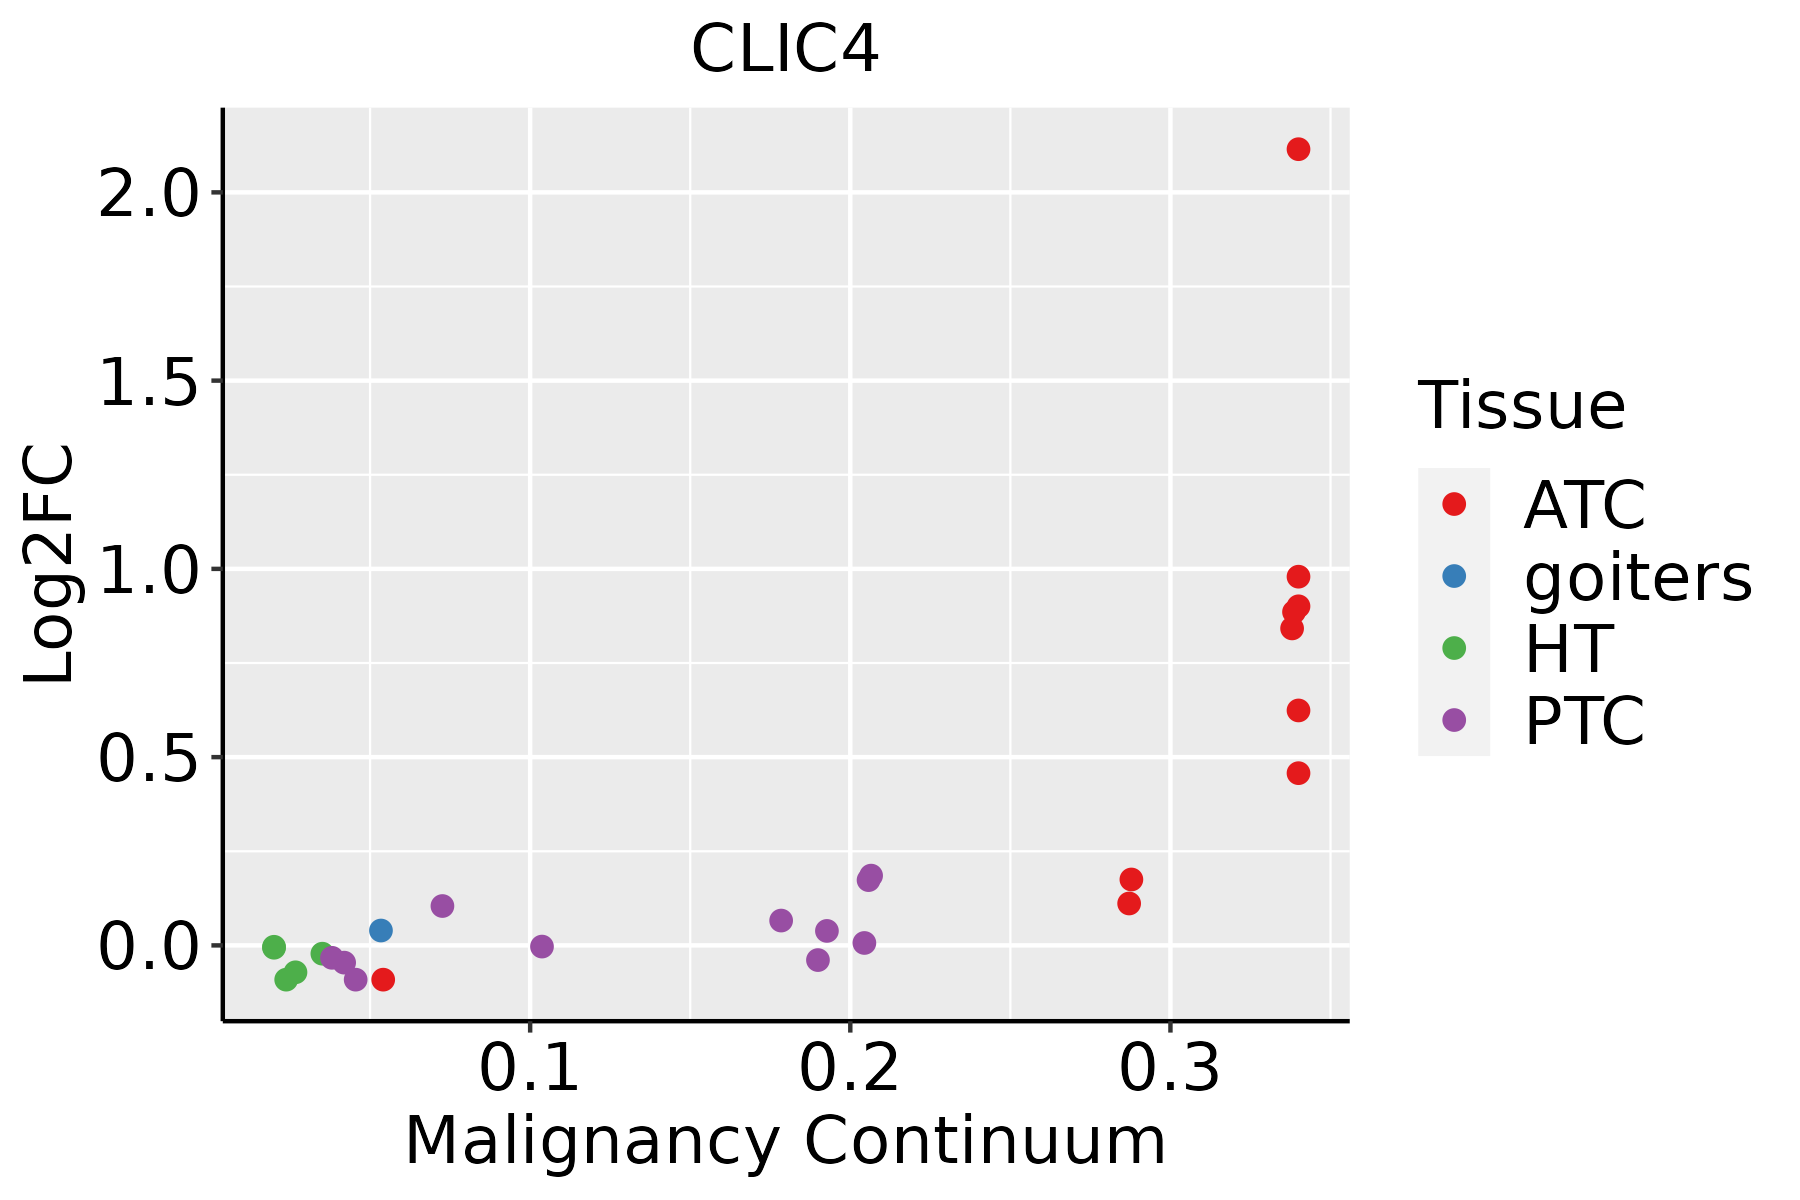
ATC: Anaplastic thyroid cancer
HT: Hashimoto's thyroiditis
PTC: Papillary thyroid cancer
∗log2FC in expression of this searched gene in stem-like cells from each diseased tissue sample relative to stem-like cells in normal samples in each tissue plotted against the malignancy continuum. Samples are colored based on if they are from different disease stage.

Top

Malignant transformation related pathway analysis

check buttonFind out the enriched GO biological processes and KEGG pathways involved in transition from healthy to precancer to cancer
check button Figure of enriched GO biological processes.
TissueDisease StageEnriched GO biological Processes
ColorectumADGO analysis - Figure of enriched GO biological processes: Top 15 enriched GO BP terms are showed in the bar plot of each disease state in each tissue. Each row represents a significant GO biological process which is colored according to the -log10(p.adjust).
ColorectumSERGO analysis - Figure of enriched GO biological processes: Top 15 enriched GO BP terms are showed in the bar plot of each disease state in each tissue. Each row represents a significant GO biological process which is colored according to the -log10(p.adjust).
ColorectumMSSGO analysis - Figure of enriched GO biological processes: Top 15 enriched GO BP terms are showed in the bar plot of each disease state in each tissue. Each row represents a significant GO biological process which is colored according to the -log10(p.adjust).
ColorectumMSI-HGO analysis - Figure of enriched GO biological processes: Top 15 enriched GO BP terms are showed in the bar plot of each disease state in each tissue. Each row represents a significant GO biological process which is colored according to the -log10(p.adjust).
ColorectumFAPGO analysis - Figure of enriched GO biological processes: Top 15 enriched GO BP terms are showed in the bar plot of each disease state in each tissue. Each row represents a significant GO biological process which is colored according to the -log10(p.adjust).
∗Top 15 enriched GO BP terms are showed in the bar plot of each disease state in each tissue. Each row represents a significant GO biological process which is colored according to the -log10(p.adjust).
Page: 1 2 3 4 5 6 7 8 9 

check button Enriched GO biological processes.
GO IDTissueDisease StageDescriptionGene RatioBg Ratiopvaluep.adjustCount
GO:001003829SkincSCCresponse to metal ion132/4864373/187233.11e-053.42e-04132
GO:000206426SkincSCCepithelial cell development84/4864220/187234.33e-054.56e-0484
GO:003508814SkincSCCestablishment or maintenance of apical/basal cell polarity26/486449/187234.78e-054.96e-0426
GO:006124514SkincSCCestablishment or maintenance of bipolar cell polarity26/486449/187234.78e-054.96e-0426
GO:000991324SkincSCCepidermal cell differentiation78/4864202/187235.12e-055.28e-0478
GO:000188525SkincSCCendothelial cell development30/486464/187232.50e-042.04e-0330
GO:00070354SkincSCCvacuolar acidification13/486424/187233.02e-031.67e-0213
GO:000315824SkincSCCendothelium development49/4864136/187236.00e-032.95e-0249
GO:005159217SkincSCCresponse to calcium ion52/4864149/187239.63e-034.31e-0252
GO:0007163111ThyroidPTCestablishment or maintenance of cell polarity115/5968218/187231.15e-103.90e-09115
GO:006056219ThyroidPTCepithelial tube morphogenesis141/5968325/187237.52e-068.73e-05141
GO:0002064112ThyroidPTCepithelial cell development101/5968220/187238.53e-069.74e-05101
GO:000188519ThyroidPTCendothelial cell development37/596864/187231.62e-051.70e-0437
GO:0010038112ThyroidPTCresponse to metal ion157/5968373/187231.80e-051.86e-04157
GO:0003158111ThyroidPTCendothelium development62/5968136/187235.45e-043.48e-0362
GO:004544619ThyroidPTCendothelial cell differentiation55/5968118/187235.64e-043.59e-0355
GO:005159219ThyroidPTCresponse to calcium ion65/5968149/187231.67e-039.16e-0365
GO:003508810ThyroidPTCestablishment or maintenance of apical/basal cell polarity26/596849/187231.68e-039.20e-0326
GO:006124510ThyroidPTCestablishment or maintenance of bipolar cell polarity26/596849/187231.68e-039.20e-0326
GO:00070355ThyroidPTCvacuolar acidification15/596824/187231.95e-031.05e-0215
Page: 1 2 3 4 5 6 7 8 9 10 11 12 13 

check button Enriched KEGG pathways.
Pathway IDTissueDisease StageDescriptionGene RatioBg Ratiopvaluep.adjustqvalueCount
Page: 1 

Top

Cell-cell communication analysis

check buttonIdentification of potential cell-cell interactions between two cell types and their ligand-receptor pairs for different disease states
LigandReceptorLRpairPathwayTissueDisease Stage
Page: 1 

Top

Single-cell gene regulatory network inference analysis

check buttonFind out the significant the regulons (TFs) and the target genes of each regulon across cell types for different disease states
TFCell TypeTissueDisease StageTarget GeneRSSRegulon Activity
∗The dot plots of a searched regulon are shown for all cell subpopulations in each disease state of each tissue based on the regulon specific score inferred using pySCENIC and by calculating the average expression.
Page: 1 

Top

Somatic mutation of malignant transformation related genes

check buttonAnnotation of somatic variants for genes involved in malignant transformation
Hugo SymbolVariant ClassVariant ClassificationdbSNP RSHGVScHGVSpHGVSp ShortSWISSPROTBIOTYPESIFTPolyPhenTumor Sample BarcodeTissueHistologySexAgeStageTherapy TypesDrugsOutcome
CLIC4SNVMissense_Mutationrs779954576c.257N>Tp.Thr86Metp.T86MQ9Y696protein_codingdeleterious(0.02)probably_damaging(0.999)TCGA-A8-A09Z-01Breastbreast invasive carcinomaFemale>=65I/IIUnknownUnknownSD
CLIC4SNVMissense_Mutationnovelc.16N>Ap.Pro6Thrp.P6TQ9Y696protein_codingdeleterious_low_confidence(0.03)benign(0.151)TCGA-Q1-A5R2-01Cervixcervical & endocervical cancerFemale<65I/IIChemotherapycisplatinPR
CLIC4SNVMissense_Mutationc.647G>Ap.Gly216Aspp.G216DQ9Y696protein_codingdeleterious(0)possibly_damaging(0.826)TCGA-CK-5913-01Colorectumcolon adenocarcinomaFemale<65I/IIUnknownUnknownSD
CLIC4SNVMissense_Mutationc.283C>Ap.Leu95Ilep.L95IQ9Y696protein_codingdeleterious(0.04)probably_damaging(0.997)TCGA-AG-A002-01Colorectumrectum adenocarcinomaMale<65I/IIUnknownUnknownSD
CLIC4SNVMissense_Mutationnovelc.468N>Gp.Asn156Lysp.N156KQ9Y696protein_codingtolerated(0.29)benign(0.054)TCGA-EI-6917-01Colorectumrectum adenocarcinomaMale<65III/IVChemotherapy5fluorouracil+oxaciplatina+l-folinianSD
CLIC4SNVMissense_Mutationrs144375143c.617G>Ap.Arg206Hisp.R206HQ9Y696protein_codingtolerated(0.06)benign(0.009)TCGA-AJ-A3EK-01Endometriumuterine corpus endometrioid carcinomaFemale<65I/IIChemotherapycarboplatinCR
CLIC4SNVMissense_Mutationc.375N>Ap.Phe125Leup.F125LQ9Y696protein_codingdeleterious(0.04)benign(0.166)TCGA-AX-A05Z-01Endometriumuterine corpus endometrioid carcinomaFemale<65III/IVChemotherapyadriamycinSD
CLIC4SNVMissense_Mutationc.109T>Cp.Phe37Leup.F37LQ9Y696protein_codingdeleterious(0.04)probably_damaging(0.92)TCGA-D1-A167-01Endometriumuterine corpus endometrioid carcinomaFemale>=65I/IIUnknownUnknownSD
CLIC4SNVMissense_Mutationnovelc.307N>Gp.Lys103Glup.K103EQ9Y696protein_codingtolerated(0.11)possibly_damaging(0.795)TCGA-E6-A1LX-01Endometriumuterine corpus endometrioid carcinomaFemale<65I/IIUnknownUnknownSD
CLIC4deletionFrame_Shift_Delc.612delAp.Lys204AsnfsTer11p.K204Nfs*11Q9Y696protein_codingTCGA-AX-A3FT-01Endometriumuterine corpus endometrioid carcinomaFemale<65I/IIUnknownUnknownSD
Page: 1 2 

Top

Related drugs of malignant transformation related genes

check buttonIdentification of chemicals and drugs interact with genes involved in malignant transfromation
(DGIdb 4.0)
Entrez IDSymbolCategoryInteraction TypesDrug Claim NameDrug NamePMIDs
Page: 1