
|
|||||
|
 | |
| |
| |
| |
| |
| |
|
Gene: CHMP6 |
Gene summary for CHMP6 |
| Gene information | Species | Human | Gene symbol | CHMP6 | Gene ID | 79643 |
| Gene name | charged multivesicular body protein 6 | |
| Gene Alias | VPS20 | |
| Cytomap | 17q25.3 | |
| Gene Type | protein-coding | GO ID | GO:0000070 | UniProtAcc | Q96FZ7 |
Top |
Malignant transformation analysis |
| Identification of the aberrant gene expression in precancerous and cancerous lesions by comparing the gene expression of stem-like cells in diseased tissues with normal stem cells |
| Entrez ID | Symbol | Replicates | Species | Organ | Tissue | Adj P-value | Log2FC | Malignancy |
| 79643 | CHMP6 | LZE7T | Human | Esophagus | ESCC | 9.32e-08 | 2.82e-01 | 0.0667 |
| 79643 | CHMP6 | LZE8T | Human | Esophagus | ESCC | 1.10e-02 | 1.02e-01 | 0.067 |
| 79643 | CHMP6 | LZE20T | Human | Esophagus | ESCC | 7.90e-04 | 1.34e-01 | 0.0662 |
| 79643 | CHMP6 | LZE24T | Human | Esophagus | ESCC | 1.89e-10 | 2.47e-01 | 0.0596 |
| 79643 | CHMP6 | LZE21T | Human | Esophagus | ESCC | 8.02e-04 | 2.81e-01 | 0.0655 |
| 79643 | CHMP6 | P1T-E | Human | Esophagus | ESCC | 2.44e-06 | 2.59e-01 | 0.0875 |
| 79643 | CHMP6 | P2T-E | Human | Esophagus | ESCC | 1.65e-29 | 4.83e-01 | 0.1177 |
| 79643 | CHMP6 | P4T-E | Human | Esophagus | ESCC | 9.91e-08 | 2.04e-01 | 0.1323 |
| 79643 | CHMP6 | P5T-E | Human | Esophagus | ESCC | 3.22e-10 | 2.30e-01 | 0.1327 |
| 79643 | CHMP6 | P8T-E | Human | Esophagus | ESCC | 2.05e-11 | 2.09e-01 | 0.0889 |
| 79643 | CHMP6 | P9T-E | Human | Esophagus | ESCC | 1.34e-08 | 1.83e-01 | 0.1131 |
| 79643 | CHMP6 | P10T-E | Human | Esophagus | ESCC | 1.03e-08 | 1.77e-01 | 0.116 |
| 79643 | CHMP6 | P11T-E | Human | Esophagus | ESCC | 3.97e-24 | 6.87e-01 | 0.1426 |
| 79643 | CHMP6 | P12T-E | Human | Esophagus | ESCC | 7.27e-15 | 3.13e-01 | 0.1122 |
| 79643 | CHMP6 | P15T-E | Human | Esophagus | ESCC | 1.19e-13 | 2.65e-01 | 0.1149 |
| 79643 | CHMP6 | P16T-E | Human | Esophagus | ESCC | 1.19e-21 | 3.95e-01 | 0.1153 |
| 79643 | CHMP6 | P17T-E | Human | Esophagus | ESCC | 2.14e-09 | 2.96e-01 | 0.1278 |
| 79643 | CHMP6 | P19T-E | Human | Esophagus | ESCC | 6.53e-04 | 2.31e-01 | 0.1662 |
| 79643 | CHMP6 | P20T-E | Human | Esophagus | ESCC | 1.09e-25 | 4.99e-01 | 0.1124 |
| 79643 | CHMP6 | P21T-E | Human | Esophagus | ESCC | 6.86e-21 | 4.39e-01 | 0.1617 |
| Page: 1 2 3 4 5 |
| Tissue | Expression Dynamics | Abbreviation |
| Esophagus |  | ESCC: Esophageal squamous cell carcinoma |
| HGIN: High-grade intraepithelial neoplasias | ||
| LGIN: Low-grade intraepithelial neoplasias | ||
| Liver | 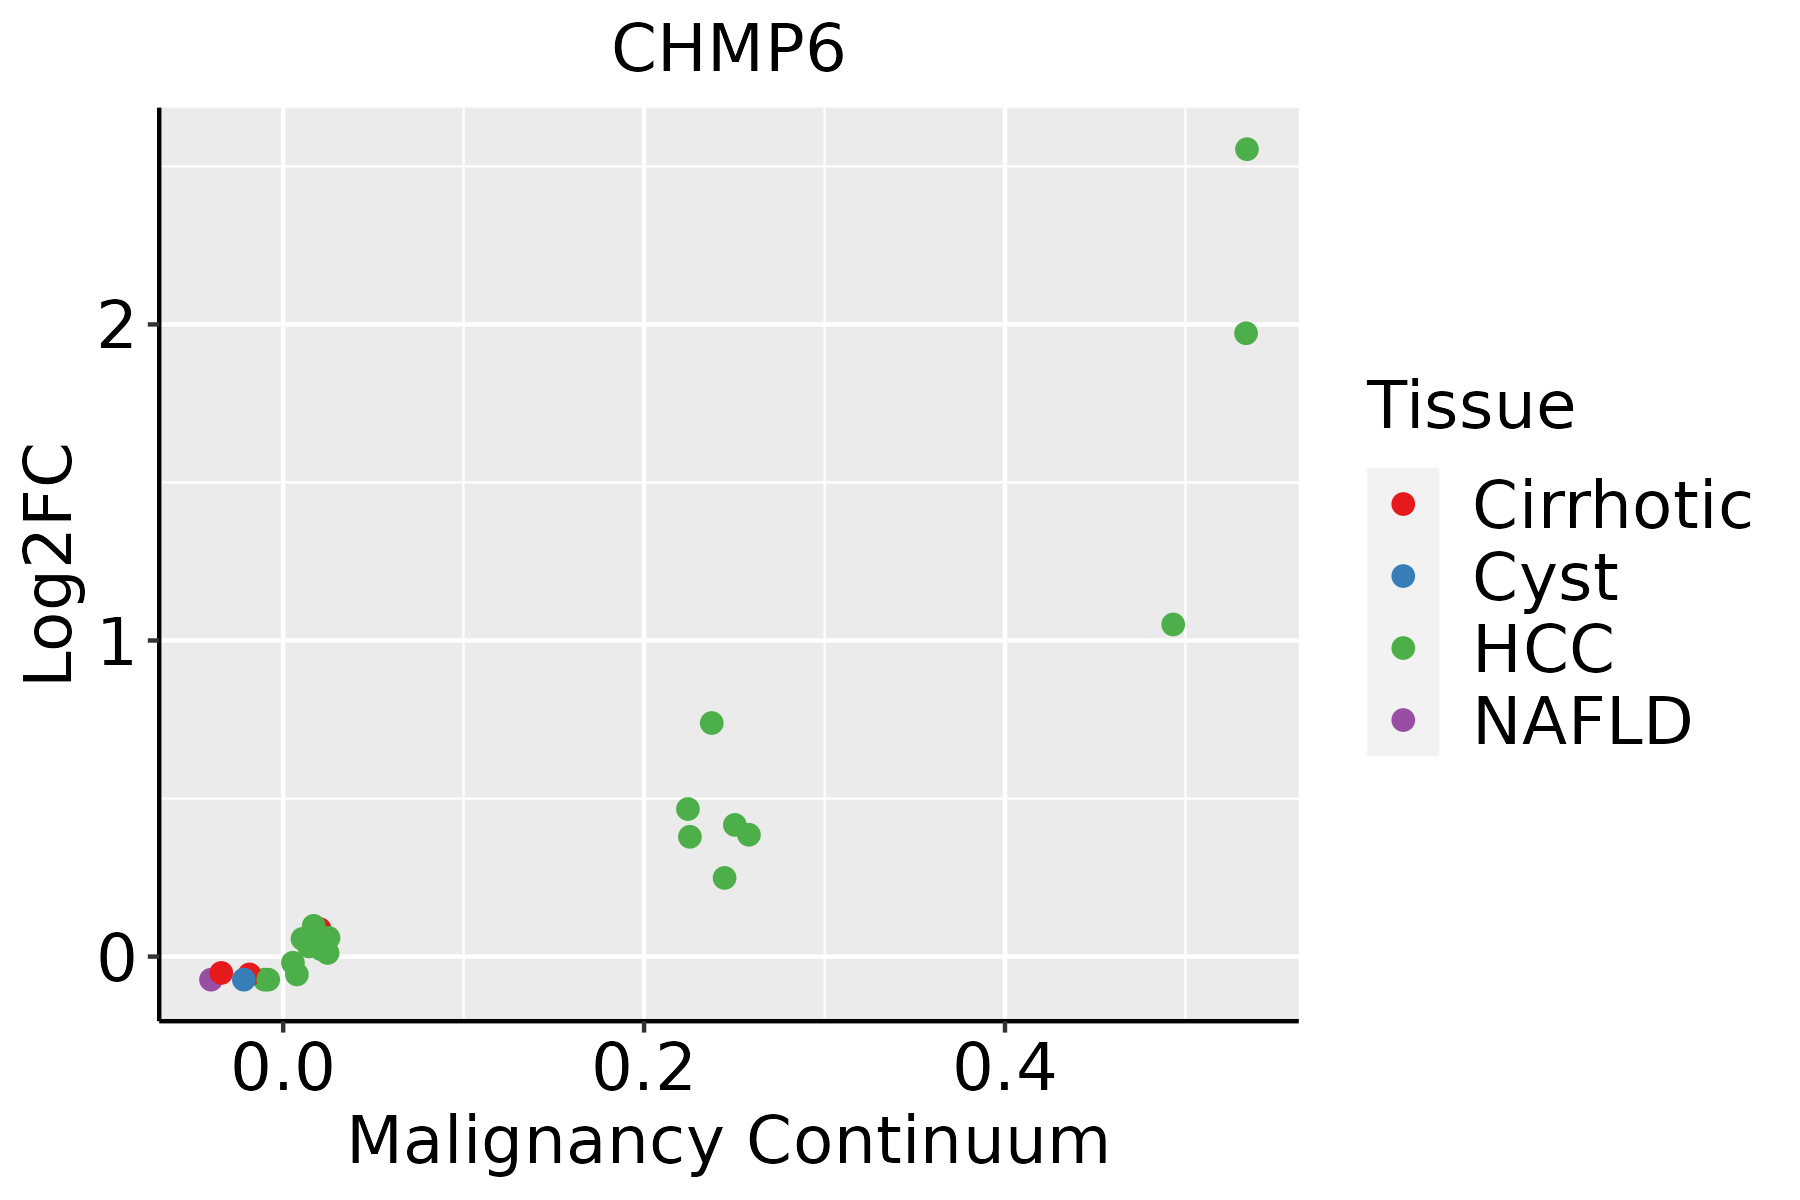 | HCC: Hepatocellular carcinoma |
| NAFLD: Non-alcoholic fatty liver disease | ||
| Oral Cavity |  | EOLP: Erosive Oral lichen planus |
| LP: leukoplakia | ||
| NEOLP: Non-erosive oral lichen planus | ||
| OSCC: Oral squamous cell carcinoma | ||
| Skin |  | AK: Actinic keratosis |
| cSCC: Cutaneous squamous cell carcinoma | ||
| SCCIS:squamous cell carcinoma in situ |
| ∗log2FC in expression of this searched gene in stem-like cells from each diseased tissue sample relative to stem-like cells in normal samples in each tissue plotted against the malignancy continuum. Samples are colored based on if they are from different disease stage. |
Top |
Malignant transformation related pathway analysis |
| Find out the enriched GO biological processes and KEGG pathways involved in transition from healthy to precancer to cancer |
| Tissue | Disease Stage | Enriched GO biological Processes |
| Colorectum | AD |  |
| Colorectum | SER |  |
| Colorectum | MSS |  |
| Colorectum | MSI-H |  |
| Colorectum | FAP |  |
| ∗Top 15 enriched GO BP terms are showed in the bar plot of each disease state in each tissue. Each row represents a significant GO biological process which is colored according to the -log10(p.adjust). |
| Page: 1 2 3 4 5 6 7 8 9 |
| GO ID | Tissue | Disease Stage | Description | Gene Ratio | Bg Ratio | pvalue | p.adjust | Count |
| GO:006195213 | Oral cavity | LP | midbody abscission | 12/4623 | 17/18723 | 8.70e-05 | 1.10e-03 | 12 |
| GO:000699712 | Oral cavity | LP | nucleus organization | 51/4623 | 133/18723 | 3.22e-04 | 3.26e-03 | 51 |
| GO:000028114 | Oral cavity | LP | mitotic cytokinesis | 30/4623 | 71/18723 | 8.59e-04 | 7.47e-03 | 30 |
| GO:000081911 | Oral cavity | LP | sister chromatid segregation | 70/4623 | 202/18723 | 9.20e-04 | 7.82e-03 | 70 |
| GO:004205914 | Oral cavity | LP | negative regulation of epidermal growth factor receptor signaling pathway | 14/4623 | 28/18723 | 3.32e-03 | 2.23e-02 | 14 |
| GO:006164014 | Oral cavity | LP | cytoskeleton-dependent cytokinesis | 37/4623 | 100/18723 | 4.08e-03 | 2.63e-02 | 37 |
| GO:190118513 | Oral cavity | LP | negative regulation of ERBB signaling pathway | 15/4623 | 32/18723 | 5.23e-03 | 3.19e-02 | 15 |
| GO:190118412 | Oral cavity | LP | regulation of ERBB signaling pathway | 30/4623 | 79/18723 | 5.97e-03 | 3.54e-02 | 30 |
| GO:004828511 | Oral cavity | LP | organelle fission | 145/4623 | 488/18723 | 6.02e-03 | 3.57e-02 | 145 |
| GO:00988131 | Oral cavity | LP | nuclear chromosome segregation | 88/4623 | 281/18723 | 6.72e-03 | 3.91e-02 | 88 |
| GO:003812716 | Oral cavity | LP | ERBB signaling pathway | 42/4623 | 121/18723 | 8.53e-03 | 4.61e-02 | 42 |
| GO:001603229 | Skin | cSCC | viral process | 211/4864 | 415/18723 | 7.04e-28 | 2.76e-25 | 211 |
| GO:004217629 | Skin | cSCC | regulation of protein catabolic process | 198/4864 | 391/18723 | 6.03e-26 | 1.89e-23 | 198 |
| GO:014001415 | Skin | cSCC | mitotic nuclear division | 149/4864 | 287/18723 | 3.59e-21 | 6.43e-19 | 149 |
| GO:001905829 | Skin | cSCC | viral life cycle | 157/4864 | 317/18723 | 1.29e-19 | 1.88e-17 | 157 |
| GO:000081912 | Skin | cSCC | sister chromatid segregation | 110/4864 | 202/18723 | 5.56e-18 | 6.58e-16 | 110 |
| GO:000007012 | Skin | cSCC | mitotic sister chromatid segregation | 96/4864 | 168/18723 | 9.55e-18 | 1.05e-15 | 96 |
| GO:005165624 | Skin | cSCC | establishment of organelle localization | 178/4864 | 390/18723 | 2.18e-17 | 2.32e-15 | 178 |
| GO:000705912 | Skin | cSCC | chromosome segregation | 161/4864 | 346/18723 | 8.34e-17 | 8.57e-15 | 161 |
| GO:001623619 | Skin | cSCC | macroautophagy | 136/4864 | 291/18723 | 1.36e-14 | 9.78e-13 | 136 |
| Page: 1 2 3 4 5 6 7 8 9 10 11 12 13 14 |
| Pathway ID | Tissue | Disease Stage | Description | Gene Ratio | Bg Ratio | pvalue | p.adjust | qvalue | Count |
| hsa04144210 | Esophagus | ESCC | Endocytosis | 186/4205 | 251/8465 | 9.74e-16 | 4.66e-14 | 2.39e-14 | 186 |
| hsa032509 | Esophagus | ESCC | Viral life cycle - HIV-1 | 54/4205 | 63/8465 | 2.01e-09 | 2.17e-08 | 1.11e-08 | 54 |
| hsa0414437 | Esophagus | ESCC | Endocytosis | 186/4205 | 251/8465 | 9.74e-16 | 4.66e-14 | 2.39e-14 | 186 |
| hsa0325014 | Esophagus | ESCC | Viral life cycle - HIV-1 | 54/4205 | 63/8465 | 2.01e-09 | 2.17e-08 | 1.11e-08 | 54 |
| hsa0414422 | Liver | HCC | Endocytosis | 178/4020 | 251/8465 | 2.03e-14 | 5.22e-13 | 2.91e-13 | 178 |
| hsa032502 | Liver | HCC | Viral life cycle - HIV-1 | 46/4020 | 63/8465 | 3.25e-05 | 1.88e-04 | 1.04e-04 | 46 |
| hsa0414432 | Liver | HCC | Endocytosis | 178/4020 | 251/8465 | 2.03e-14 | 5.22e-13 | 2.91e-13 | 178 |
| hsa0325011 | Liver | HCC | Viral life cycle - HIV-1 | 46/4020 | 63/8465 | 3.25e-05 | 1.88e-04 | 1.04e-04 | 46 |
| hsa0414427 | Oral cavity | OSCC | Endocytosis | 174/3704 | 251/8465 | 9.42e-17 | 4.51e-15 | 2.29e-15 | 174 |
| hsa032508 | Oral cavity | OSCC | Viral life cycle - HIV-1 | 45/3704 | 63/8465 | 7.62e-06 | 3.59e-05 | 1.83e-05 | 45 |
| hsa04144112 | Oral cavity | OSCC | Endocytosis | 174/3704 | 251/8465 | 9.42e-17 | 4.51e-15 | 2.29e-15 | 174 |
| hsa0325013 | Oral cavity | OSCC | Viral life cycle - HIV-1 | 45/3704 | 63/8465 | 7.62e-06 | 3.59e-05 | 1.83e-05 | 45 |
| hsa0414428 | Oral cavity | LP | Endocytosis | 121/2418 | 251/8465 | 1.89e-11 | 3.70e-10 | 2.38e-10 | 121 |
| hsa0325022 | Oral cavity | LP | Viral life cycle - HIV-1 | 32/2418 | 63/8465 | 1.55e-04 | 9.08e-04 | 5.86e-04 | 32 |
| hsa0421714 | Oral cavity | LP | Necroptosis | 59/2418 | 159/8465 | 1.15e-02 | 3.91e-02 | 2.52e-02 | 59 |
| hsa0414436 | Oral cavity | LP | Endocytosis | 121/2418 | 251/8465 | 1.89e-11 | 3.70e-10 | 2.38e-10 | 121 |
| hsa0325031 | Oral cavity | LP | Viral life cycle - HIV-1 | 32/2418 | 63/8465 | 1.55e-04 | 9.08e-04 | 5.86e-04 | 32 |
| hsa0421715 | Oral cavity | LP | Necroptosis | 59/2418 | 159/8465 | 1.15e-02 | 3.91e-02 | 2.52e-02 | 59 |
| Page: 1 |
Top |
Cell-cell communication analysis |
| Identification of potential cell-cell interactions between two cell types and their ligand-receptor pairs for different disease states |
| Ligand | Receptor | LRpair | Pathway | Tissue | Disease Stage |
| Page: 1 |
Top |
Single-cell gene regulatory network inference analysis |
| Find out the significant the regulons (TFs) and the target genes of each regulon across cell types for different disease states |
| TF | Cell Type | Tissue | Disease Stage | Target Gene | RSS | Regulon Activity |
| ∗The dot plots of a searched regulon are shown for all cell subpopulations in each disease state of each tissue based on the regulon specific score inferred using pySCENIC and by calculating the average expression. |
| Page: 1 |
Top |
Somatic mutation of malignant transformation related genes |
| Annotation of somatic variants for genes involved in malignant transformation |
| Hugo Symbol | Variant Class | Variant Classification | dbSNP RS | HGVSc | HGVSp | HGVSp Short | SWISSPROT | BIOTYPE | SIFT | PolyPhen | Tumor Sample Barcode | Tissue | Histology | Sex | Age | Stage | Therapy Types | Drugs | Outcome |
| CHMP6 | SNV | Missense_Mutation | novel | c.495G>C | p.Gln165His | p.Q165H | Q96FZ7 | protein_coding | deleterious(0.01) | probably_damaging(0.973) | TCGA-LL-A6FR-01 | Breast | breast invasive carcinoma | Female | <65 | I/II | Chemotherapy | adriamycin | SD |
| CHMP6 | SNV | Missense_Mutation | c.364N>C | p.Glu122Gln | p.E122Q | Q96FZ7 | protein_coding | deleterious(0.03) | probably_damaging(0.927) | TCGA-C5-A7UH-01 | Cervix | cervical & endocervical cancer | Female | <65 | III/IV | Chemotherapy | cisplatin | SD | |
| CHMP6 | SNV | Missense_Mutation | rs769881954 | c.524N>T | p.Ser175Phe | p.S175F | Q96FZ7 | protein_coding | deleterious(0) | possibly_damaging(0.478) | TCGA-IR-A3LA-01 | Cervix | cervical & endocervical cancer | Female | <65 | I/II | Chemotherapy | cisplatin | CR |
| CHMP6 | SNV | Missense_Mutation | novel | c.404A>C | p.Glu135Ala | p.E135A | Q96FZ7 | protein_coding | tolerated(0.4) | benign(0.067) | TCGA-MA-AA42-01 | Cervix | cervical & endocervical cancer | Female | >=65 | I/II | Unknown | Unknown | SD |
| CHMP6 | SNV | Missense_Mutation | novel | c.542N>T | p.Lys181Met | p.K181M | Q96FZ7 | protein_coding | deleterious(0.01) | benign(0.066) | TCGA-VS-A94X-01 | Cervix | cervical & endocervical cancer | Female | <65 | I/II | Chemotherapy | cisplatin | PD |
| CHMP6 | SNV | Missense_Mutation | c.112N>A | p.Ala38Thr | p.A38T | Q96FZ7 | protein_coding | tolerated(1) | benign(0) | TCGA-A6-5665-01 | Colorectum | colon adenocarcinoma | Female | >=65 | I/II | Unknown | Unknown | PD | |
| CHMP6 | SNV | Missense_Mutation | rs762854982 | c.526N>A | p.Glu176Lys | p.E176K | Q96FZ7 | protein_coding | deleterious(0.04) | possibly_damaging(0.826) | TCGA-A6-6781-01 | Colorectum | colon adenocarcinoma | Male | <65 | III/IV | Chemotherapy | oxaliplatin | SD |
| CHMP6 | SNV | Missense_Mutation | novel | c.398N>G | p.Ala133Gly | p.A133G | Q96FZ7 | protein_coding | tolerated(0.31) | benign(0.133) | TCGA-AA-3939-01 | Colorectum | colon adenocarcinoma | Male | >=65 | I/II | Unknown | Unknown | SD |
| CHMP6 | SNV | Missense_Mutation | c.466N>C | p.Ile156Leu | p.I156L | Q96FZ7 | protein_coding | deleterious(0.01) | benign(0.138) | TCGA-AA-3952-01 | Colorectum | colon adenocarcinoma | Male | >=65 | III/IV | Unknown | Unknown | PD | |
| CHMP6 | SNV | Missense_Mutation | rs777217739 | c.230C>T | p.Thr77Met | p.T77M | Q96FZ7 | protein_coding | deleterious(0.02) | probably_damaging(0.997) | TCGA-AU-6004-01 | Colorectum | colon adenocarcinoma | Female | >=65 | I/II | Unknown | Unknown | SD |
| Page: 1 2 |
Top |
Related drugs of malignant transformation related genes |
| Identification of chemicals and drugs interact with genes involved in malignant transfromation |
| (DGIdb 4.0) |
| Entrez ID | Symbol | Category | Interaction Types | Drug Claim Name | Drug Name | PMIDs |
| Page: 1 |

Copyright 2023-Present -The University of Texas Health Science Center at Houston |