| Tissue | Expression Dynamics | Abbreviation |
| Breast |  | IDC: Invasive ductal carcinoma |
| DCIS: Ductal carcinoma in situ |
| Precancer(BRCA1-mut): Precancerous lesion from BRCA1 mutation carriers |
| Cervix | 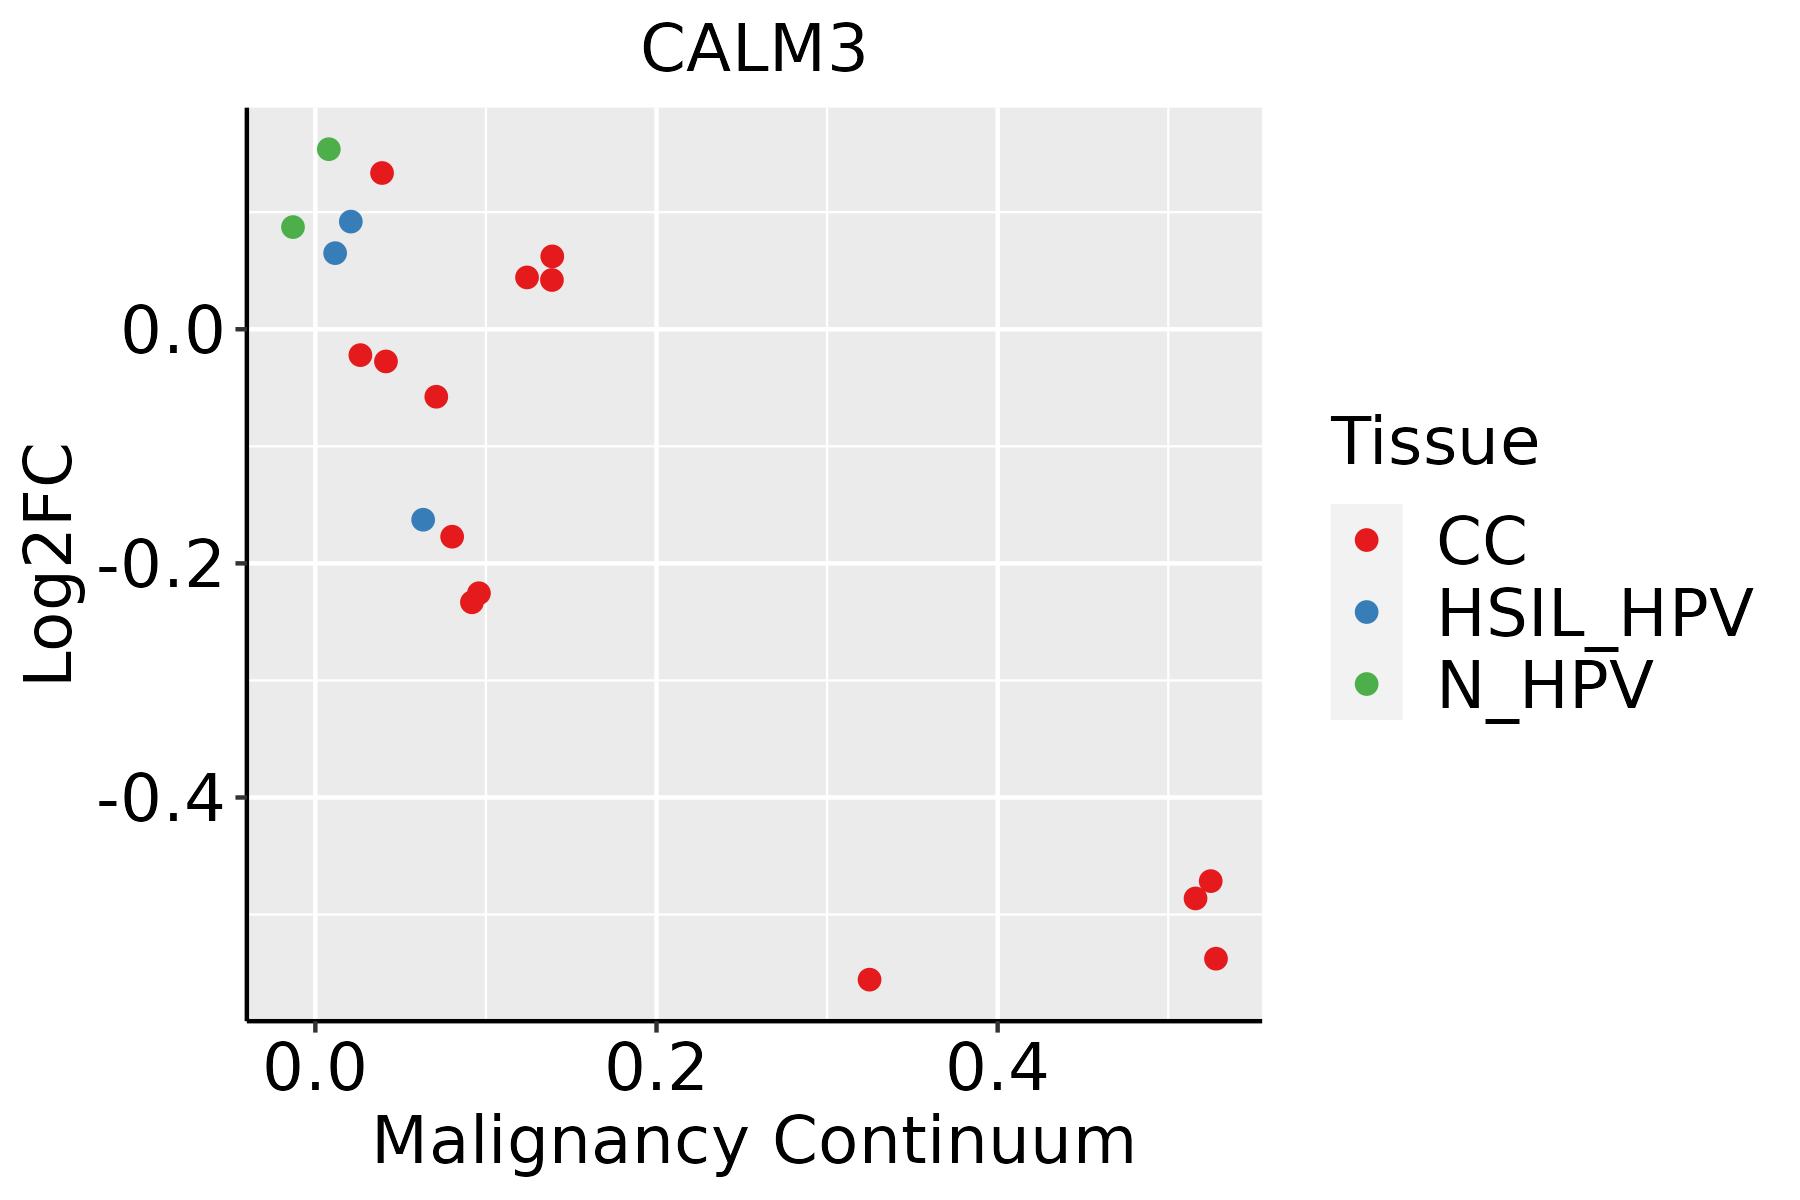 | CC: Cervix cancer |
| HSIL_HPV: HPV-infected high-grade squamous intraepithelial lesions |
| N_HPV: HPV-infected normal cervix |
| Endometrium | 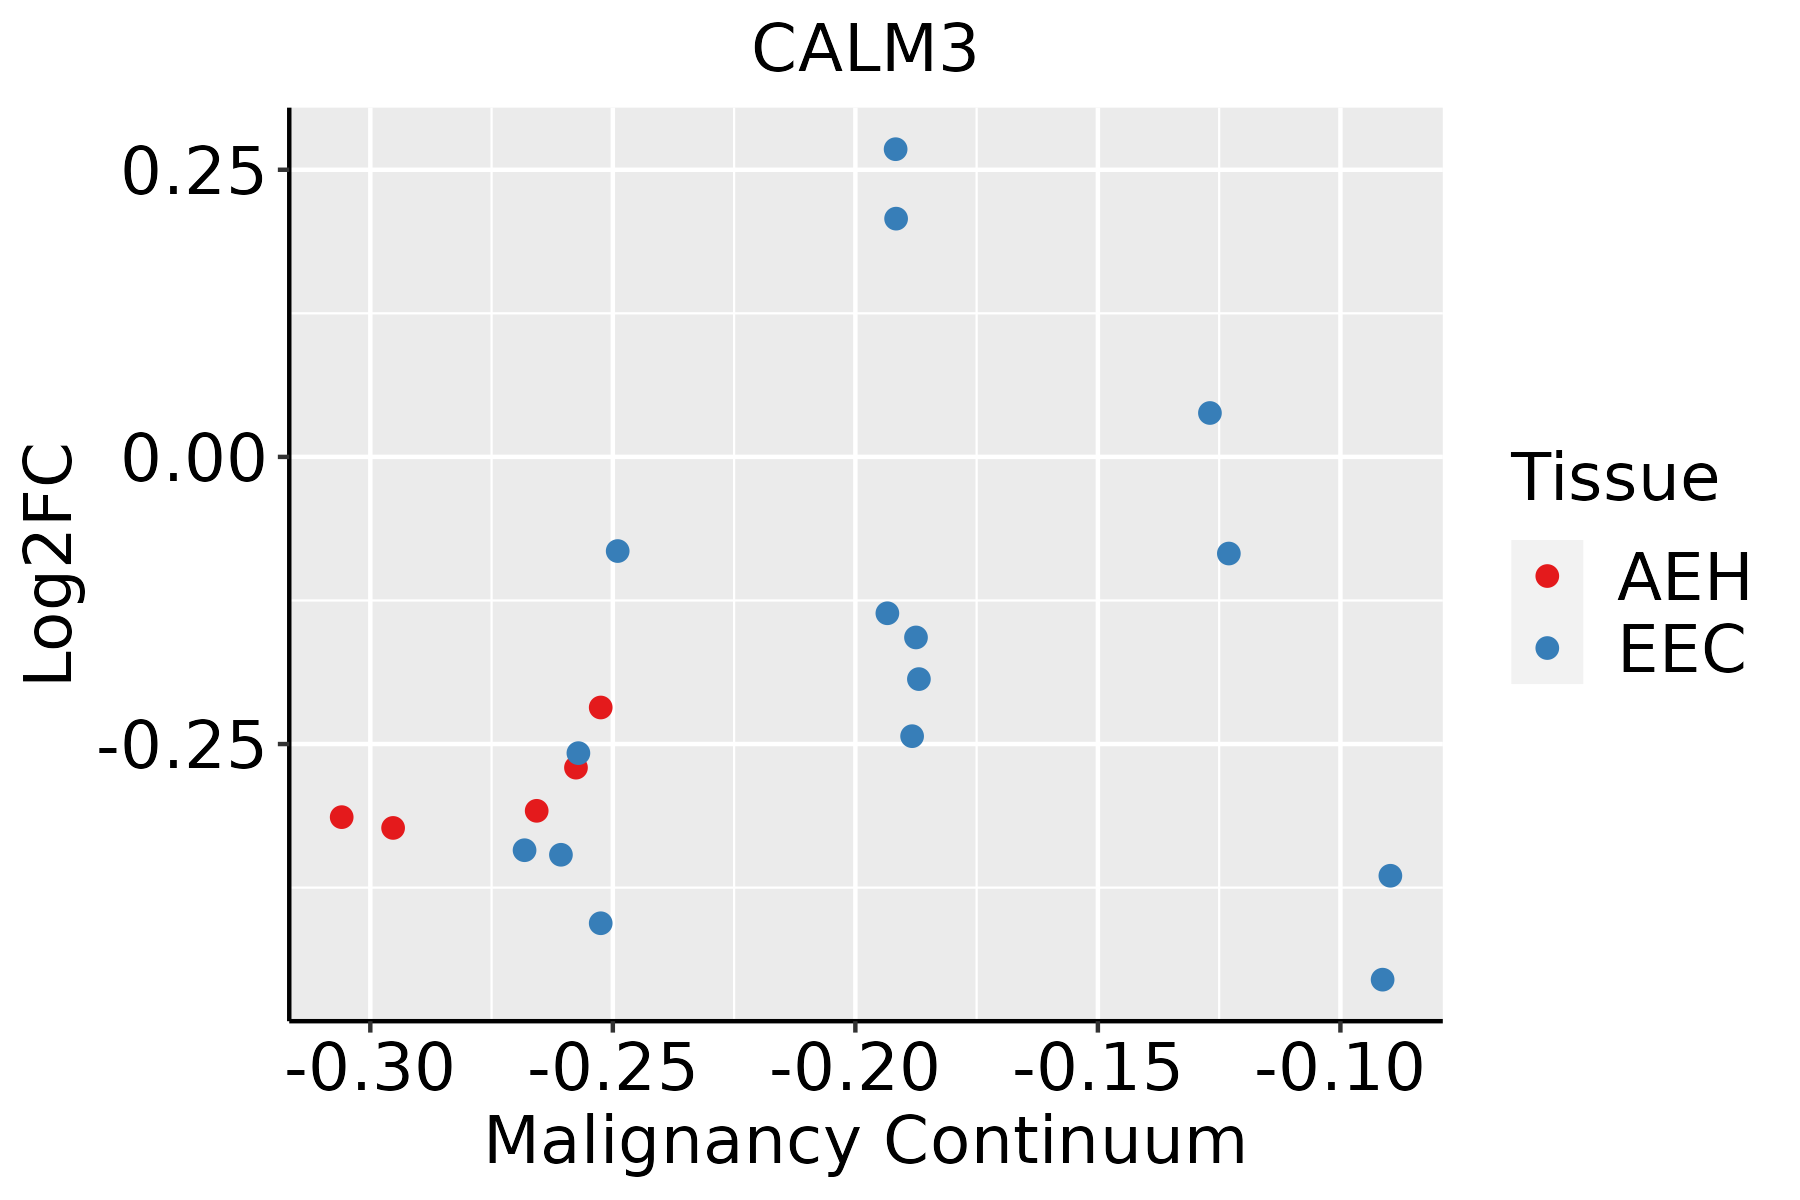 | AEH: Atypical endometrial hyperplasia |
| EEC: Endometrioid Cancer |
| Esophagus | 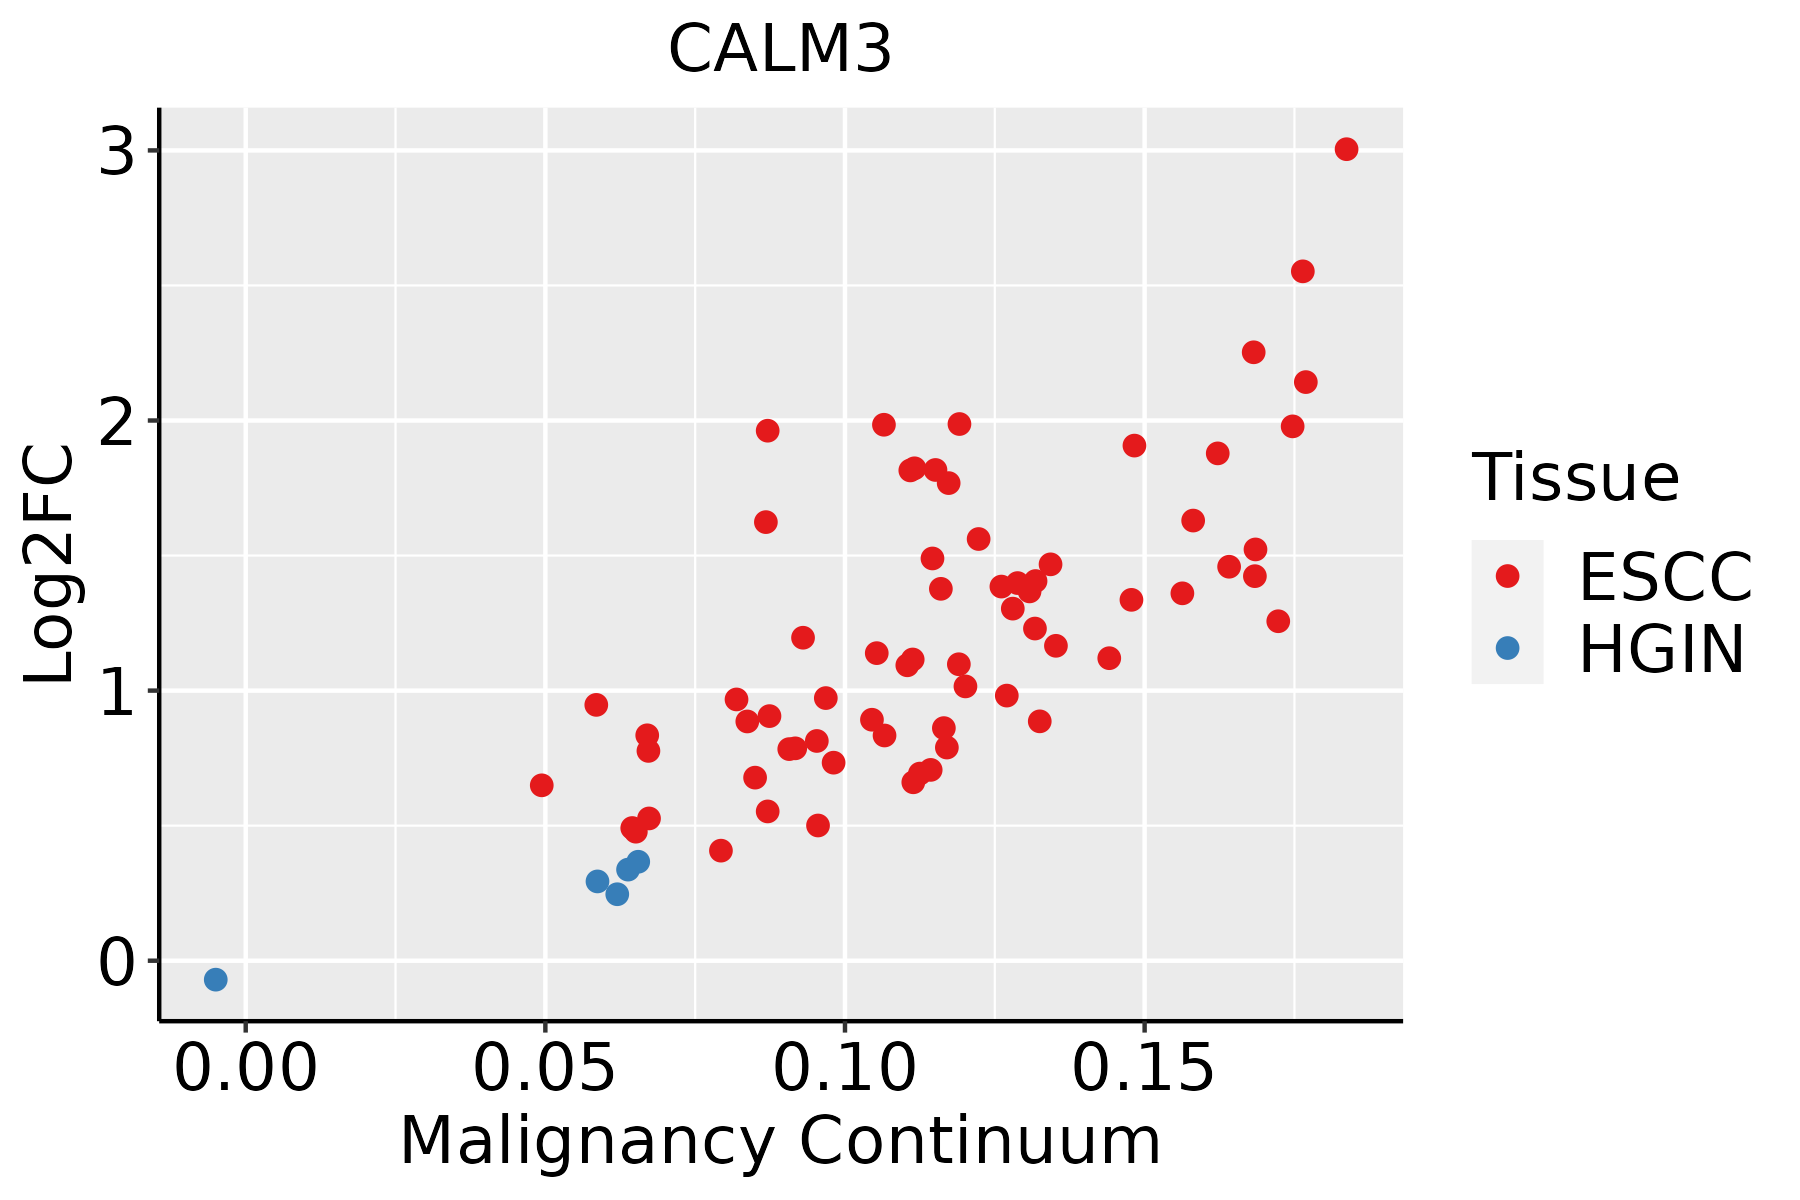 | ESCC: Esophageal squamous cell carcinoma |
| HGIN: High-grade intraepithelial neoplasias |
| LGIN: Low-grade intraepithelial neoplasias |
| Liver | 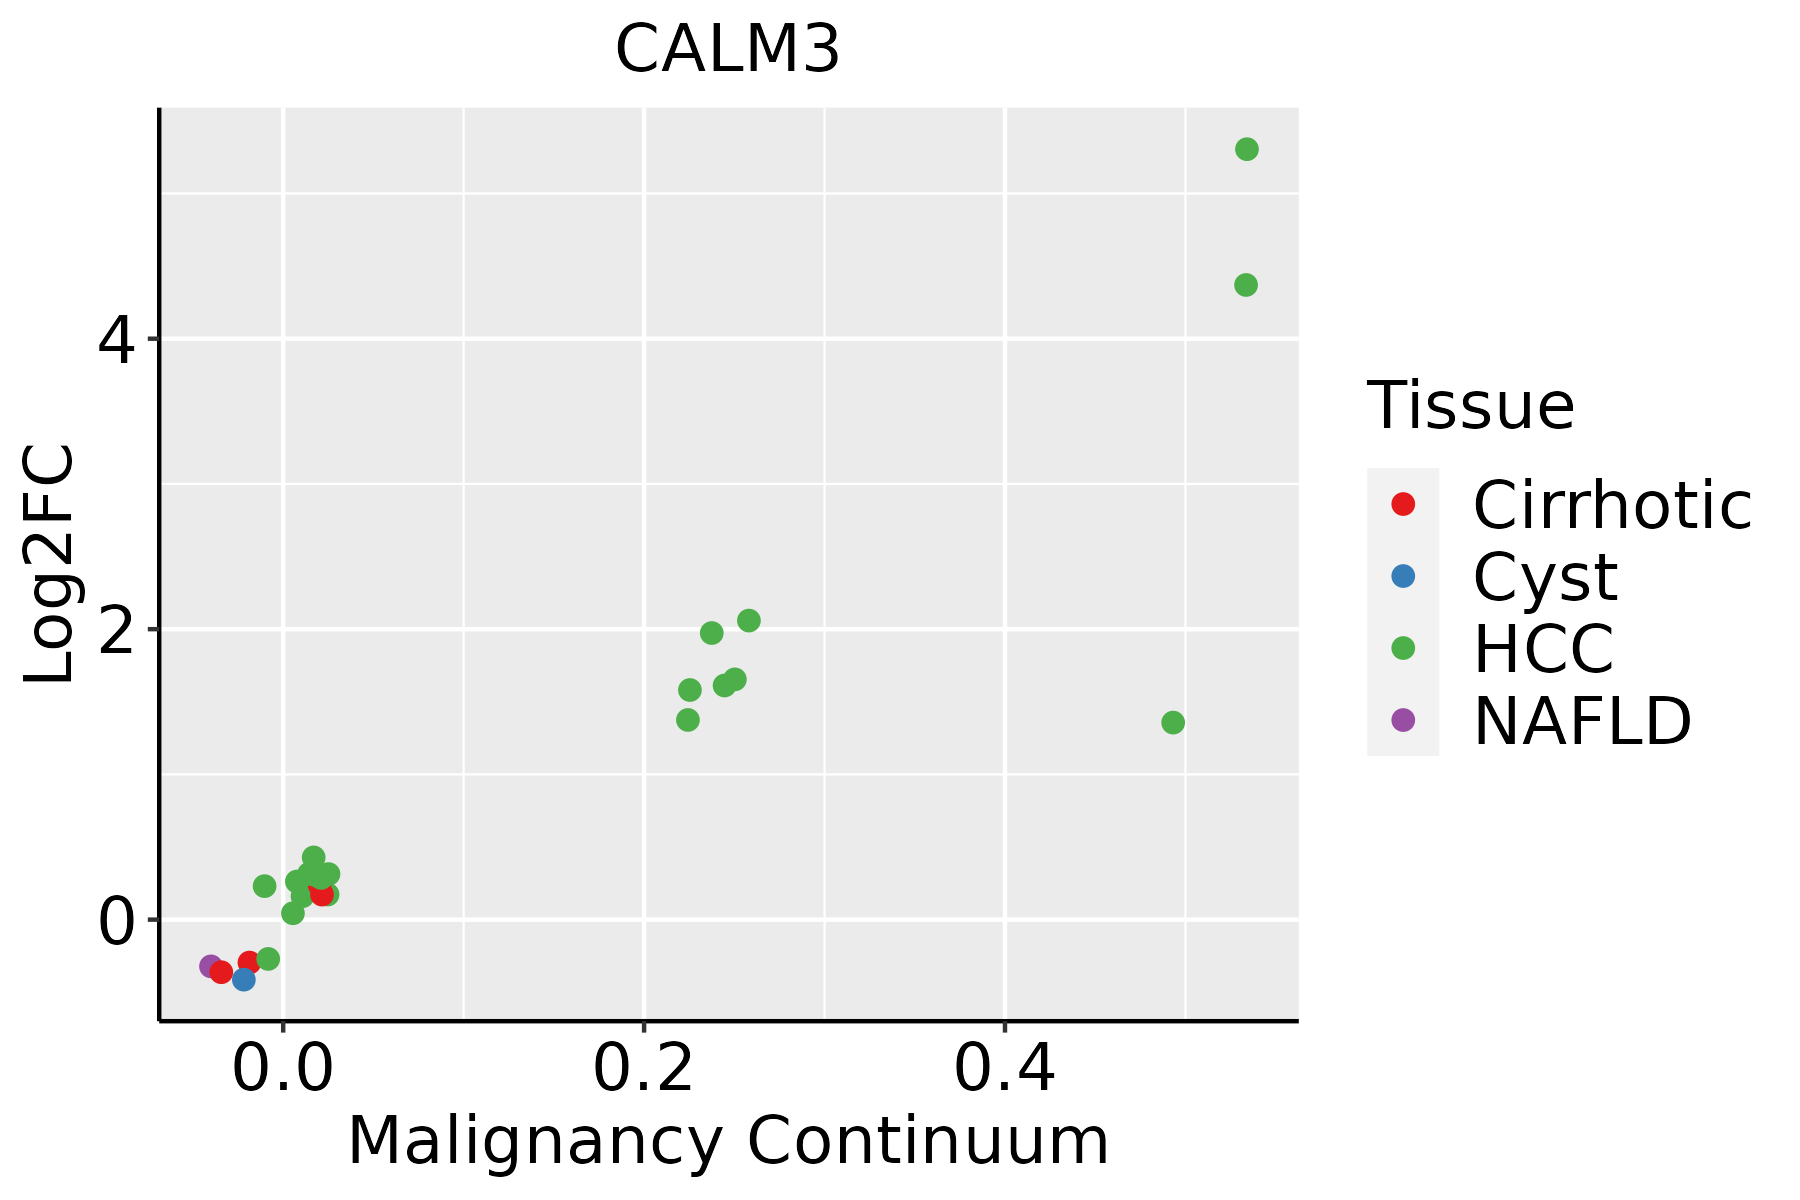 | HCC: Hepatocellular carcinoma |
| NAFLD: Non-alcoholic fatty liver disease |
| Oral Cavity | 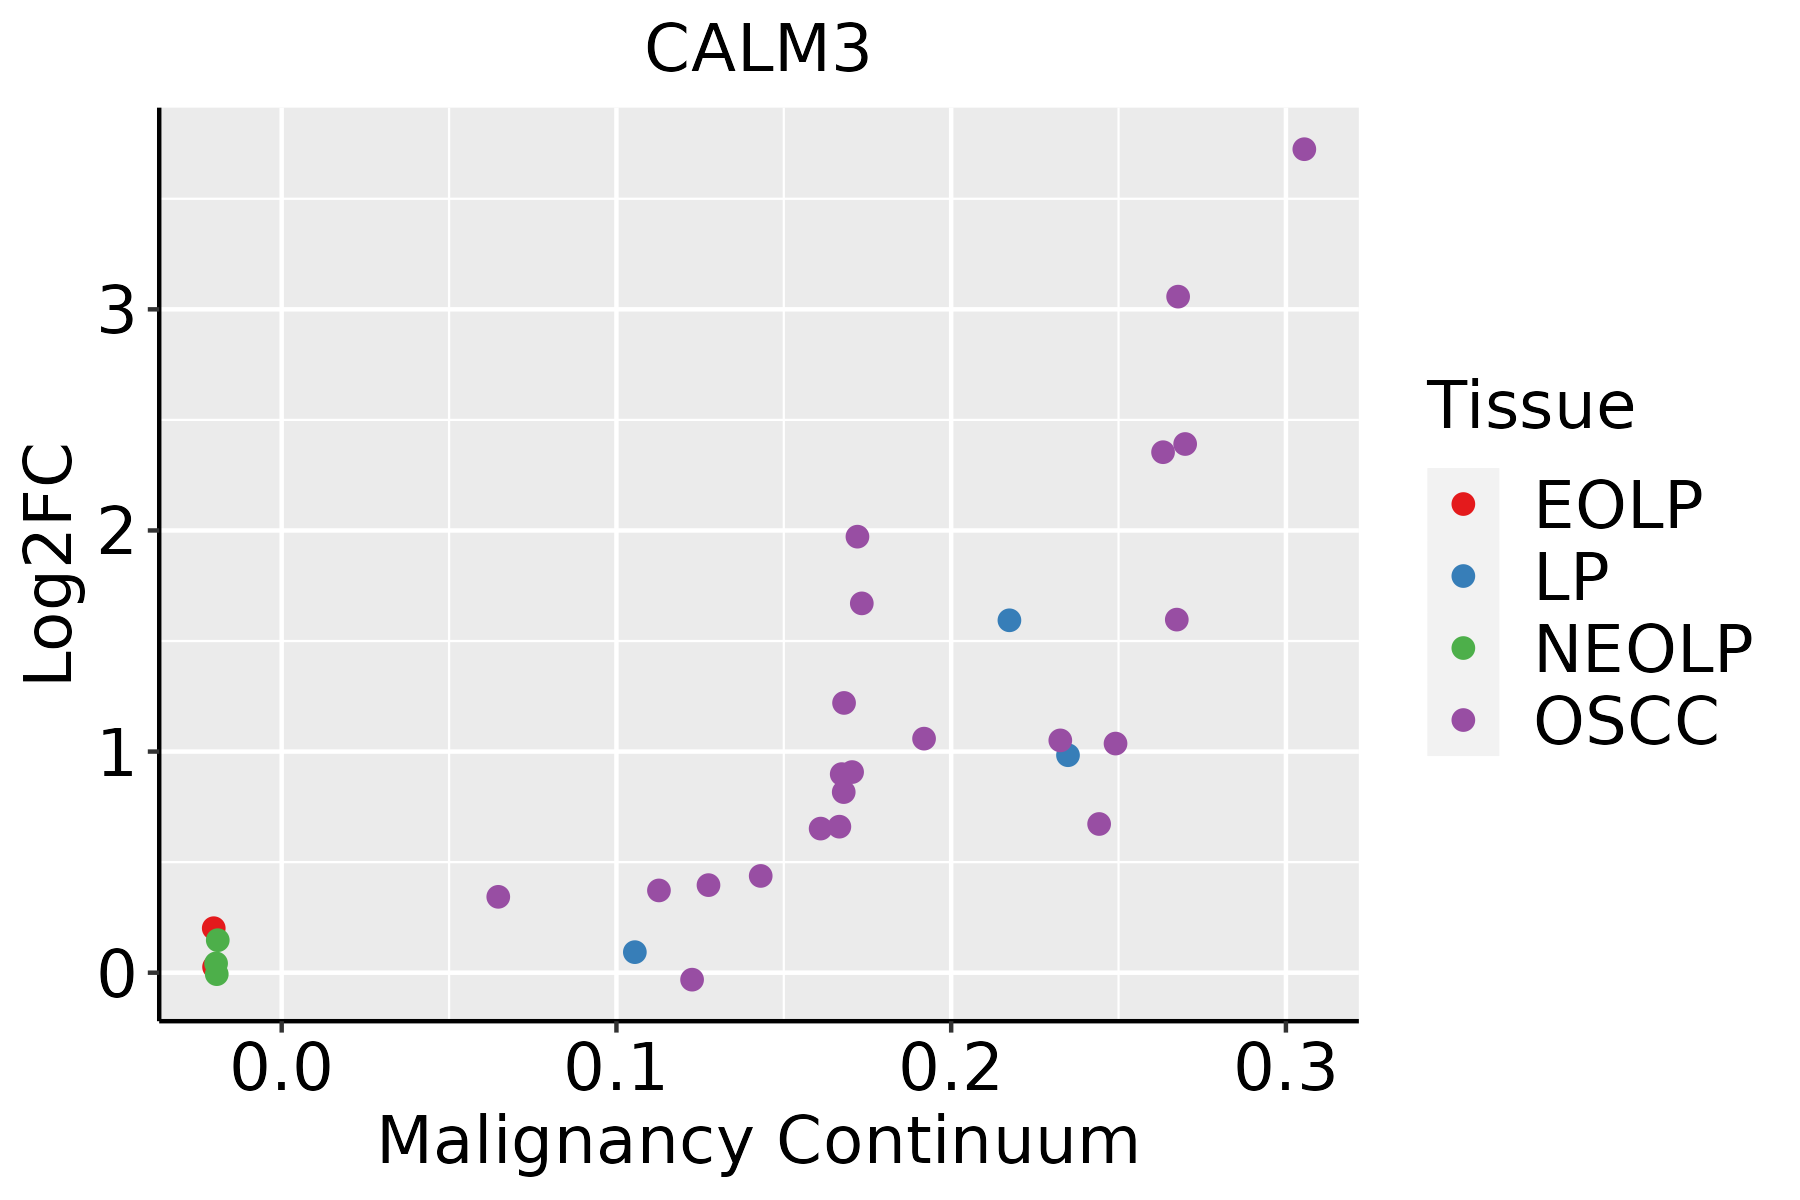 | EOLP: Erosive Oral lichen planus |
| LP: leukoplakia |
| NEOLP: Non-erosive oral lichen planus |
| OSCC: Oral squamous cell carcinoma |
| Prostate | 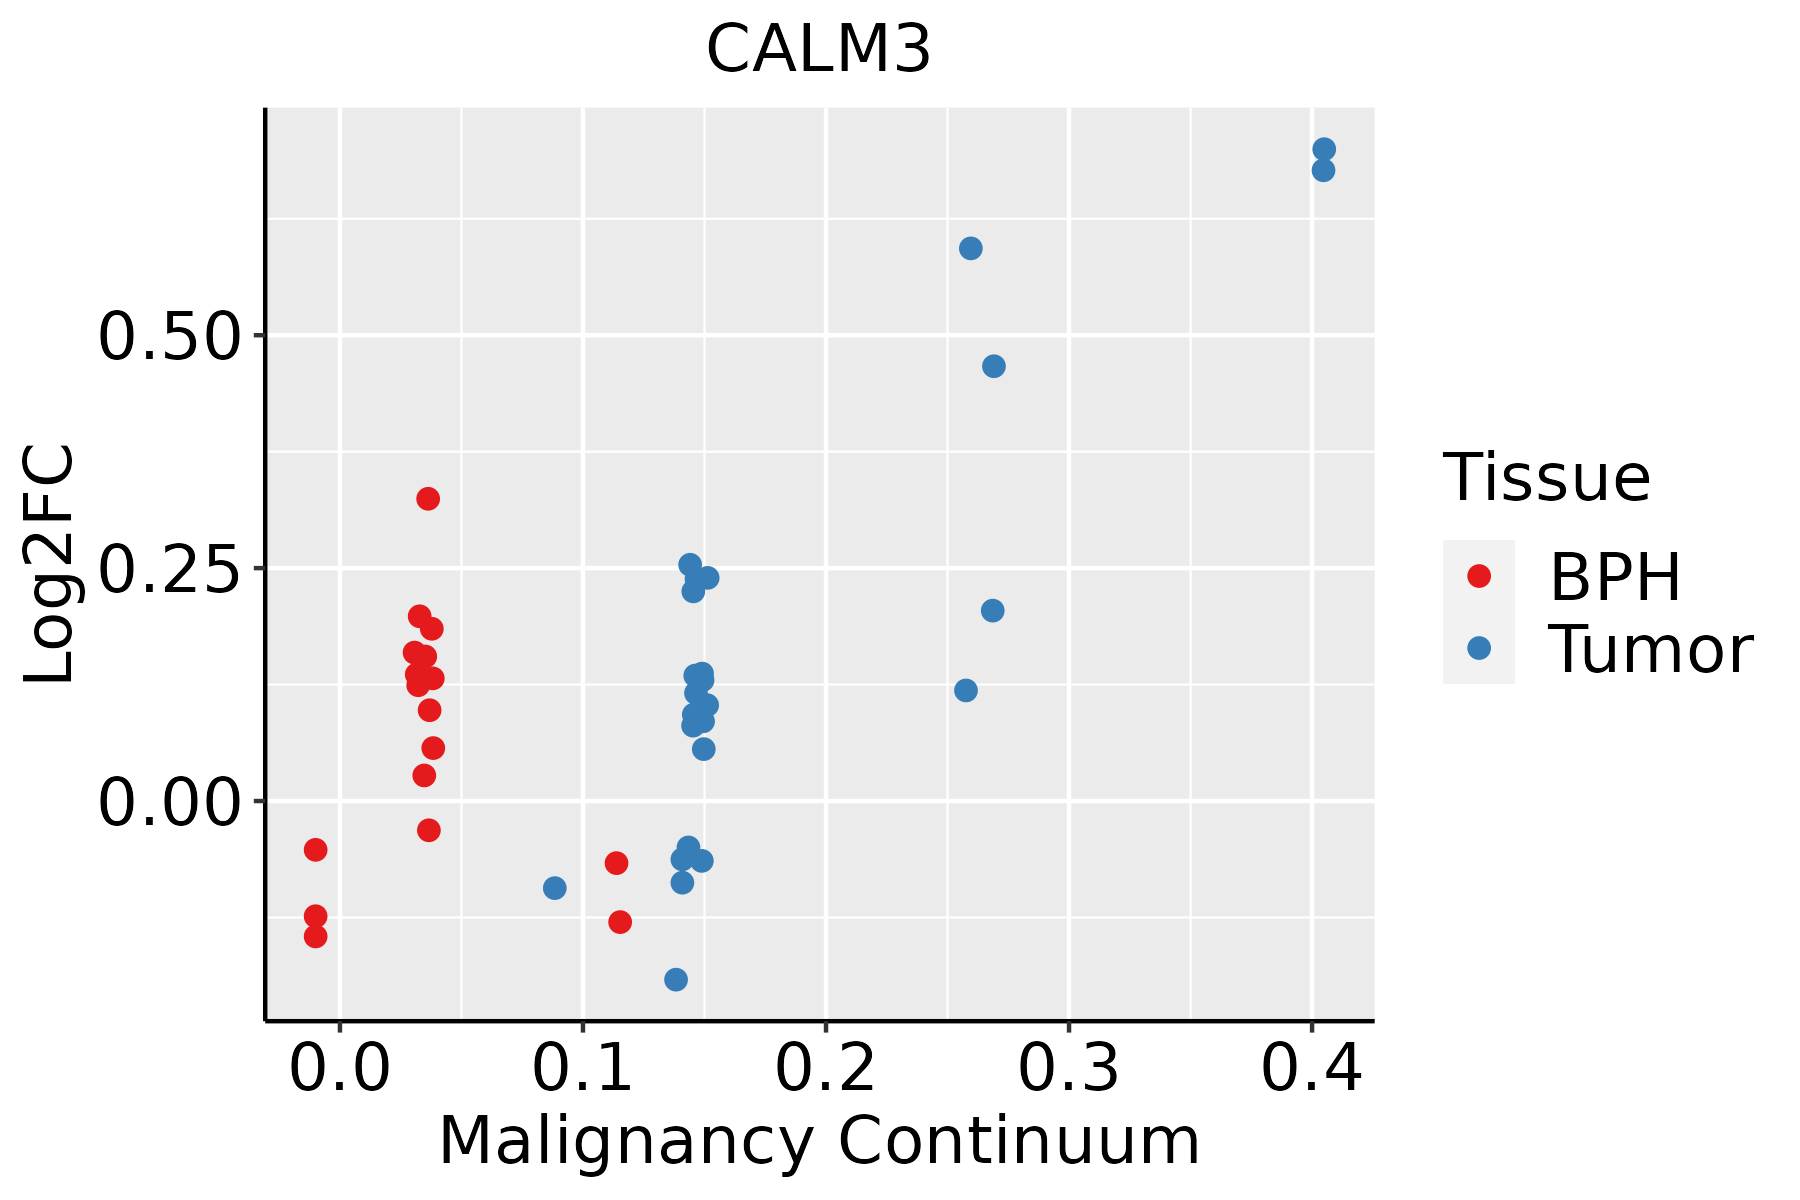 | BPH: Benign Prostatic Hyperplasia |
| Skin | 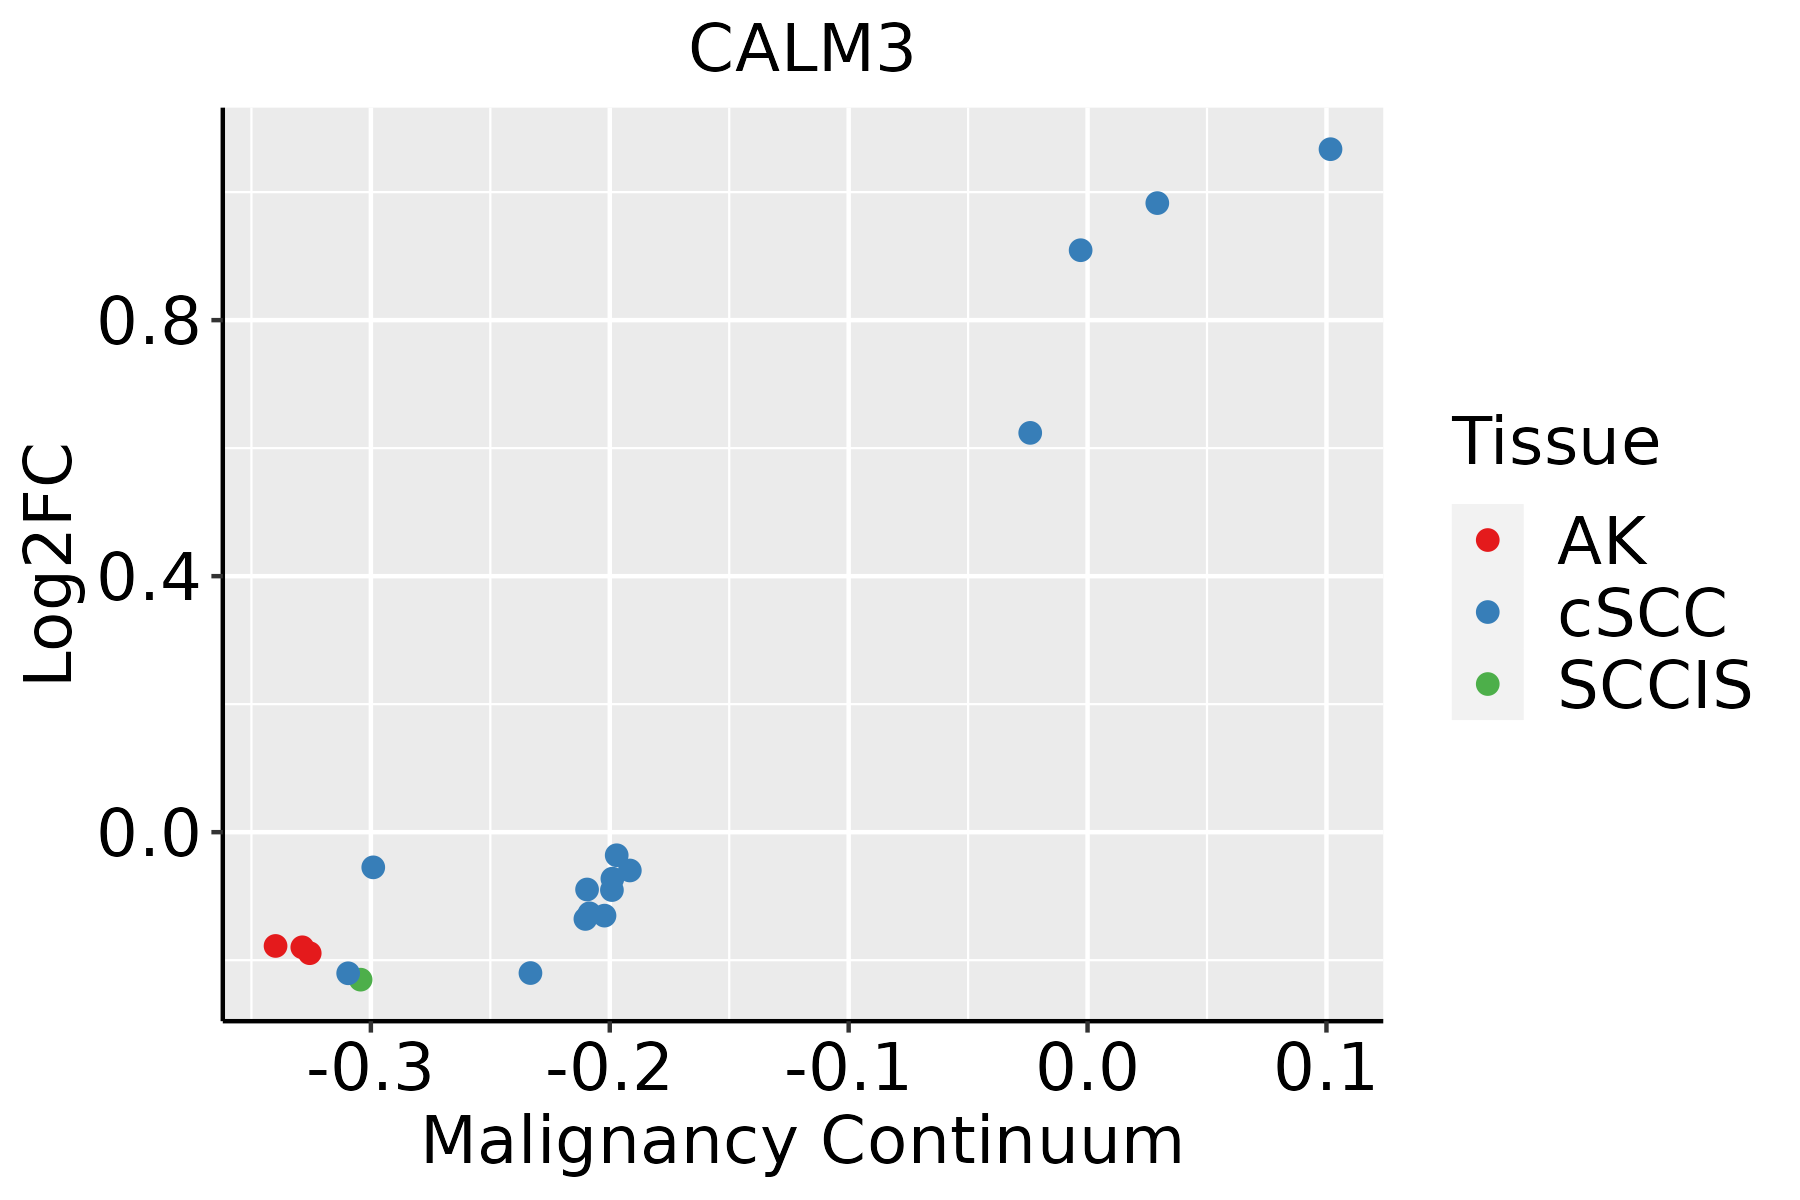 | AK: Actinic keratosis |
| cSCC: Cutaneous squamous cell carcinoma |
| SCCIS:squamous cell carcinoma in situ |
| Thyroid |  | ATC: Anaplastic thyroid cancer |
| HT: Hashimoto's thyroiditis |
| PTC: Papillary thyroid cancer |
| GO ID | Tissue | Disease Stage | Description | Gene Ratio | Bg Ratio | pvalue | p.adjust | Count |
| GO:00325162 | Cervix | CC | positive regulation of phosphoprotein phosphatase activity | 8/2311 | 21/18723 | 2.44e-03 | 1.71e-02 | 8 |
| GO:00433888 | Cervix | CC | positive regulation of DNA binding | 15/2311 | 56/18723 | 2.60e-03 | 1.80e-02 | 15 |
| GO:00484883 | Cervix | CC | synaptic vesicle endocytosis | 16/2311 | 62/18723 | 2.87e-03 | 1.91e-02 | 16 |
| GO:01402383 | Cervix | CC | presynaptic endocytosis | 16/2311 | 62/18723 | 2.87e-03 | 1.91e-02 | 16 |
| GO:00171574 | Cervix | CC | regulation of exocytosis | 39/2311 | 202/18723 | 2.90e-03 | 1.93e-02 | 39 |
| GO:00181076 | Cervix | CC | peptidyl-threonine phosphorylation | 25/2311 | 116/18723 | 3.59e-03 | 2.30e-02 | 25 |
| GO:00989018 | Cervix | CC | regulation of cardiac muscle cell action potential | 9/2311 | 27/18723 | 3.82e-03 | 2.41e-02 | 9 |
| GO:00973059 | Cervix | CC | response to alcohol | 46/2311 | 253/18723 | 4.40e-03 | 2.69e-02 | 46 |
| GO:00182106 | Cervix | CC | peptidyl-threonine modification | 26/2311 | 125/18723 | 4.98e-03 | 2.97e-02 | 26 |
| GO:00019752 | Cervix | CC | response to amphetamine | 10/2311 | 33/18723 | 5.07e-03 | 3.00e-02 | 10 |
| GO:00551174 | Cervix | CC | regulation of cardiac muscle contraction | 18/2311 | 77/18723 | 5.15e-03 | 3.03e-02 | 18 |
| GO:00140754 | Cervix | CC | response to amine | 13/2311 | 49/18723 | 5.34e-03 | 3.10e-02 | 13 |
| GO:00902578 | Cervix | CC | regulation of muscle system process | 45/2311 | 252/18723 | 6.73e-03 | 3.70e-02 | 45 |
| GO:0051279 | Cervix | CC | regulation of release of sequestered calcium ion into cytosol | 18/2311 | 79/18723 | 6.82e-03 | 3.74e-02 | 18 |
| GO:00603154 | Cervix | CC | negative regulation of ryanodine-sensitive calcium-release channel activity | 5/2311 | 11/18723 | 6.92e-03 | 3.74e-02 | 5 |
| GO:00347645 | Cervix | CC | positive regulation of transmembrane transport | 40/2311 | 219/18723 | 6.97e-03 | 3.76e-02 | 40 |
| GO:00068873 | Cervix | CC | exocytosis | 59/2311 | 352/18723 | 8.74e-03 | 4.48e-02 | 59 |
| GO:00364655 | Cervix | CC | synaptic vesicle recycling | 17/2311 | 75/18723 | 8.87e-03 | 4.53e-02 | 17 |
| GO:005123524 | Cervix | N_HPV | maintenance of location | 33/534 | 327/18723 | 3.40e-10 | 2.21e-07 | 33 |
| GO:005165124 | Cervix | N_HPV | maintenance of location in cell | 25/534 | 214/18723 | 2.49e-09 | 7.88e-07 | 25 |
| Pathway ID | Tissue | Disease Stage | Description | Gene Ratio | Bg Ratio | pvalue | p.adjust | qvalue | Count |
| hsa0501218 | Breast | Precancer | Parkinson disease | 99/684 | 266/8465 | 3.58e-42 | 5.65e-40 | 4.33e-40 | 99 |
| hsa0501016 | Breast | Precancer | Alzheimer disease | 103/684 | 384/8465 | 1.03e-29 | 4.66e-28 | 3.57e-28 | 103 |
| hsa0502216 | Breast | Precancer | Pathways of neurodegeneration - multiple diseases | 112/684 | 476/8465 | 6.96e-27 | 2.44e-25 | 1.87e-25 | 112 |
| hsa0516718 | Breast | Precancer | Kaposi sarcoma-associated herpesvirus infection | 36/684 | 194/8465 | 1.68e-06 | 2.53e-05 | 1.94e-05 | 36 |
| hsa0491518 | Breast | Precancer | Estrogen signaling pathway | 28/684 | 138/8465 | 4.10e-06 | 5.39e-05 | 4.13e-05 | 28 |
| hsa0541818 | Breast | Precancer | Fluid shear stress and atherosclerosis | 28/684 | 139/8465 | 4.74e-06 | 6.00e-05 | 4.59e-05 | 28 |
| hsa0541718 | Breast | Precancer | Lipid and atherosclerosis | 37/684 | 215/8465 | 7.64e-06 | 9.29e-05 | 7.12e-05 | 37 |
| hsa042189 | Breast | Precancer | Cellular senescence | 29/684 | 156/8465 | 1.66e-05 | 1.69e-04 | 1.30e-04 | 29 |
| hsa05031 | Breast | Precancer | Amphetamine addiction | 14/684 | 69/8465 | 1.05e-03 | 7.35e-03 | 5.63e-03 | 14 |
| hsa0516316 | Breast | Precancer | Human cytomegalovirus infection | 32/684 | 225/8465 | 1.13e-03 | 7.57e-03 | 5.80e-03 | 32 |
| hsa0497114 | Breast | Precancer | Gastric acid secretion | 13/684 | 76/8465 | 7.35e-03 | 4.07e-02 | 3.12e-02 | 13 |
| hsa0501219 | Breast | Precancer | Parkinson disease | 99/684 | 266/8465 | 3.58e-42 | 5.65e-40 | 4.33e-40 | 99 |
| hsa0501017 | Breast | Precancer | Alzheimer disease | 103/684 | 384/8465 | 1.03e-29 | 4.66e-28 | 3.57e-28 | 103 |
| hsa0502217 | Breast | Precancer | Pathways of neurodegeneration - multiple diseases | 112/684 | 476/8465 | 6.96e-27 | 2.44e-25 | 1.87e-25 | 112 |
| hsa0516719 | Breast | Precancer | Kaposi sarcoma-associated herpesvirus infection | 36/684 | 194/8465 | 1.68e-06 | 2.53e-05 | 1.94e-05 | 36 |
| hsa0491519 | Breast | Precancer | Estrogen signaling pathway | 28/684 | 138/8465 | 4.10e-06 | 5.39e-05 | 4.13e-05 | 28 |
| hsa0541819 | Breast | Precancer | Fluid shear stress and atherosclerosis | 28/684 | 139/8465 | 4.74e-06 | 6.00e-05 | 4.59e-05 | 28 |
| hsa0541719 | Breast | Precancer | Lipid and atherosclerosis | 37/684 | 215/8465 | 7.64e-06 | 9.29e-05 | 7.12e-05 | 37 |
| hsa0421814 | Breast | Precancer | Cellular senescence | 29/684 | 156/8465 | 1.66e-05 | 1.69e-04 | 1.30e-04 | 29 |
| hsa050311 | Breast | Precancer | Amphetamine addiction | 14/684 | 69/8465 | 1.05e-03 | 7.35e-03 | 5.63e-03 | 14 |
| Hugo Symbol | Variant Class | Variant Classification | dbSNP RS | HGVSc | HGVSp | HGVSp Short | SWISSPROT | BIOTYPE | SIFT | PolyPhen | Tumor Sample Barcode | Tissue | Histology | Sex | Age | Stage | Therapy Types | Drugs | Outcome |
| CALM3 | SNV | Missense_Mutation | novel | c.214N>T | p.Met72Leu | p.M72L | P62158 | protein_coding | tolerated_low_confidence(0.66) | benign(0.015) | TCGA-C5-A8YQ-01 | Cervix | cervical & endocervical cancer | Female | >=65 | I/II | Chemotherapy | cisplatin | PD |
| CALM3 | SNV | Missense_Mutation | | c.27N>C | p.Gln9His | p.Q9H | P62158 | protein_coding | deleterious_low_confidence(0.01) | possibly_damaging(0.625) | TCGA-DR-A0ZM-01 | Cervix | cervical & endocervical cancer | Female | <65 | III/IV | Unspecific | Cisplatin | SD |
| CALM3 | SNV | Missense_Mutation | novel | c.150N>T | p.Gln50His | p.Q50H | P62158 | protein_coding | deleterious_low_confidence(0.05) | benign(0.054) | TCGA-MA-AA42-01 | Cervix | cervical & endocervical cancer | Female | >=65 | I/II | Unknown | Unknown | SD |
| CALM3 | SNV | Missense_Mutation | novel | c.150G>T | p.Gln50His | p.Q50H | P62158 | protein_coding | deleterious_low_confidence(0.05) | benign(0.054) | TCGA-AP-A1DK-01 | Endometrium | uterine corpus endometrioid carcinoma | Female | <65 | I/II | Unknown | Unknown | SD |
| CALM3 | SNV | Missense_Mutation | novel | c.31G>A | p.Ala11Thr | p.A11T | P62158 | protein_coding | deleterious_low_confidence(0.02) | benign(0.009) | TCGA-AX-A06F-01 | Endometrium | uterine corpus endometrioid carcinoma | Female | <65 | III/IV | Chemotherapy | carboplatin | SD |
| CALM3 | SNV | Missense_Mutation | novel | c.265G>A | p.Ala89Thr | p.A89T | P62158 | protein_coding | deleterious_low_confidence(0.01) | possibly_damaging(0.774) | TCGA-AX-A1CE-01 | Endometrium | uterine corpus endometrioid carcinoma | Female | <65 | I/II | Unspecific | Paclitaxel | SD |
| CALM3 | SNV | Missense_Mutation | novel | c.107T>C | p.Val36Ala | p.V36A | P62158 | protein_coding | deleterious_low_confidence(0.03) | possibly_damaging(0.842) | TCGA-B5-A3FA-01 | Endometrium | uterine corpus endometrioid carcinoma | Female | >=65 | I/II | Unknown | Unknown | SD |
| CALM3 | SNV | Missense_Mutation | novel | c.319C>T | p.Arg107Cys | p.R107C | P62158 | protein_coding | tolerated_low_confidence(0.07) | benign(0.015) | TCGA-EY-A215-01 | Endometrium | uterine corpus endometrioid carcinoma | Female | <65 | I/II | Unknown | Unknown | SD |
| CALM3 | SNV | Missense_Mutation | novel | c.35A>G | p.Glu12Gly | p.E12G | P62158 | protein_coding | deleterious_low_confidence(0.01) | probably_damaging(0.981) | TCGA-FI-A2F4-01 | Endometrium | uterine corpus endometrioid carcinoma | Female | <65 | I/II | Unknown | Unknown | SD |
| CALM3 | SNV | Missense_Mutation | novel | c.178G>C | p.Gly60Arg | p.G60R | P62158 | protein_coding | deleterious_low_confidence(0.05) | possibly_damaging(0.654) | TCGA-37-A5EL-01 | Lung | lung squamous cell carcinoma | Male | <65 | I/II | Chemotherapy | temodal | PD |


