
|
|||||
|
 | |
| |
| |
| |
| |
| |
|
Gene: BAK1 |
Gene summary for BAK1 |
| Gene information | Species | Human | Gene symbol | BAK1 | Gene ID | 578 |
| Gene name | BCL2 antagonist/killer 1 | |
| Gene Alias | BAK | |
| Cytomap | 6p21.31 | |
| Gene Type | protein-coding | GO ID | GO:0000003 | UniProtAcc | A0A0S2Z391 |
Top |
Malignant transformation analysis |
| Identification of the aberrant gene expression in precancerous and cancerous lesions by comparing the gene expression of stem-like cells in diseased tissues with normal stem cells |
| Entrez ID | Symbol | Replicates | Species | Organ | Tissue | Adj P-value | Log2FC | Malignancy |
| 578 | BAK1 | HTA11_2487_2000001011 | Human | Colorectum | SER | 7.75e-10 | 3.64e-01 | -0.1808 |
| 578 | BAK1 | HTA11_347_2000001011 | Human | Colorectum | AD | 3.98e-08 | 2.24e-01 | -0.1954 |
| 578 | BAK1 | HTA11_2112_2000001011 | Human | Colorectum | SER | 3.40e-09 | 7.94e-01 | -0.2196 |
| 578 | BAK1 | HTA11_696_2000001011 | Human | Colorectum | AD | 1.13e-07 | 2.74e-01 | -0.1464 |
| 578 | BAK1 | HTA11_866_2000001011 | Human | Colorectum | AD | 3.56e-02 | 1.59e-01 | -0.1001 |
| 578 | BAK1 | HTA11_1391_2000001011 | Human | Colorectum | AD | 8.51e-16 | 4.63e-01 | -0.059 |
| 578 | BAK1 | HTA11_5216_2000001011 | Human | Colorectum | SER | 1.82e-03 | 3.95e-01 | -0.1462 |
| 578 | BAK1 | HTA11_10623_2000001011 | Human | Colorectum | AD | 4.12e-02 | 2.54e-01 | -0.0177 |
| 578 | BAK1 | HTA11_99999970781_79442 | Human | Colorectum | MSS | 6.02e-06 | 2.34e-01 | 0.294 |
| 578 | BAK1 | LZE4T | Human | Esophagus | ESCC | 1.12e-02 | 5.17e-02 | 0.0811 |
| 578 | BAK1 | LZE7T | Human | Esophagus | ESCC | 1.02e-07 | 1.83e-01 | 0.0667 |
| 578 | BAK1 | LZE8T | Human | Esophagus | ESCC | 1.74e-05 | 1.14e-01 | 0.067 |
| 578 | BAK1 | LZE20T | Human | Esophagus | ESCC | 2.73e-02 | 8.91e-02 | 0.0662 |
| 578 | BAK1 | LZE22T | Human | Esophagus | ESCC | 1.81e-03 | 1.85e-01 | 0.068 |
| 578 | BAK1 | LZE24T | Human | Esophagus | ESCC | 6.74e-04 | 2.22e-01 | 0.0596 |
| 578 | BAK1 | P2T-E | Human | Esophagus | ESCC | 4.21e-15 | 2.42e-01 | 0.1177 |
| 578 | BAK1 | P4T-E | Human | Esophagus | ESCC | 4.80e-09 | 1.59e-01 | 0.1323 |
| 578 | BAK1 | P5T-E | Human | Esophagus | ESCC | 1.57e-19 | 2.36e-01 | 0.1327 |
| 578 | BAK1 | P8T-E | Human | Esophagus | ESCC | 1.41e-09 | 3.89e-02 | 0.0889 |
| 578 | BAK1 | P10T-E | Human | Esophagus | ESCC | 4.31e-12 | 1.09e-01 | 0.116 |
| Page: 1 2 3 4 5 6 |
| Tissue | Expression Dynamics | Abbreviation |
| Colorectum (GSE201348) |  | FAP: Familial adenomatous polyposis |
| CRC: Colorectal cancer | ||
| Colorectum (HTA11) |  | AD: Adenomas |
| SER: Sessile serrated lesions | ||
| MSI-H: Microsatellite-high colorectal cancer | ||
| MSS: Microsatellite stable colorectal cancer | ||
| Esophagus |  | ESCC: Esophageal squamous cell carcinoma |
| HGIN: High-grade intraepithelial neoplasias | ||
| LGIN: Low-grade intraepithelial neoplasias | ||
| Liver |  | HCC: Hepatocellular carcinoma |
| NAFLD: Non-alcoholic fatty liver disease | ||
| Oral Cavity |  | EOLP: Erosive Oral lichen planus |
| LP: leukoplakia | ||
| NEOLP: Non-erosive oral lichen planus | ||
| OSCC: Oral squamous cell carcinoma | ||
| Skin |  | AK: Actinic keratosis |
| cSCC: Cutaneous squamous cell carcinoma | ||
| SCCIS:squamous cell carcinoma in situ | ||
| Thyroid | 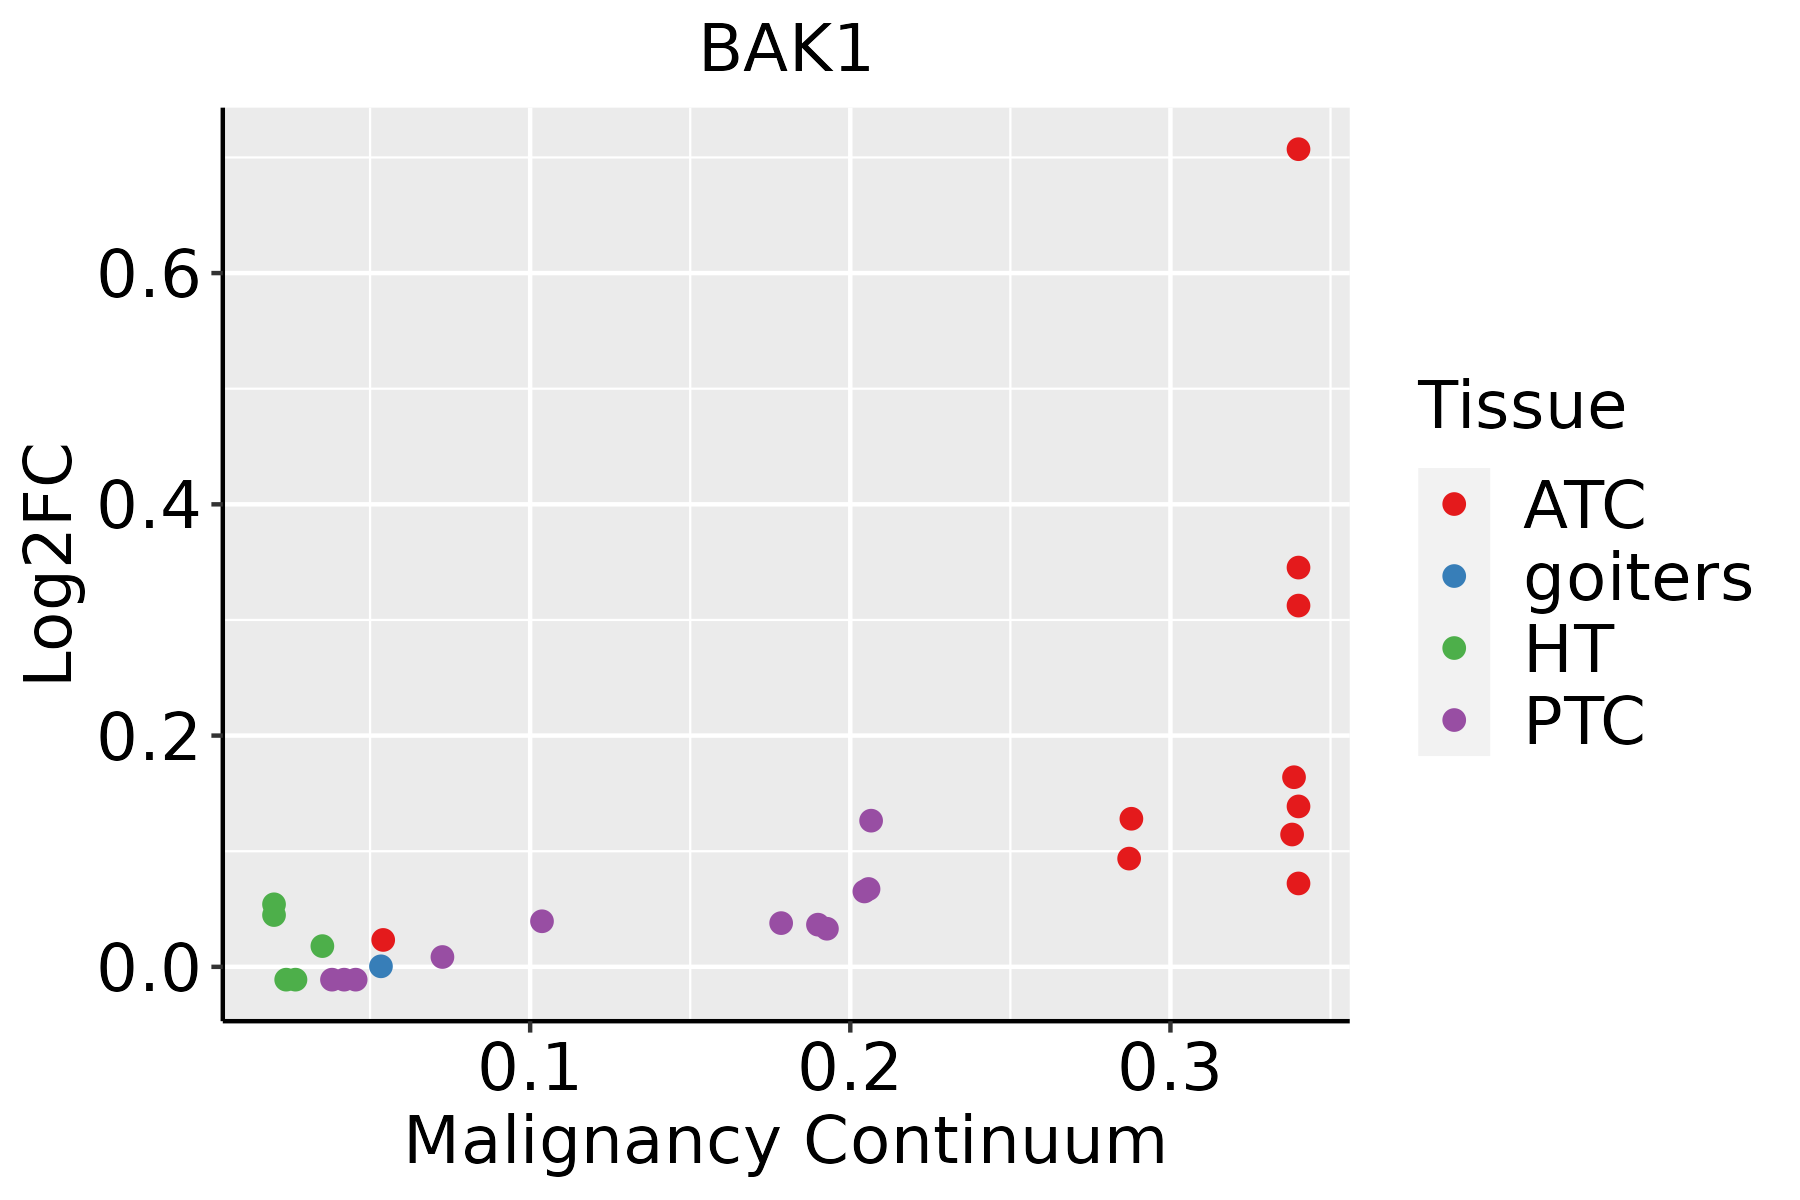 | ATC: Anaplastic thyroid cancer |
| HT: Hashimoto's thyroiditis | ||
| PTC: Papillary thyroid cancer |
| ∗log2FC in expression of this searched gene in stem-like cells from each diseased tissue sample relative to stem-like cells in normal samples in each tissue plotted against the malignancy continuum. Samples are colored based on if they are from different disease stage. |
Top |
Malignant transformation related pathway analysis |
| Find out the enriched GO biological processes and KEGG pathways involved in transition from healthy to precancer to cancer |
| Tissue | Disease Stage | Enriched GO biological Processes |
| Colorectum | AD |  |
| Colorectum | SER |  |
| Colorectum | MSS |  |
| Colorectum | MSI-H |  |
| Colorectum | FAP |  |
| ∗Top 15 enriched GO BP terms are showed in the bar plot of each disease state in each tissue. Each row represents a significant GO biological process which is colored according to the -log10(p.adjust). |
| Page: 1 2 3 4 5 6 7 8 9 |
| GO ID | Tissue | Disease Stage | Description | Gene Ratio | Bg Ratio | pvalue | p.adjust | Count |
| GO:0034620111 | Esophagus | ESCC | cellular response to unfolded protein | 74/8552 | 96/18723 | 3.10e-10 | 8.66e-09 | 74 |
| GO:0001933111 | Esophagus | ESCC | negative regulation of protein phosphorylation | 213/8552 | 342/18723 | 3.54e-10 | 9.76e-09 | 213 |
| GO:0010952111 | Esophagus | ESCC | positive regulation of peptidase activity | 133/8552 | 197/18723 | 4.31e-10 | 1.14e-08 | 133 |
| GO:003464413 | Esophagus | ESCC | cellular response to UV | 70/8552 | 90/18723 | 4.59e-10 | 1.20e-08 | 70 |
| GO:007121419 | Esophagus | ESCC | cellular response to abiotic stimulus | 206/8552 | 331/18723 | 7.52e-10 | 1.88e-08 | 206 |
| GO:010400419 | Esophagus | ESCC | cellular response to environmental stimulus | 206/8552 | 331/18723 | 7.52e-10 | 1.88e-08 | 206 |
| GO:0052547111 | Esophagus | ESCC | regulation of peptidase activity | 275/8552 | 461/18723 | 7.54e-10 | 1.88e-08 | 275 |
| GO:003096818 | Esophagus | ESCC | endoplasmic reticulum unfolded protein response | 59/8552 | 74/18723 | 1.90e-09 | 4.36e-08 | 59 |
| GO:0042542111 | Esophagus | ESCC | response to hydrogen peroxide | 102/8552 | 146/18723 | 2.64e-09 | 5.81e-08 | 102 |
| GO:1905897111 | Esophagus | ESCC | regulation of response to endoplasmic reticulum stress | 63/8552 | 82/18723 | 8.16e-09 | 1.66e-07 | 63 |
| GO:001082215 | Esophagus | ESCC | positive regulation of mitochondrion organization | 58/8552 | 74/18723 | 8.55e-09 | 1.73e-07 | 58 |
| GO:007147816 | Esophagus | ESCC | cellular response to radiation | 122/8552 | 186/18723 | 3.07e-08 | 5.73e-07 | 122 |
| GO:0052548111 | Esophagus | ESCC | regulation of endopeptidase activity | 253/8552 | 432/18723 | 3.68e-08 | 6.78e-07 | 253 |
| GO:0070059111 | Esophagus | ESCC | intrinsic apoptotic signaling pathway in response to endoplasmic reticulum stress | 50/8552 | 63/18723 | 4.37e-08 | 7.96e-07 | 50 |
| GO:000183619 | Esophagus | ESCC | release of cytochrome c from mitochondria | 47/8552 | 59/18723 | 9.02e-08 | 1.51e-06 | 47 |
| GO:0002262111 | Esophagus | ESCC | myeloid cell homeostasis | 104/8552 | 157/18723 | 1.49e-07 | 2.36e-06 | 104 |
| GO:0010950111 | Esophagus | ESCC | positive regulation of endopeptidase activity | 116/8552 | 179/18723 | 1.77e-07 | 2.79e-06 | 116 |
| GO:004690217 | Esophagus | ESCC | regulation of mitochondrial membrane permeability | 49/8552 | 63/18723 | 1.91e-07 | 2.97e-06 | 49 |
| GO:0061458110 | Esophagus | ESCC | reproductive system development | 247/8552 | 427/18723 | 2.24e-07 | 3.42e-06 | 247 |
| GO:00905599 | Esophagus | ESCC | regulation of membrane permeability | 58/8552 | 78/18723 | 2.38e-07 | 3.61e-06 | 58 |
| Page: 1 2 3 4 5 6 7 8 9 10 11 12 13 14 15 16 17 18 19 20 21 22 23 24 25 26 27 28 29 30 31 32 33 34 35 36 37 38 |
| Pathway ID | Tissue | Disease Stage | Description | Gene Ratio | Bg Ratio | pvalue | p.adjust | qvalue | Count |
| hsa05022 | Colorectum | AD | Pathways of neurodegeneration - multiple diseases | 201/2092 | 476/8465 | 4.54e-18 | 1.27e-16 | 8.09e-17 | 201 |
| hsa04141 | Colorectum | AD | Protein processing in endoplasmic reticulum | 80/2092 | 174/8465 | 5.96e-10 | 1.25e-08 | 7.96e-09 | 80 |
| hsa05132 | Colorectum | AD | Salmonella infection | 102/2092 | 249/8465 | 7.65e-09 | 1.28e-07 | 8.17e-08 | 102 |
| hsa05130 | Colorectum | AD | Pathogenic Escherichia coli infection | 79/2092 | 197/8465 | 1.05e-06 | 1.36e-05 | 8.65e-06 | 79 |
| hsa05213 | Colorectum | AD | Endometrial cancer | 29/2092 | 58/8465 | 2.69e-05 | 2.57e-04 | 1.64e-04 | 29 |
| hsa05216 | Colorectum | AD | Thyroid cancer | 21/2092 | 37/8465 | 3.05e-05 | 2.76e-04 | 1.76e-04 | 21 |
| hsa05210 | Colorectum | AD | Colorectal cancer | 35/2092 | 86/8465 | 7.54e-04 | 5.49e-03 | 3.50e-03 | 35 |
| hsa05170 | Colorectum | AD | Human immunodeficiency virus 1 infection | 72/2092 | 212/8465 | 1.40e-03 | 8.46e-03 | 5.39e-03 | 72 |
| hsa05220 | Colorectum | AD | Chronic myeloid leukemia | 31/2092 | 76/8465 | 1.41e-03 | 8.46e-03 | 5.39e-03 | 31 |
| hsa05225 | Colorectum | AD | Hepatocellular carcinoma | 59/2092 | 168/8465 | 1.50e-03 | 8.69e-03 | 5.54e-03 | 59 |
| hsa05163 | Colorectum | AD | Human cytomegalovirus infection | 75/2092 | 225/8465 | 2.00e-03 | 1.10e-02 | 7.01e-03 | 75 |
| hsa05160 | Colorectum | AD | Hepatitis C | 54/2092 | 157/8465 | 3.87e-03 | 1.96e-02 | 1.25e-02 | 54 |
| hsa05212 | Colorectum | AD | Pancreatic cancer | 29/2092 | 76/8465 | 6.25e-03 | 2.68e-02 | 1.71e-02 | 29 |
| hsa050221 | Colorectum | AD | Pathways of neurodegeneration - multiple diseases | 201/2092 | 476/8465 | 4.54e-18 | 1.27e-16 | 8.09e-17 | 201 |
| hsa041411 | Colorectum | AD | Protein processing in endoplasmic reticulum | 80/2092 | 174/8465 | 5.96e-10 | 1.25e-08 | 7.96e-09 | 80 |
| hsa051321 | Colorectum | AD | Salmonella infection | 102/2092 | 249/8465 | 7.65e-09 | 1.28e-07 | 8.17e-08 | 102 |
| hsa051301 | Colorectum | AD | Pathogenic Escherichia coli infection | 79/2092 | 197/8465 | 1.05e-06 | 1.36e-05 | 8.65e-06 | 79 |
| hsa052131 | Colorectum | AD | Endometrial cancer | 29/2092 | 58/8465 | 2.69e-05 | 2.57e-04 | 1.64e-04 | 29 |
| hsa052161 | Colorectum | AD | Thyroid cancer | 21/2092 | 37/8465 | 3.05e-05 | 2.76e-04 | 1.76e-04 | 21 |
| hsa052101 | Colorectum | AD | Colorectal cancer | 35/2092 | 86/8465 | 7.54e-04 | 5.49e-03 | 3.50e-03 | 35 |
| Page: 1 2 3 4 5 6 7 8 9 10 11 12 13 |
Top |
Cell-cell communication analysis |
| Identification of potential cell-cell interactions between two cell types and their ligand-receptor pairs for different disease states |
| Ligand | Receptor | LRpair | Pathway | Tissue | Disease Stage |
| Page: 1 |
Top |
Single-cell gene regulatory network inference analysis |
| Find out the significant the regulons (TFs) and the target genes of each regulon across cell types for different disease states |
| TF | Cell Type | Tissue | Disease Stage | Target Gene | RSS | Regulon Activity |
| ∗The dot plots of a searched regulon are shown for all cell subpopulations in each disease state of each tissue based on the regulon specific score inferred using pySCENIC and by calculating the average expression. |
| Page: 1 |
Top |
Somatic mutation of malignant transformation related genes |
| Annotation of somatic variants for genes involved in malignant transformation |
| Hugo Symbol | Variant Class | Variant Classification | dbSNP RS | HGVSc | HGVSp | HGVSp Short | SWISSPROT | BIOTYPE | SIFT | PolyPhen | Tumor Sample Barcode | Tissue | Histology | Sex | Age | Stage | Therapy Types | Drugs | Outcome |
| BAK1 | SNV | Missense_Mutation | c.617N>A | p.Arg206Gln | p.R206Q | Q16611 | protein_coding | tolerated(0.17) | benign(0.435) | TCGA-A8-A09G-01 | Breast | breast invasive carcinoma | Female | >=65 | III/IV | Unknown | Unknown | SD | |
| BAK1 | SNV | Missense_Mutation | novel | c.87G>T | p.Gln29His | p.Q29H | Q16611 | protein_coding | deleterious(0.02) | benign(0.031) | TCGA-AN-A046-01 | Breast | breast invasive carcinoma | Female | >=65 | I/II | Unknown | Unknown | SD |
| BAK1 | SNV | Missense_Mutation | novel | c.268G>A | p.Asp90Asn | p.D90N | Q16611 | protein_coding | tolerated(0.08) | benign(0.079) | TCGA-LQ-A4E4-01 | Breast | breast invasive carcinoma | Female | >=65 | III/IV | Hormone Therapy | anastrozole | PD |
| BAK1 | SNV | Missense_Mutation | novel | c.125N>A | p.Arg42His | p.R42H | Q16611 | protein_coding | deleterious(0.03) | probably_damaging(0.961) | TCGA-EK-A3GM-01 | Cervix | cervical & endocervical cancer | Female | >=65 | I/II | Unknown | Unknown | SD |
| BAK1 | SNV | Missense_Mutation | c.623N>A | p.Phe208Tyr | p.F208Y | Q16611 | protein_coding | tolerated(0.05) | benign(0.003) | TCGA-AA-3672-01 | Colorectum | colon adenocarcinoma | Female | >=65 | III/IV | Unknown | Unknown | SD | |
| BAK1 | SNV | Missense_Mutation | novel | c.415N>A | p.Ala139Thr | p.A139T | Q16611 | protein_coding | deleterious(0.05) | probably_damaging(0.992) | TCGA-AA-A010-01 | Colorectum | colon adenocarcinoma | Female | <65 | I/II | Chemotherapy | folinic | CR |
| BAK1 | SNV | Missense_Mutation | c.624N>A | p.Phe208Leu | p.F208L | Q16611 | protein_coding | tolerated(0.08) | benign(0.054) | TCGA-CA-6717-01 | Colorectum | colon adenocarcinoma | Male | <65 | I/II | Chemotherapy | oxaliplatin | CR | |
| BAK1 | SNV | Missense_Mutation | novel | c.260G>A | p.Arg87Gln | p.R87Q | Q16611 | protein_coding | tolerated(0.47) | benign(0.001) | TCGA-AJ-A3EL-01 | Endometrium | uterine corpus endometrioid carcinoma | Female | <65 | I/II | Unknown | Unknown | SD |
| BAK1 | SNV | Missense_Mutation | c.182N>C | p.Val61Ala | p.V61A | Q16611 | protein_coding | tolerated(0.78) | benign(0) | TCGA-AP-A051-01 | Endometrium | uterine corpus endometrioid carcinoma | Female | >=65 | I/II | Unknown | Unknown | SD | |
| BAK1 | SNV | Missense_Mutation | rs778171445 | c.263N>A | p.Arg88His | p.R88H | Q16611 | protein_coding | deleterious(0) | probably_damaging(0.956) | TCGA-AP-A0LM-01 | Endometrium | uterine corpus endometrioid carcinoma | Female | <65 | III/IV | Chemotherapy | cisplatin | SD |
| Page: 1 2 3 4 |
Top |
Related drugs of malignant transformation related genes |
| Identification of chemicals and drugs interact with genes involved in malignant transfromation |
| (DGIdb 4.0) |
| Entrez ID | Symbol | Category | Interaction Types | Drug Claim Name | Drug Name | PMIDs |
| 578 | BAK1 | TUMOR SUPPRESSOR, DRUGGABLE GENOME | KERACYANIN | KERACYANIN | 17360708 |
| Page: 1 |

Copyright 2023-Present -The University of Texas Health Science Center at Houston |