
|
|||||
|
 | |
| |
| |
| |
| |
| |
|
Gene: ARHGEF2 |
Gene summary for ARHGEF2 |
| Gene information | Species | Human | Gene symbol | ARHGEF2 | Gene ID | 9181 |
| Gene name | Rho/Rac guanine nucleotide exchange factor 2 | |
| Gene Alias | GEF | |
| Cytomap | 1q22 | |
| Gene Type | protein-coding | GO ID | GO:0000226 | UniProtAcc | Q92974 |
Top |
Malignant transformation analysis |
| Identification of the aberrant gene expression in precancerous and cancerous lesions by comparing the gene expression of stem-like cells in diseased tissues with normal stem cells |
| Entrez ID | Symbol | Replicates | Species | Organ | Tissue | Adj P-value | Log2FC | Malignancy |
| 9181 | ARHGEF2 | LZE7T | Human | Esophagus | ESCC | 5.06e-09 | 4.46e-01 | 0.0667 |
| 9181 | ARHGEF2 | LZE24T | Human | Esophagus | ESCC | 1.89e-03 | 5.31e-02 | 0.0596 |
| 9181 | ARHGEF2 | P2T-E | Human | Esophagus | ESCC | 1.35e-27 | 6.32e-01 | 0.1177 |
| 9181 | ARHGEF2 | P4T-E | Human | Esophagus | ESCC | 1.54e-07 | 2.35e-01 | 0.1323 |
| 9181 | ARHGEF2 | P5T-E | Human | Esophagus | ESCC | 2.90e-07 | 1.38e-01 | 0.1327 |
| 9181 | ARHGEF2 | P8T-E | Human | Esophagus | ESCC | 6.50e-09 | 1.25e-01 | 0.0889 |
| 9181 | ARHGEF2 | P9T-E | Human | Esophagus | ESCC | 1.86e-08 | 1.84e-01 | 0.1131 |
| 9181 | ARHGEF2 | P10T-E | Human | Esophagus | ESCC | 9.96e-19 | 3.10e-01 | 0.116 |
| 9181 | ARHGEF2 | P11T-E | Human | Esophagus | ESCC | 8.03e-08 | 5.21e-01 | 0.1426 |
| 9181 | ARHGEF2 | P12T-E | Human | Esophagus | ESCC | 6.61e-17 | 1.66e-01 | 0.1122 |
| 9181 | ARHGEF2 | P15T-E | Human | Esophagus | ESCC | 1.69e-09 | 1.88e-01 | 0.1149 |
| 9181 | ARHGEF2 | P16T-E | Human | Esophagus | ESCC | 2.91e-12 | 2.88e-01 | 0.1153 |
| 9181 | ARHGEF2 | P19T-E | Human | Esophagus | ESCC | 7.98e-03 | 4.43e-01 | 0.1662 |
| 9181 | ARHGEF2 | P20T-E | Human | Esophagus | ESCC | 5.10e-09 | 1.03e-01 | 0.1124 |
| 9181 | ARHGEF2 | P21T-E | Human | Esophagus | ESCC | 4.04e-15 | 1.53e-01 | 0.1617 |
| 9181 | ARHGEF2 | P22T-E | Human | Esophagus | ESCC | 4.45e-07 | 9.84e-02 | 0.1236 |
| 9181 | ARHGEF2 | P23T-E | Human | Esophagus | ESCC | 1.25e-07 | 2.08e-01 | 0.108 |
| 9181 | ARHGEF2 | P24T-E | Human | Esophagus | ESCC | 1.18e-11 | 3.11e-01 | 0.1287 |
| 9181 | ARHGEF2 | P26T-E | Human | Esophagus | ESCC | 4.21e-04 | 1.04e-01 | 0.1276 |
| 9181 | ARHGEF2 | P27T-E | Human | Esophagus | ESCC | 3.21e-06 | 2.12e-01 | 0.1055 |
| Page: 1 2 3 4 |
| Tissue | Expression Dynamics | Abbreviation |
| Esophagus |  | ESCC: Esophageal squamous cell carcinoma |
| HGIN: High-grade intraepithelial neoplasias | ||
| LGIN: Low-grade intraepithelial neoplasias | ||
| Liver | 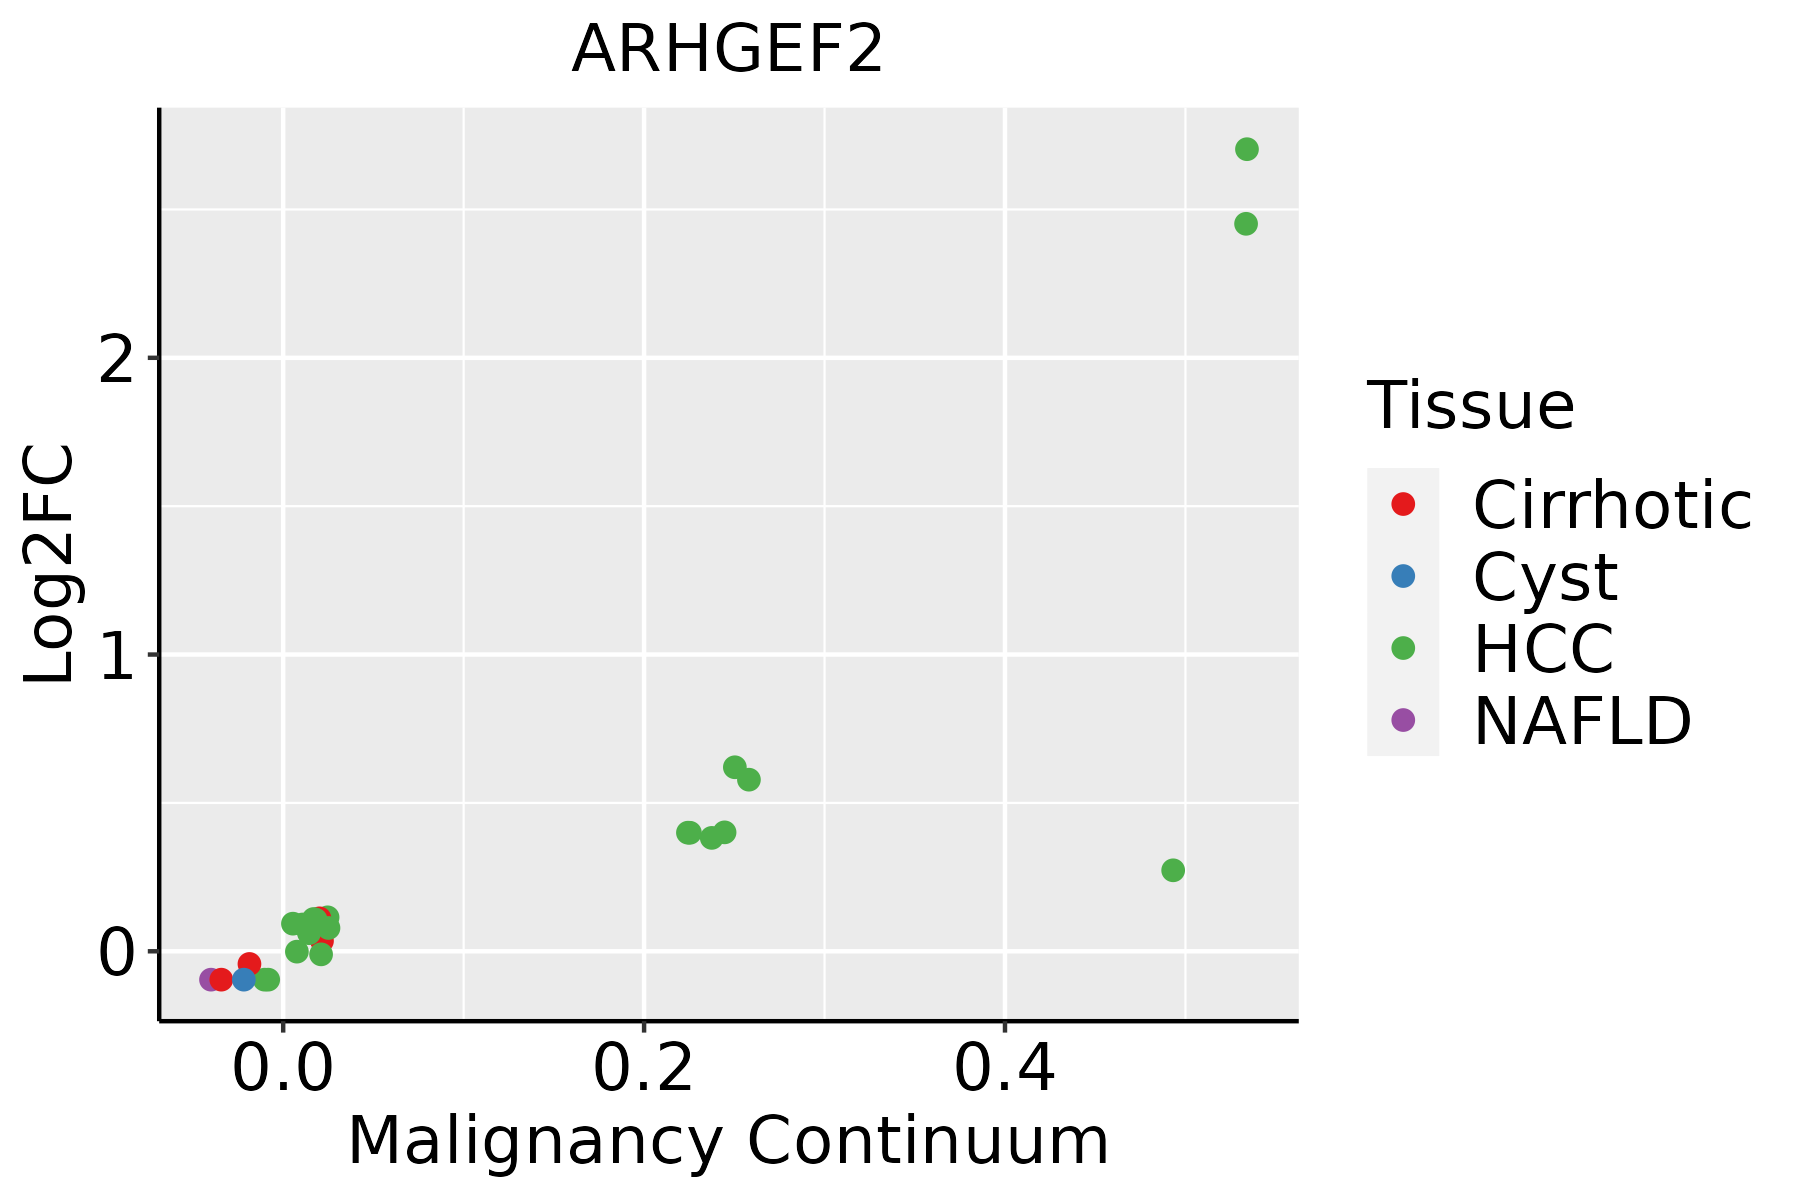 | HCC: Hepatocellular carcinoma |
| NAFLD: Non-alcoholic fatty liver disease | ||
| Thyroid |  | ATC: Anaplastic thyroid cancer |
| HT: Hashimoto's thyroiditis | ||
| PTC: Papillary thyroid cancer |
| ∗log2FC in expression of this searched gene in stem-like cells from each diseased tissue sample relative to stem-like cells in normal samples in each tissue plotted against the malignancy continuum. Samples are colored based on if they are from different disease stage. |
Top |
Malignant transformation related pathway analysis |
| Find out the enriched GO biological processes and KEGG pathways involved in transition from healthy to precancer to cancer |
| Tissue | Disease Stage | Enriched GO biological Processes |
| Colorectum | AD |  |
| Colorectum | SER |  |
| Colorectum | MSS |  |
| Colorectum | MSI-H |  |
| Colorectum | FAP |  |
| ∗Top 15 enriched GO BP terms are showed in the bar plot of each disease state in each tissue. Each row represents a significant GO biological process which is colored according to the -log10(p.adjust). |
| Page: 1 2 3 4 5 6 7 8 9 |
| GO ID | Tissue | Disease Stage | Description | Gene Ratio | Bg Ratio | pvalue | p.adjust | Count |
| GO:009719335 | Thyroid | ATC | intrinsic apoptotic signaling pathway | 171/6293 | 288/18723 | 1.86e-19 | 2.67e-17 | 171 |
| GO:1902903210 | Thyroid | ATC | regulation of supramolecular fiber organization | 210/6293 | 383/18723 | 6.20e-18 | 7.54e-16 | 210 |
| GO:006219734 | Thyroid | ATC | cellular response to chemical stress | 188/6293 | 337/18723 | 3.16e-17 | 3.07e-15 | 188 |
| GO:0007015210 | Thyroid | ATC | actin filament organization | 227/6293 | 442/18723 | 5.96e-15 | 3.85e-13 | 227 |
| GO:200124233 | Thyroid | ATC | regulation of intrinsic apoptotic signaling pathway | 103/6293 | 164/18723 | 1.67e-14 | 9.77e-13 | 103 |
| GO:2001234210 | Thyroid | ATC | negative regulation of apoptotic signaling pathway | 129/6293 | 224/18723 | 1.26e-13 | 6.46e-12 | 129 |
| GO:0097191210 | Thyroid | ATC | extrinsic apoptotic signaling pathway | 125/6293 | 219/18723 | 7.19e-13 | 3.16e-11 | 125 |
| GO:001063926 | Thyroid | ATC | negative regulation of organelle organization | 179/6293 | 348/18723 | 3.74e-12 | 1.50e-10 | 179 |
| GO:000726524 | Thyroid | ATC | Ras protein signal transduction | 172/6293 | 337/18723 | 2.25e-11 | 7.96e-10 | 172 |
| GO:007121427 | Thyroid | ATC | cellular response to abiotic stimulus | 169/6293 | 331/18723 | 3.24e-11 | 1.08e-09 | 169 |
| GO:010400427 | Thyroid | ATC | cellular response to environmental stimulus | 169/6293 | 331/18723 | 3.24e-11 | 1.08e-09 | 169 |
| GO:2001236210 | Thyroid | ATC | regulation of extrinsic apoptotic signaling pathway | 89/6293 | 151/18723 | 1.43e-10 | 4.40e-09 | 89 |
| GO:003298422 | Thyroid | ATC | protein-containing complex disassembly | 121/6293 | 224/18723 | 2.25e-10 | 6.59e-09 | 121 |
| GO:200124333 | Thyroid | ATC | negative regulation of intrinsic apoptotic signaling pathway | 63/6293 | 98/18723 | 4.97e-10 | 1.33e-08 | 63 |
| GO:007050723 | Thyroid | ATC | regulation of microtubule cytoskeleton organization | 85/6293 | 148/18723 | 2.17e-09 | 5.21e-08 | 85 |
| GO:190165325 | Thyroid | ATC | cellular response to peptide | 173/6293 | 359/18723 | 5.87e-09 | 1.28e-07 | 173 |
| GO:0008625111 | Thyroid | ATC | extrinsic apoptotic signaling pathway via death domain receptors | 50/6293 | 82/18723 | 3.47e-07 | 5.13e-06 | 50 |
| GO:005105618 | Thyroid | ATC | regulation of small GTPase mediated signal transduction | 141/6293 | 302/18723 | 1.43e-06 | 1.77e-05 | 141 |
| GO:000726619 | Thyroid | ATC | Rho protein signal transduction | 73/6293 | 137/18723 | 1.58e-06 | 1.93e-05 | 73 |
| GO:004657818 | Thyroid | ATC | regulation of Ras protein signal transduction | 94/6293 | 189/18723 | 3.12e-06 | 3.55e-05 | 94 |
| Page: 1 2 3 4 5 6 7 8 9 10 11 12 13 |
| Pathway ID | Tissue | Disease Stage | Description | Gene Ratio | Bg Ratio | pvalue | p.adjust | qvalue | Count |
| hsa05418211 | Esophagus | ESCC | Fluid shear stress and atherosclerosis | 109/4205 | 139/8465 | 2.00e-12 | 3.72e-11 | 1.90e-11 | 109 |
| hsa05131211 | Esophagus | ESCC | Shigellosis | 176/4205 | 247/8465 | 2.27e-12 | 4.01e-11 | 2.05e-11 | 176 |
| hsa05130211 | Esophagus | ESCC | Pathogenic Escherichia coli infection | 142/4205 | 197/8465 | 8.21e-11 | 1.06e-09 | 5.42e-10 | 142 |
| hsa04530211 | Esophagus | ESCC | Tight junction | 105/4205 | 169/8465 | 6.73e-04 | 2.23e-03 | 1.14e-03 | 105 |
| hsa05418310 | Esophagus | ESCC | Fluid shear stress and atherosclerosis | 109/4205 | 139/8465 | 2.00e-12 | 3.72e-11 | 1.90e-11 | 109 |
| hsa05131310 | Esophagus | ESCC | Shigellosis | 176/4205 | 247/8465 | 2.27e-12 | 4.01e-11 | 2.05e-11 | 176 |
| hsa05130310 | Esophagus | ESCC | Pathogenic Escherichia coli infection | 142/4205 | 197/8465 | 8.21e-11 | 1.06e-09 | 5.42e-10 | 142 |
| hsa04530310 | Esophagus | ESCC | Tight junction | 105/4205 | 169/8465 | 6.73e-04 | 2.23e-03 | 1.14e-03 | 105 |
| hsa0513042 | Liver | HCC | Pathogenic Escherichia coli infection | 129/4020 | 197/8465 | 2.02e-07 | 2.50e-06 | 1.39e-06 | 129 |
| hsa0453042 | Liver | HCC | Tight junction | 110/4020 | 169/8465 | 2.45e-06 | 2.28e-05 | 1.27e-05 | 110 |
| hsa0513142 | Liver | HCC | Shigellosis | 150/4020 | 247/8465 | 1.53e-05 | 1.04e-04 | 5.81e-05 | 150 |
| hsa0541842 | Liver | HCC | Fluid shear stress and atherosclerosis | 89/4020 | 139/8465 | 5.58e-05 | 2.88e-04 | 1.60e-04 | 89 |
| hsa0513052 | Liver | HCC | Pathogenic Escherichia coli infection | 129/4020 | 197/8465 | 2.02e-07 | 2.50e-06 | 1.39e-06 | 129 |
| hsa0453052 | Liver | HCC | Tight junction | 110/4020 | 169/8465 | 2.45e-06 | 2.28e-05 | 1.27e-05 | 110 |
| hsa0513152 | Liver | HCC | Shigellosis | 150/4020 | 247/8465 | 1.53e-05 | 1.04e-04 | 5.81e-05 | 150 |
| hsa0541852 | Liver | HCC | Fluid shear stress and atherosclerosis | 89/4020 | 139/8465 | 5.58e-05 | 2.88e-04 | 1.60e-04 | 89 |
| Page: 1 |
Top |
Cell-cell communication analysis |
| Identification of potential cell-cell interactions between two cell types and their ligand-receptor pairs for different disease states |
| Ligand | Receptor | LRpair | Pathway | Tissue | Disease Stage |
| Page: 1 |
Top |
Single-cell gene regulatory network inference analysis |
| Find out the significant the regulons (TFs) and the target genes of each regulon across cell types for different disease states |
| TF | Cell Type | Tissue | Disease Stage | Target Gene | RSS | Regulon Activity |
| ∗The dot plots of a searched regulon are shown for all cell subpopulations in each disease state of each tissue based on the regulon specific score inferred using pySCENIC and by calculating the average expression. |
| Page: 1 |
Top |
Somatic mutation of malignant transformation related genes |
| Annotation of somatic variants for genes involved in malignant transformation |
| Hugo Symbol | Variant Class | Variant Classification | dbSNP RS | HGVSc | HGVSp | HGVSp Short | SWISSPROT | BIOTYPE | SIFT | PolyPhen | Tumor Sample Barcode | Tissue | Histology | Sex | Age | Stage | Therapy Types | Drugs | Outcome |
| ARHGEF2 | SNV | Missense_Mutation | rs749849556 | c.1979G>A | p.Arg660His | p.R660H | Q92974 | protein_coding | deleterious(0.03) | possibly_damaging(0.641) | TCGA-A1-A0SK-01 | Breast | breast invasive carcinoma | Female | <65 | I/II | Unknown | Unknown | PD |
| ARHGEF2 | SNV | Missense_Mutation | c.2314N>A | p.Glu772Lys | p.E772K | Q92974 | protein_coding | tolerated(0.06) | benign(0.204) | TCGA-A2-A0SX-01 | Breast | breast invasive carcinoma | Female | <65 | I/II | Chemotherapy | adriamycin | PD | |
| ARHGEF2 | SNV | Missense_Mutation | rs768385602 | c.1948N>T | p.Arg650Cys | p.R650C | Q92974 | protein_coding | deleterious(0) | probably_damaging(0.971) | TCGA-A2-A0YD-01 | Breast | breast invasive carcinoma | Female | <65 | I/II | Chemotherapy | cytoxan | SD |
| ARHGEF2 | SNV | Missense_Mutation | c.1366N>T | p.Pro456Ser | p.P456S | Q92974 | protein_coding | tolerated(0.34) | benign(0.201) | TCGA-AN-A0AK-01 | Breast | breast invasive carcinoma | Female | >=65 | I/II | Unknown | Unknown | SD | |
| ARHGEF2 | SNV | Missense_Mutation | rs760566971 | c.2665N>A | p.Ala889Thr | p.A889T | Q92974 | protein_coding | tolerated_low_confidence(0.09) | benign(0.413) | TCGA-AO-A128-01 | Breast | breast invasive carcinoma | Female | <65 | I/II | Chemotherapy | doxorubicin | SD |
| ARHGEF2 | SNV | Missense_Mutation | c.2162N>G | p.Ser721Cys | p.S721C | Q92974 | protein_coding | deleterious(0.02) | possibly_damaging(0.788) | TCGA-B6-A1KF-01 | Breast | breast invasive carcinoma | Female | >=65 | I/II | Unknown | Unknown | SD | |
| ARHGEF2 | SNV | Missense_Mutation | rs781587819 | c.1234N>T | p.Arg412Cys | p.R412C | Q92974 | protein_coding | tolerated(0.16) | benign(0.436) | TCGA-B6-A402-01 | Breast | breast invasive carcinoma | Female | <65 | I/II | Chemotherapy | cyclophosphamide | PD |
| ARHGEF2 | SNV | Missense_Mutation | novel | c.2786A>G | p.Glu929Gly | p.E929G | Q92974 | protein_coding | deleterious_low_confidence(0) | benign(0.051) | TCGA-BH-A1F5-01 | Breast | breast invasive carcinoma | Female | <65 | I/II | Unknown | Unknown | SD |
| ARHGEF2 | insertion | In_Frame_Ins | novel | c.2080_2081insTGGATACCTTGCTTACTTTGT | p.Asn694delinsMetAspThrLeuLeuThrLeuTyr | p.N694delinsMDTLLTLY | Q92974 | protein_coding | TCGA-AO-A0JD-01 | Breast | breast invasive carcinoma | Female | <65 | III/IV | Chemotherapy | cyclophosphamide | SD | ||
| ARHGEF2 | SNV | Missense_Mutation | c.961N>G | p.Leu321Val | p.L321V | Q92974 | protein_coding | tolerated(0.78) | benign(0.194) | TCGA-DR-A0ZM-01 | Cervix | cervical & endocervical cancer | Female | <65 | III/IV | Unspecific | Cisplatin | SD |
| Page: 1 2 3 4 5 6 7 8 9 10 11 12 |
Top |
Related drugs of malignant transformation related genes |
| Identification of chemicals and drugs interact with genes involved in malignant transfromation |
| (DGIdb 4.0) |
| Entrez ID | Symbol | Category | Interaction Types | Drug Claim Name | Drug Name | PMIDs |
| Page: 1 |

Copyright 2023-Present -The University of Texas Health Science Center at Houston |