
|
|||||
|
 | |
| |
| |
| |
| |
| |
|
Gene: AQP3 |
Gene summary for AQP3 |
| Gene information | Species | Human | Gene symbol | AQP3 | Gene ID | 360 |
| Gene name | aquaporin 3 (Gill blood group) | |
| Gene Alias | AQP-3 | |
| Cytomap | 9p13.3 | |
| Gene Type | protein-coding | GO ID | GO:0001666 | UniProtAcc | Q92482 |
Top |
Malignant transformation analysis |
| Identification of the aberrant gene expression in precancerous and cancerous lesions by comparing the gene expression of stem-like cells in diseased tissues with normal stem cells |
| Entrez ID | Symbol | Replicates | Species | Organ | Tissue | Adj P-value | Log2FC | Malignancy |
| 360 | AQP3 | CA_HPV_1 | Human | Cervix | CC | 2.14e-12 | -4.44e-01 | 0.0264 |
| 360 | AQP3 | CA_HPV_2 | Human | Cervix | CC | 1.82e-02 | 4.20e-01 | 0.0391 |
| 360 | AQP3 | CA_HPV_3 | Human | Cervix | CC | 2.65e-13 | 6.28e-01 | 0.0414 |
| 360 | AQP3 | HSIL_HPV_1 | Human | Cervix | HSIL_HPV | 2.15e-03 | -4.17e-01 | 0.0116 |
| 360 | AQP3 | HSIL_HPV_2 | Human | Cervix | HSIL_HPV | 3.86e-04 | -3.46e-01 | 0.0208 |
| 360 | AQP3 | N_HPV_1 | Human | Cervix | N_HPV | 7.26e-04 | -2.98e-01 | 0.0079 |
| 360 | AQP3 | N_HPV_2 | Human | Cervix | N_HPV | 6.17e-12 | 4.88e-01 | -0.0131 |
| 360 | AQP3 | CCII_1 | Human | Cervix | CC | 2.18e-05 | -5.39e-01 | 0.3249 |
| 360 | AQP3 | Tumor | Human | Cervix | CC | 2.13e-46 | 1.00e+00 | 0.1241 |
| 360 | AQP3 | sample3 | Human | Cervix | CC | 1.28e-51 | 9.61e-01 | 0.1387 |
| 360 | AQP3 | H2 | Human | Cervix | HSIL_HPV | 1.81e-05 | -3.60e-01 | 0.0632 |
| 360 | AQP3 | L1 | Human | Cervix | CC | 3.09e-02 | 1.68e-01 | 0.0802 |
| 360 | AQP3 | T3 | Human | Cervix | CC | 9.28e-45 | 9.59e-01 | 0.1389 |
| 360 | AQP3 | LZE11D | Human | Esophagus | HGIN | 5.21e-03 | -1.42e+00 | -0.005 |
| 360 | AQP3 | LZE2D | Human | Esophagus | HGIN | 3.07e-26 | 4.32e-01 | 0.0642 |
| 360 | AQP3 | LZE2T | Human | Esophagus | ESCC | 2.62e-03 | -1.35e+00 | 0.082 |
| 360 | AQP3 | LZE3D | Human | Esophagus | HGIN | 2.26e-05 | 9.06e-01 | 0.0668 |
| 360 | AQP3 | LZE4T | Human | Esophagus | ESCC | 4.41e-18 | -9.42e-01 | 0.0811 |
| 360 | AQP3 | LZE5T | Human | Esophagus | ESCC | 2.47e-08 | 1.21e+00 | 0.0514 |
| 360 | AQP3 | LZE7T | Human | Esophagus | ESCC | 1.13e-12 | -1.07e+00 | 0.0667 |
| Page: 1 2 3 4 5 6 7 8 |
| Tissue | Expression Dynamics | Abbreviation |
| Cervix | 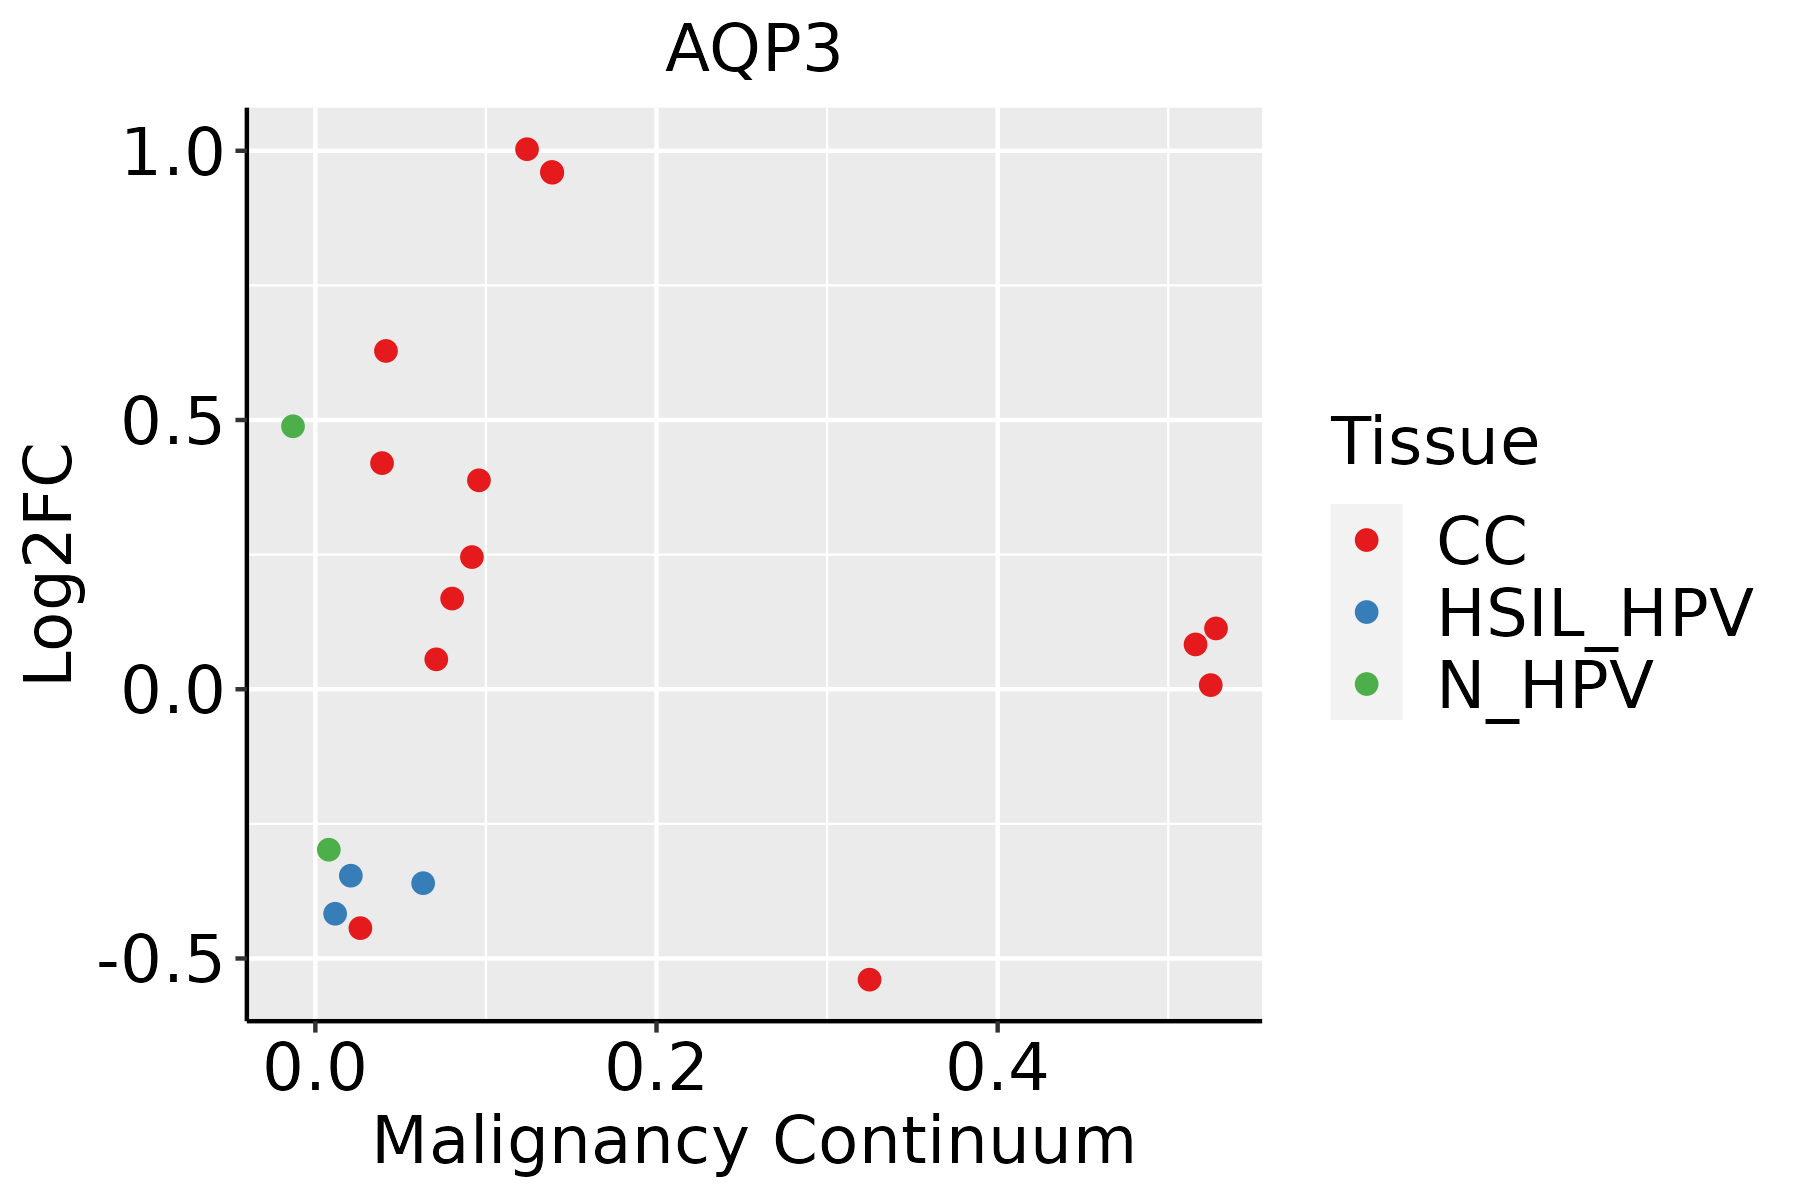 | CC: Cervix cancer |
| HSIL_HPV: HPV-infected high-grade squamous intraepithelial lesions | ||
| N_HPV: HPV-infected normal cervix | ||
| Esophagus |  | ESCC: Esophageal squamous cell carcinoma |
| HGIN: High-grade intraepithelial neoplasias | ||
| LGIN: Low-grade intraepithelial neoplasias | ||
| Liver | 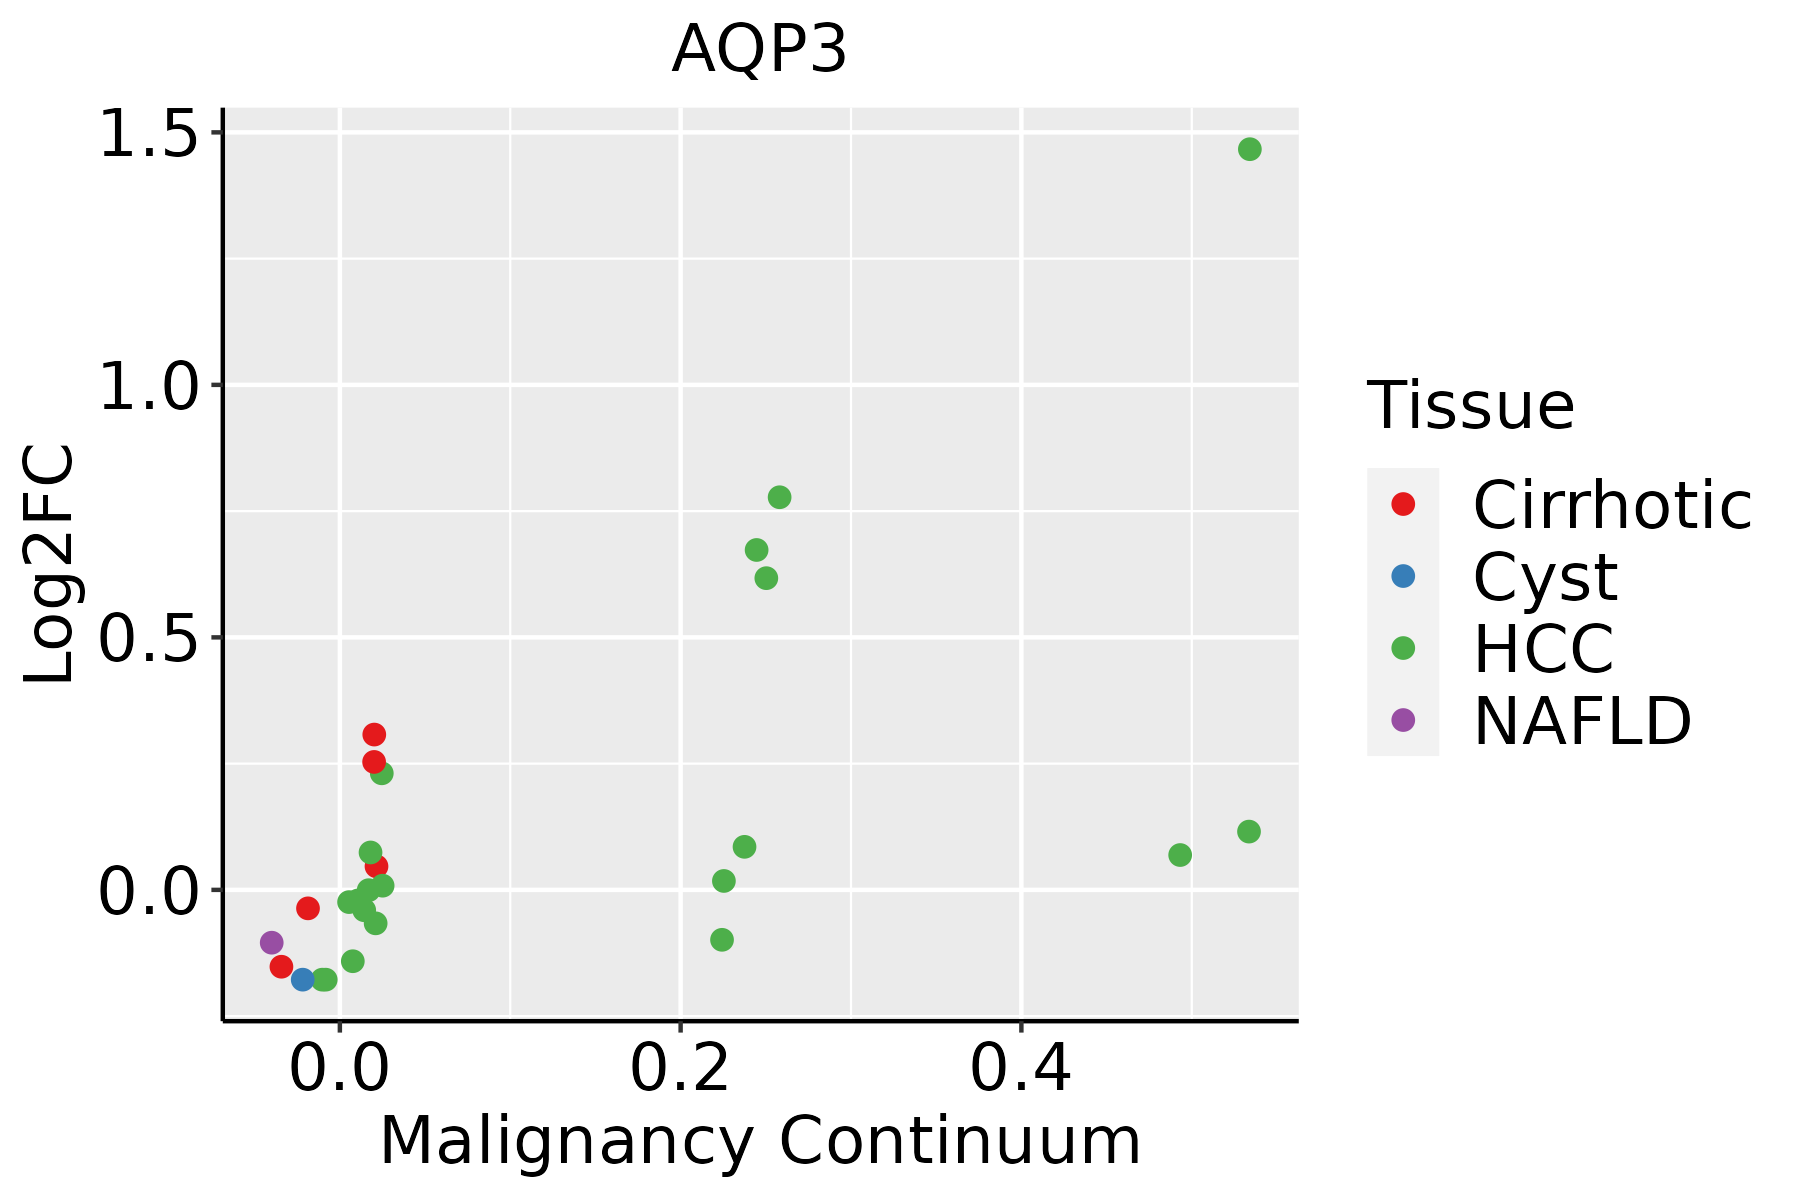 | HCC: Hepatocellular carcinoma |
| NAFLD: Non-alcoholic fatty liver disease | ||
| Lung | 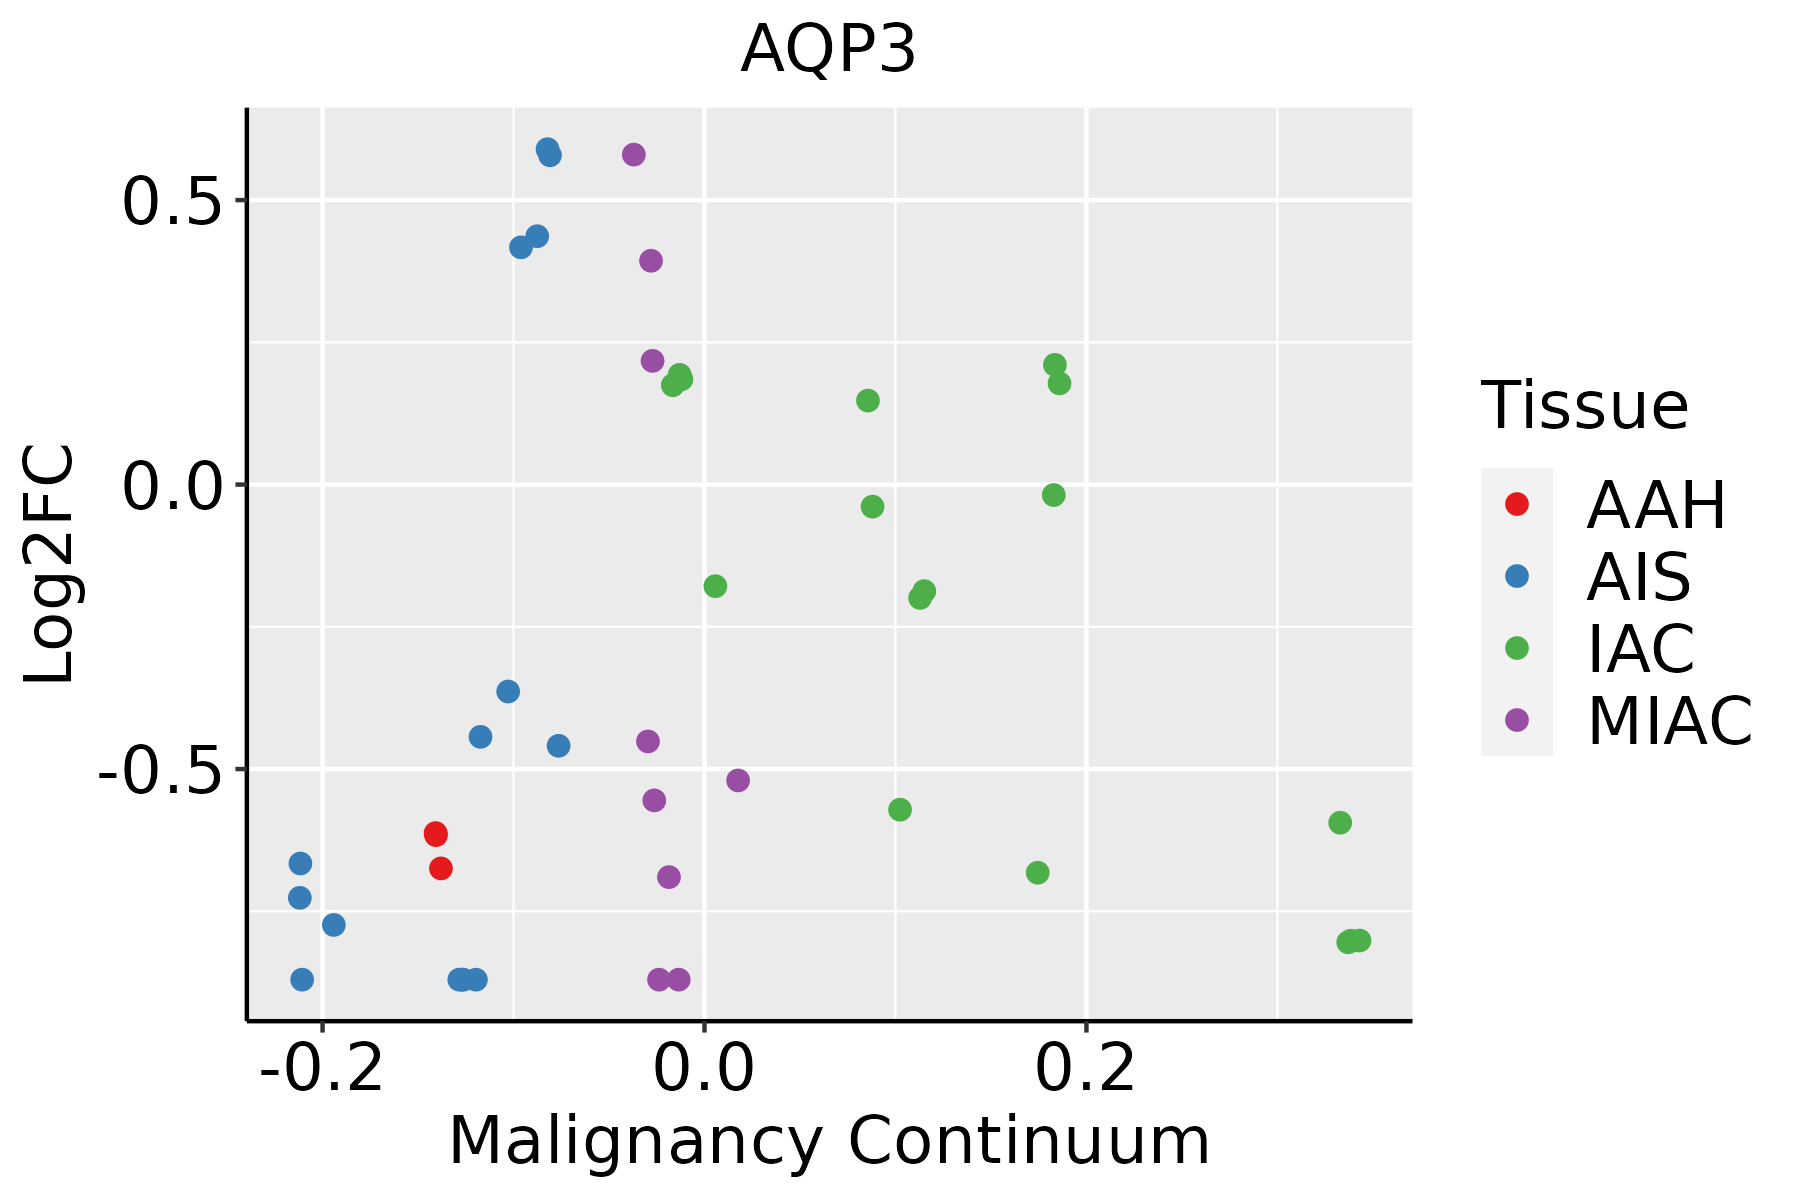 | AAH: Atypical adenomatous hyperplasia |
| AIS: Adenocarcinoma in situ | ||
| IAC: Invasive lung adenocarcinoma | ||
| MIA: Minimally invasive adenocarcinoma | ||
| Oral Cavity |  | EOLP: Erosive Oral lichen planus |
| LP: leukoplakia | ||
| NEOLP: Non-erosive oral lichen planus | ||
| OSCC: Oral squamous cell carcinoma | ||
| Prostate |  | BPH: Benign Prostatic Hyperplasia |
| Skin |  | AK: Actinic keratosis |
| cSCC: Cutaneous squamous cell carcinoma | ||
| SCCIS:squamous cell carcinoma in situ |
| ∗log2FC in expression of this searched gene in stem-like cells from each diseased tissue sample relative to stem-like cells in normal samples in each tissue plotted against the malignancy continuum. Samples are colored based on if they are from different disease stage. |
Top |
Malignant transformation related pathway analysis |
| Find out the enriched GO biological processes and KEGG pathways involved in transition from healthy to precancer to cancer |
| Tissue | Disease Stage | Enriched GO biological Processes |
| Colorectum | AD |  |
| Colorectum | SER |  |
| Colorectum | MSS |  |
| Colorectum | MSI-H |  |
| Colorectum | FAP |  |
| ∗Top 15 enriched GO BP terms are showed in the bar plot of each disease state in each tissue. Each row represents a significant GO biological process which is colored according to the -log10(p.adjust). |
| Page: 1 2 3 4 5 6 7 8 9 |
| GO ID | Tissue | Disease Stage | Description | Gene Ratio | Bg Ratio | pvalue | p.adjust | Count |
| GO:007048232 | Oral cavity | NEOLP | response to oxygen levels | 69/2005 | 347/18723 | 2.66e-07 | 8.54e-06 | 69 |
| GO:000166632 | Oral cavity | NEOLP | response to hypoxia | 63/2005 | 307/18723 | 2.75e-07 | 8.78e-06 | 63 |
| GO:003629332 | Oral cavity | NEOLP | response to decreased oxygen levels | 65/2005 | 322/18723 | 3.34e-07 | 1.04e-05 | 65 |
| GO:005087825 | Oral cavity | NEOLP | regulation of body fluid levels | 70/2005 | 379/18723 | 3.62e-06 | 7.94e-05 | 70 |
| GO:003021631 | Oral cavity | NEOLP | keratinocyte differentiation | 32/2005 | 139/18723 | 2.16e-05 | 3.57e-04 | 32 |
| GO:003166831 | Oral cavity | NEOLP | cellular response to extracellular stimulus | 48/2005 | 246/18723 | 2.80e-05 | 4.32e-04 | 48 |
| GO:001003833 | Oral cavity | NEOLP | response to metal ion | 66/2005 | 373/18723 | 2.83e-05 | 4.34e-04 | 66 |
| GO:00308566 | Oral cavity | NEOLP | regulation of epithelial cell differentiation | 33/2005 | 154/18723 | 7.47e-05 | 9.67e-04 | 33 |
| GO:003629423 | Oral cavity | NEOLP | cellular response to decreased oxygen levels | 34/2005 | 161/18723 | 7.96e-05 | 1.01e-03 | 34 |
| GO:007149632 | Oral cavity | NEOLP | cellular response to external stimulus | 57/2005 | 320/18723 | 8.00e-05 | 1.01e-03 | 57 |
| GO:003166932 | Oral cavity | NEOLP | cellular response to nutrient levels | 42/2005 | 215/18723 | 8.37e-05 | 1.05e-03 | 42 |
| GO:007145323 | Oral cavity | NEOLP | cellular response to oxygen levels | 36/2005 | 177/18723 | 1.13e-04 | 1.35e-03 | 36 |
| GO:000854431 | Oral cavity | NEOLP | epidermis development | 57/2005 | 324/18723 | 1.13e-04 | 1.35e-03 | 57 |
| GO:007145623 | Oral cavity | NEOLP | cellular response to hypoxia | 32/2005 | 151/18723 | 1.19e-04 | 1.41e-03 | 32 |
| GO:003166732 | Oral cavity | NEOLP | response to nutrient levels | 77/2005 | 474/18723 | 1.27e-04 | 1.49e-03 | 77 |
| GO:004358831 | Oral cavity | NEOLP | skin development | 48/2005 | 263/18723 | 1.56e-04 | 1.77e-03 | 48 |
| GO:000991331 | Oral cavity | NEOLP | epidermal cell differentiation | 38/2005 | 202/18723 | 3.92e-04 | 3.64e-03 | 38 |
| GO:000758423 | Oral cavity | NEOLP | response to nutrient | 33/2005 | 174/18723 | 7.89e-04 | 6.27e-03 | 33 |
| GO:004568214 | Oral cavity | NEOLP | regulation of epidermis development | 14/2005 | 65/18723 | 7.97e-03 | 3.95e-02 | 14 |
| GO:007149618 | Prostate | BPH | cellular response to external stimulus | 102/3107 | 320/18723 | 8.99e-12 | 6.79e-10 | 102 |
| Page: 1 2 3 4 5 6 7 8 9 10 11 12 13 14 15 16 |
| Pathway ID | Tissue | Disease Stage | Description | Gene Ratio | Bg Ratio | pvalue | p.adjust | qvalue | Count |
| hsa049624 | Liver | HCC | Vasopressin-regulated water reabsorption | 30/4020 | 44/8465 | 4.41e-03 | 1.32e-02 | 7.34e-03 | 30 |
| hsa0496211 | Liver | HCC | Vasopressin-regulated water reabsorption | 30/4020 | 44/8465 | 4.41e-03 | 1.32e-02 | 7.34e-03 | 30 |
| hsa049625 | Prostate | BPH | Vasopressin-regulated water reabsorption | 17/1718 | 44/8465 | 3.88e-03 | 1.39e-02 | 8.61e-03 | 17 |
| hsa0496212 | Prostate | BPH | Vasopressin-regulated water reabsorption | 17/1718 | 44/8465 | 3.88e-03 | 1.39e-02 | 8.61e-03 | 17 |
| Page: 1 |
Top |
Cell-cell communication analysis |
| Identification of potential cell-cell interactions between two cell types and their ligand-receptor pairs for different disease states |
| Ligand | Receptor | LRpair | Pathway | Tissue | Disease Stage |
| Page: 1 |
Top |
Single-cell gene regulatory network inference analysis |
| Find out the significant the regulons (TFs) and the target genes of each regulon across cell types for different disease states |
| TF | Cell Type | Tissue | Disease Stage | Target Gene | RSS | Regulon Activity |
| ∗The dot plots of a searched regulon are shown for all cell subpopulations in each disease state of each tissue based on the regulon specific score inferred using pySCENIC and by calculating the average expression. |
| Page: 1 |
Top |
Somatic mutation of malignant transformation related genes |
| Annotation of somatic variants for genes involved in malignant transformation |
| Hugo Symbol | Variant Class | Variant Classification | dbSNP RS | HGVSc | HGVSp | HGVSp Short | SWISSPROT | BIOTYPE | SIFT | PolyPhen | Tumor Sample Barcode | Tissue | Histology | Sex | Age | Stage | Therapy Types | Drugs | Outcome |
| AQP3 | SNV | Missense_Mutation | novel | c.632G>A | p.Gly211Asp | p.G211D | Q92482 | protein_coding | deleterious(0.01) | benign(0.347) | TCGA-A2-A04Q-01 | Breast | breast invasive carcinoma | Female | <65 | I/II | Chemotherapy | adriamycin | SD |
| AQP3 | SNV | Missense_Mutation | c.404N>G | p.Leu135Arg | p.L135R | Q92482 | protein_coding | deleterious(0) | possibly_damaging(0.887) | TCGA-A6-6649-01 | Colorectum | colon adenocarcinoma | Male | >=65 | III/IV | Chemotherapy | fluorouracil | SD | |
| AQP3 | SNV | Missense_Mutation | c.483N>A | p.Phe161Leu | p.F161L | Q92482 | protein_coding | deleterious(0.05) | probably_damaging(0.998) | TCGA-AA-3977-01 | Colorectum | colon adenocarcinoma | Male | >=65 | I/II | Unknown | Unknown | SD | |
| AQP3 | SNV | Missense_Mutation | rs756008789 | c.583G>A | p.Val195Met | p.V195M | Q92482 | protein_coding | deleterious(0.01) | probably_damaging(0.969) | TCGA-AZ-4313-01 | Colorectum | colon adenocarcinoma | Female | <65 | I/II | Unknown | Unknown | SD |
| AQP3 | SNV | Missense_Mutation | rs760141667 | c.556G>A | p.Val186Ile | p.V186I | Q92482 | protein_coding | tolerated(0.47) | benign(0.01) | TCGA-CK-6747-01 | Colorectum | colon adenocarcinoma | Female | >=65 | I/II | Unknown | Unknown | SD |
| AQP3 | SNV | Missense_Mutation | rs762587298 | c.767N>T | p.Ala256Val | p.A256V | Q92482 | protein_coding | tolerated(0.78) | benign(0.003) | TCGA-AJ-A3BH-01 | Endometrium | uterine corpus endometrioid carcinoma | Female | Unknown | I/II | Unknown | Unknown | SD |
| AQP3 | SNV | Missense_Mutation | novel | c.418N>A | p.Pro140Thr | p.P140T | Q92482 | protein_coding | deleterious(0.04) | benign(0.044) | TCGA-AX-A1CE-01 | Endometrium | uterine corpus endometrioid carcinoma | Female | <65 | I/II | Unspecific | Paclitaxel | SD |
| AQP3 | SNV | Missense_Mutation | c.754N>A | p.Leu252Met | p.L252M | Q92482 | protein_coding | deleterious(0.05) | probably_damaging(0.967) | TCGA-D1-A17D-01 | Endometrium | uterine corpus endometrioid carcinoma | Female | <65 | I/II | Chemotherapy | carboplatin | SD | |
| AQP3 | SNV | Missense_Mutation | novel | c.290N>T | p.Pro97Leu | p.P97L | Q92482 | protein_coding | deleterious(0.01) | possibly_damaging(0.87) | TCGA-EC-A24G-01 | Endometrium | uterine corpus endometrioid carcinoma | Female | <65 | I/II | Chemotherapy | doxorubicin | SD |
| AQP3 | SNV | Missense_Mutation | rs749786864 | c.413C>T | p.Ser138Leu | p.S138L | Q92482 | protein_coding | deleterious(0.04) | benign(0.011) | TCGA-EO-A22R-01 | Endometrium | uterine corpus endometrioid carcinoma | Female | <65 | I/II | Unknown | Unknown | SD |
| Page: 1 2 3 |
Top |
Related drugs of malignant transformation related genes |
| Identification of chemicals and drugs interact with genes involved in malignant transfromation |
| (DGIdb 4.0) |
| Entrez ID | Symbol | Category | Interaction Types | Drug Claim Name | Drug Name | PMIDs |
| 360 | AQP3 | ION CHANNEL, TRANSPORTER | inhibitor | 381118898 | AUPHEN | |
| 360 | AQP3 | ION CHANNEL, TRANSPORTER | inhibitor | 178101032 | ||
| 360 | AQP3 | ION CHANNEL, TRANSPORTER | inhibitor | 381118899 |
| Page: 1 |

Copyright 2023-Present -The University of Texas Health Science Center at Houston |