
|
|||||
|
 | |
| |
| |
| |
| |
| |
|
Gene: ANXA3 |
Gene summary for ANXA3 |
| Gene information | Species | Human | Gene symbol | ANXA3 | Gene ID | 306 |
| Gene name | annexin A3 | |
| Gene Alias | ANX3 | |
| Cytomap | 4q21.21 | |
| Gene Type | protein-coding | GO ID | GO:0001525 | UniProtAcc | P12429 |
Top |
Malignant transformation analysis |
| Identification of the aberrant gene expression in precancerous and cancerous lesions by comparing the gene expression of stem-like cells in diseased tissues with normal stem cells |
| Entrez ID | Symbol | Replicates | Species | Organ | Tissue | Adj P-value | Log2FC | Malignancy |
| 306 | ANXA3 | GSM4909285 | Human | Breast | IDC | 1.79e-02 | -3.44e-01 | 0.21 |
| 306 | ANXA3 | GSM4909286 | Human | Breast | IDC | 9.36e-17 | -4.53e-01 | 0.1081 |
| 306 | ANXA3 | GSM4909287 | Human | Breast | IDC | 6.43e-06 | -3.52e-01 | 0.2057 |
| 306 | ANXA3 | GSM4909288 | Human | Breast | IDC | 3.08e-04 | 7.80e-02 | 0.0988 |
| 306 | ANXA3 | GSM4909290 | Human | Breast | IDC | 1.11e-02 | -3.22e-01 | 0.2096 |
| 306 | ANXA3 | GSM4909293 | Human | Breast | IDC | 2.29e-09 | -4.08e-01 | 0.1581 |
| 306 | ANXA3 | GSM4909296 | Human | Breast | IDC | 1.27e-12 | -4.01e-01 | 0.1524 |
| 306 | ANXA3 | GSM4909297 | Human | Breast | IDC | 7.56e-12 | -4.19e-01 | 0.1517 |
| 306 | ANXA3 | GSM4909298 | Human | Breast | IDC | 3.16e-08 | -4.03e-01 | 0.1551 |
| 306 | ANXA3 | GSM4909301 | Human | Breast | IDC | 2.19e-14 | -4.44e-01 | 0.1577 |
| 306 | ANXA3 | GSM4909302 | Human | Breast | IDC | 2.90e-06 | -3.67e-01 | 0.1545 |
| 306 | ANXA3 | GSM4909304 | Human | Breast | IDC | 2.93e-16 | -4.54e-01 | 0.1636 |
| 306 | ANXA3 | GSM4909306 | Human | Breast | IDC | 1.37e-03 | -3.42e-01 | 0.1564 |
| 306 | ANXA3 | GSM4909307 | Human | Breast | IDC | 8.84e-08 | -4.17e-01 | 0.1569 |
| 306 | ANXA3 | GSM4909308 | Human | Breast | IDC | 1.61e-13 | -4.46e-01 | 0.158 |
| 306 | ANXA3 | GSM4909311 | Human | Breast | IDC | 1.02e-13 | -4.22e-01 | 0.1534 |
| 306 | ANXA3 | GSM4909312 | Human | Breast | IDC | 2.01e-14 | -4.42e-01 | 0.1552 |
| 306 | ANXA3 | GSM4909319 | Human | Breast | IDC | 3.47e-18 | -4.56e-01 | 0.1563 |
| 306 | ANXA3 | GSM4909320 | Human | Breast | IDC | 4.03e-06 | -4.56e-01 | 0.1575 |
| 306 | ANXA3 | GSM4909321 | Human | Breast | IDC | 1.13e-12 | -4.36e-01 | 0.1559 |
| Page: 1 2 3 4 5 |
| Tissue | Expression Dynamics | Abbreviation |
| Breast | 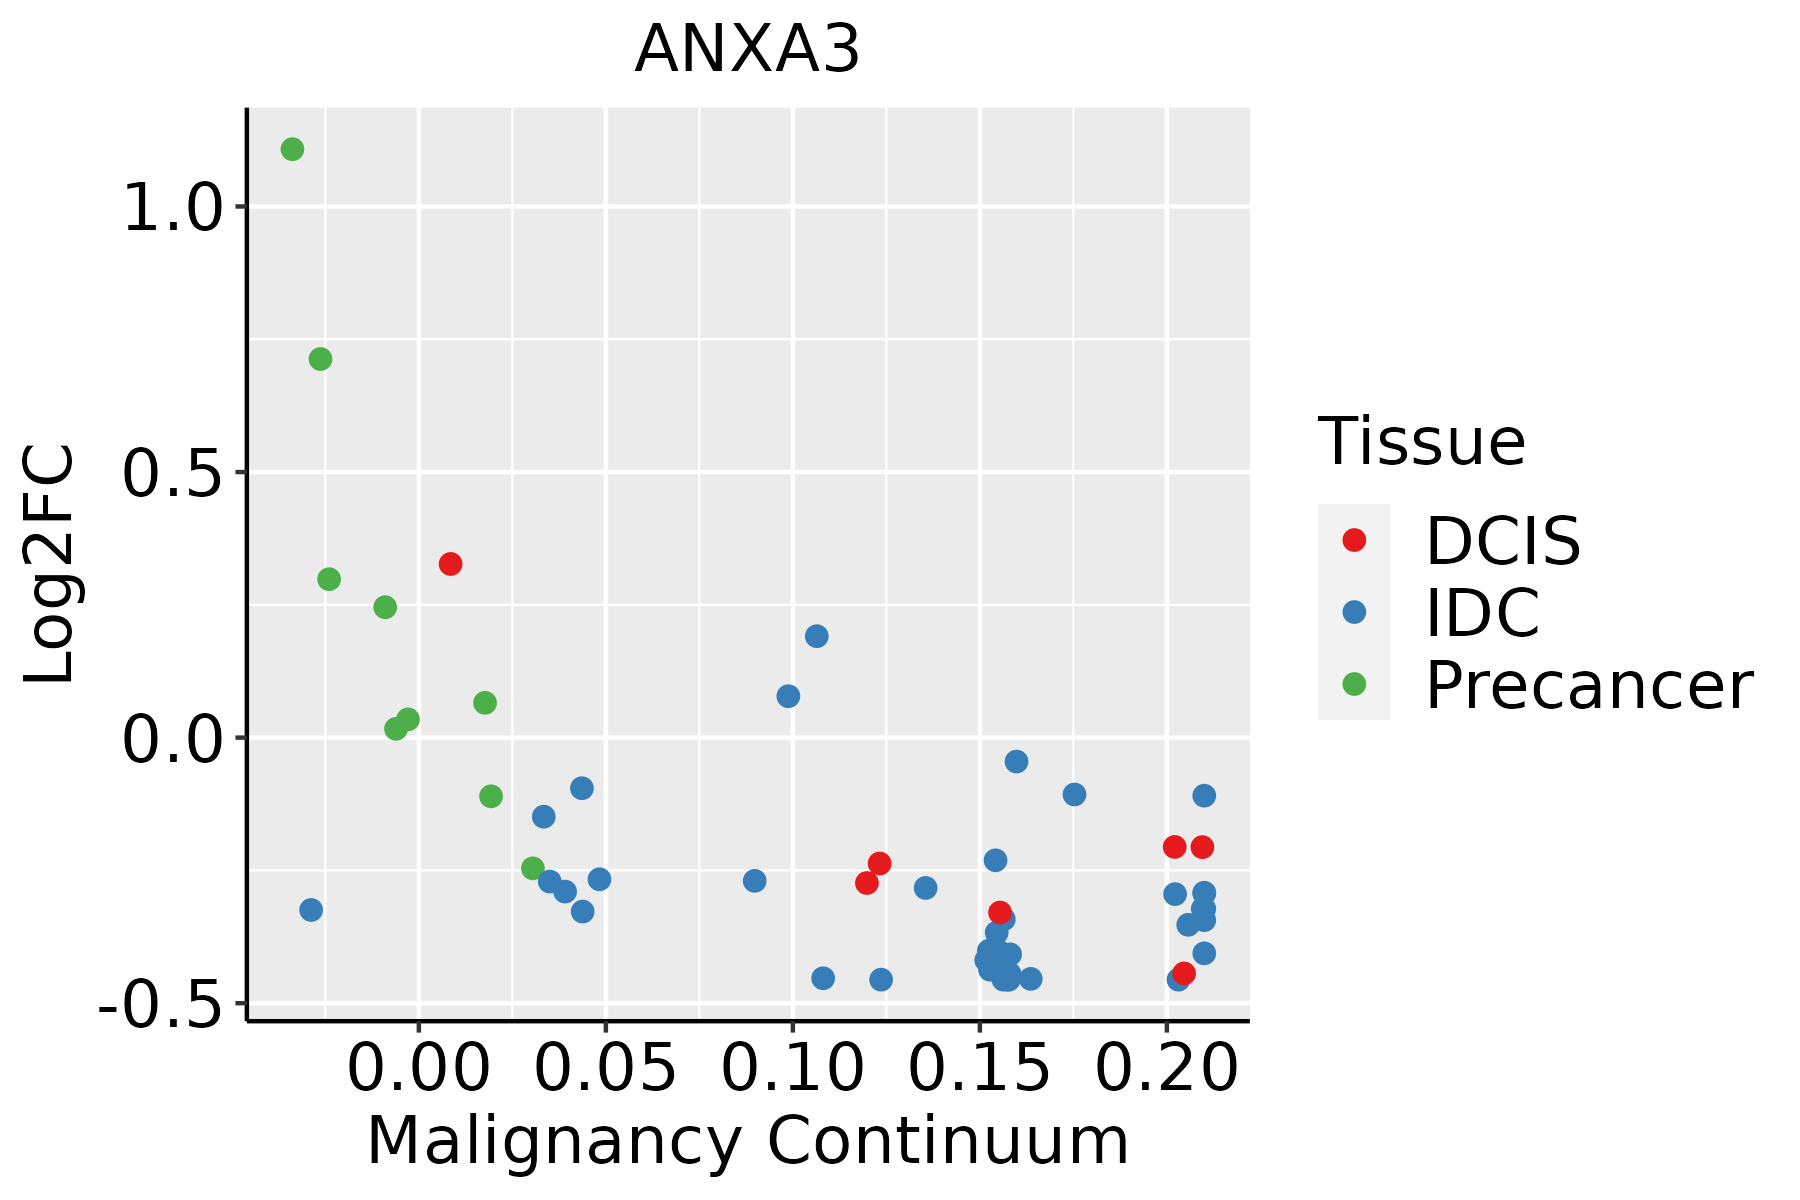 | IDC: Invasive ductal carcinoma |
| DCIS: Ductal carcinoma in situ | ||
| Precancer(BRCA1-mut): Precancerous lesion from BRCA1 mutation carriers | ||
| Esophagus | 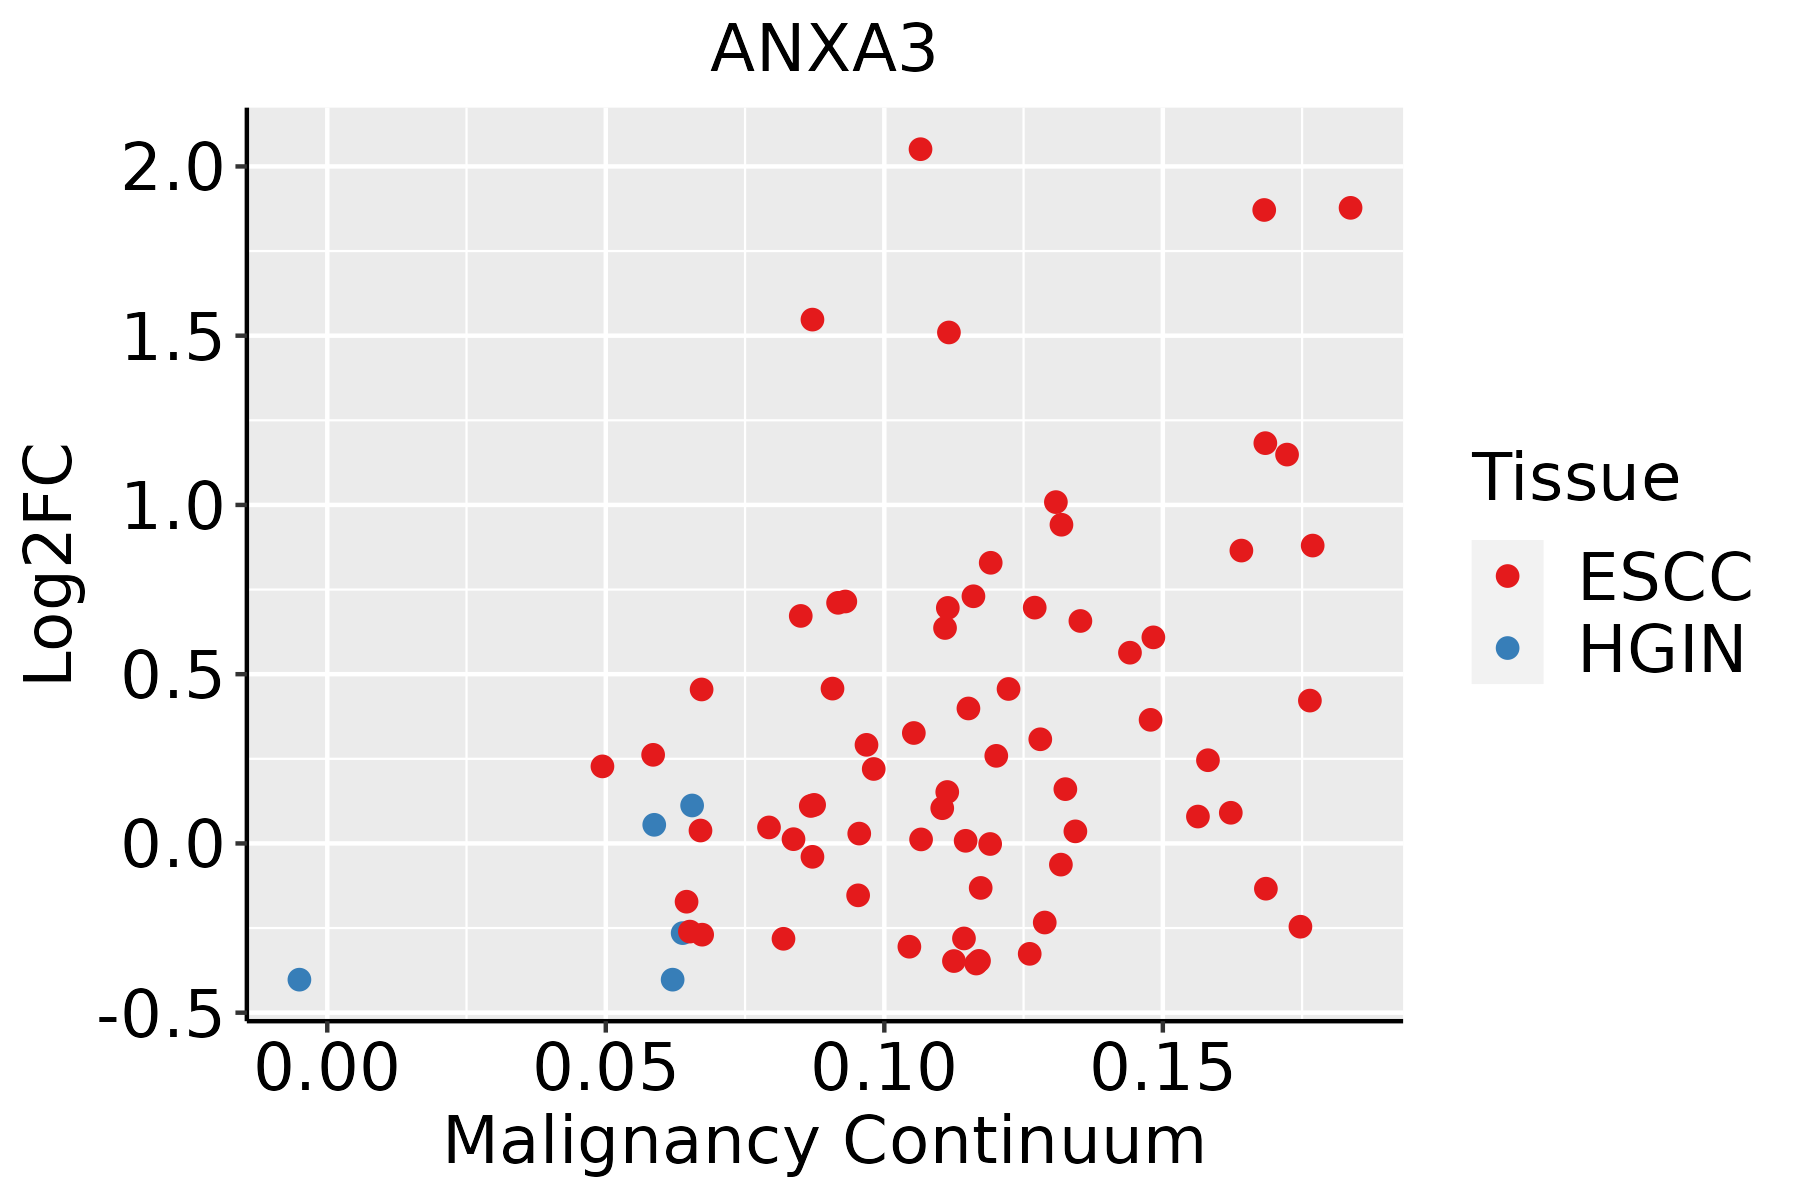 | ESCC: Esophageal squamous cell carcinoma |
| HGIN: High-grade intraepithelial neoplasias | ||
| LGIN: Low-grade intraepithelial neoplasias | ||
| Oral Cavity | 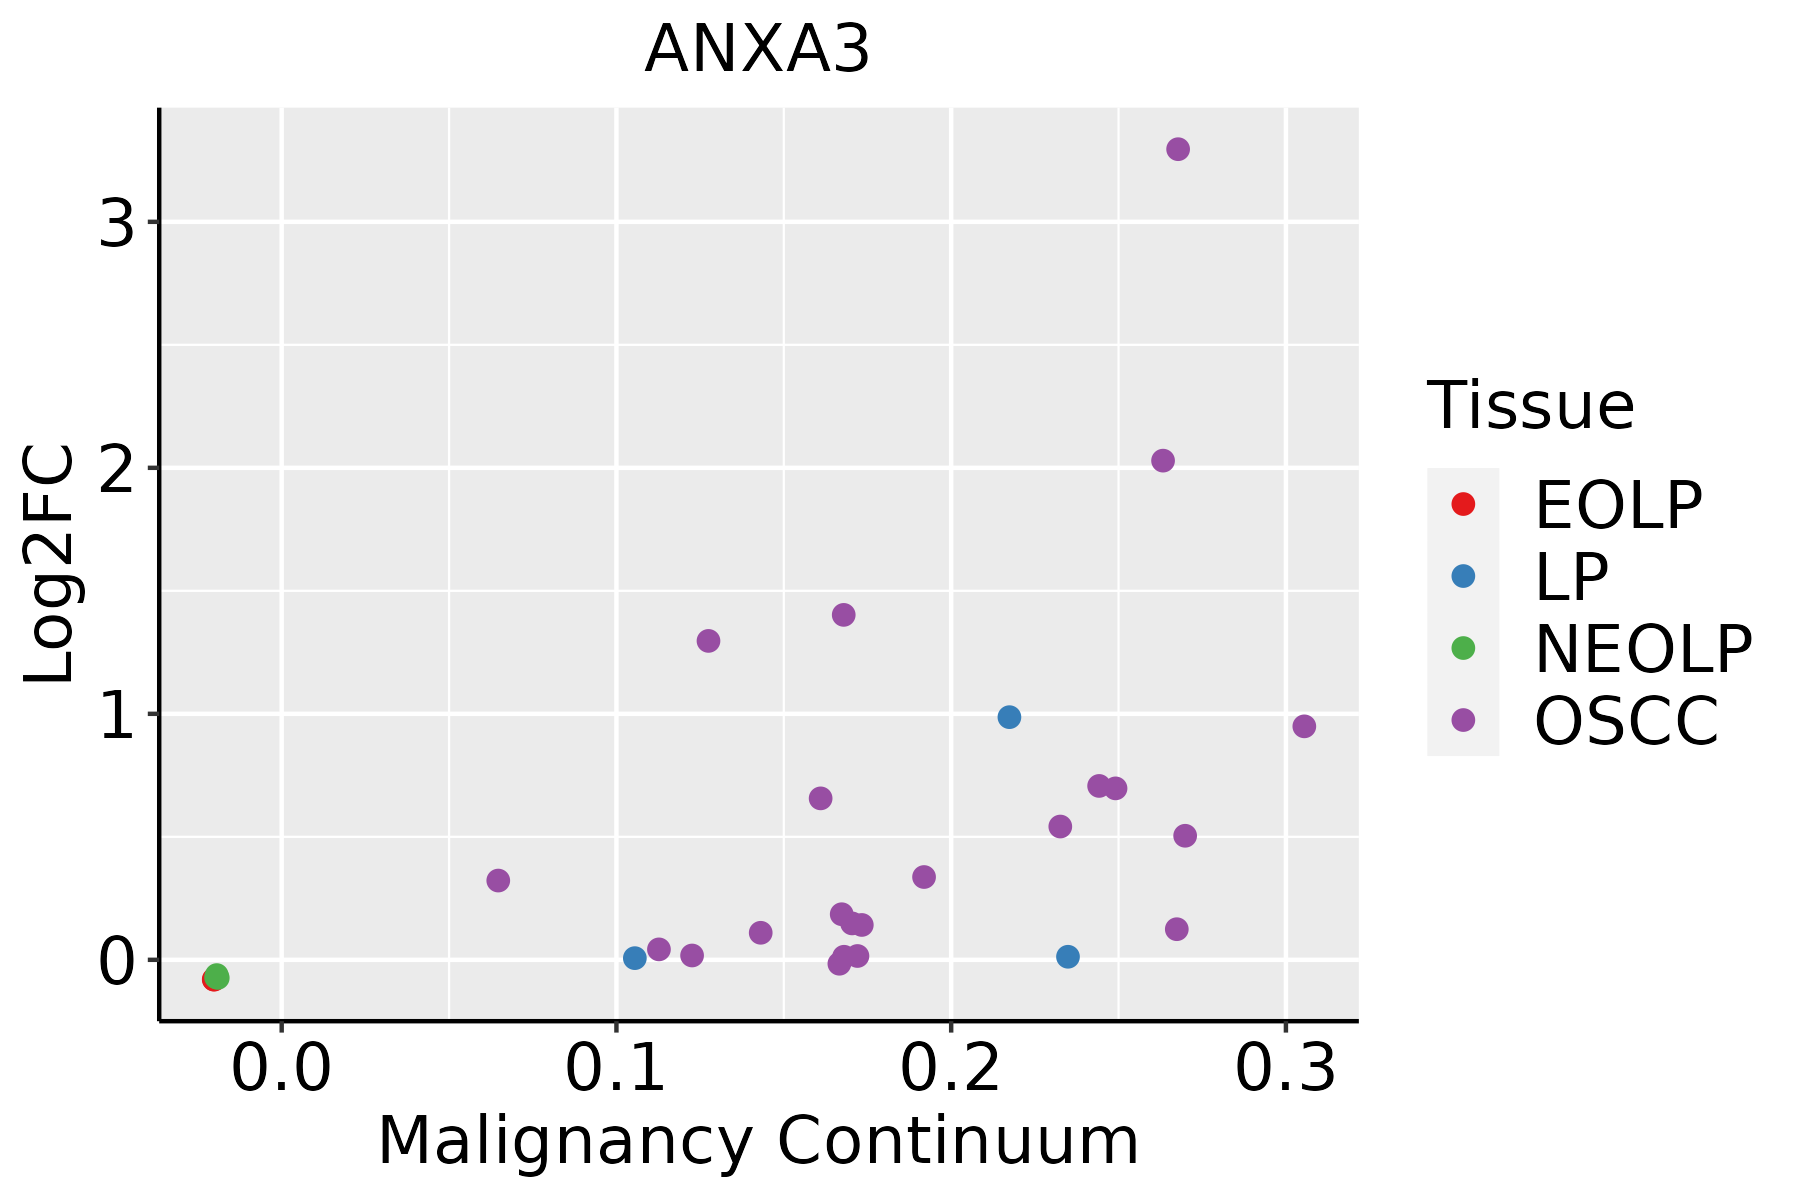 | EOLP: Erosive Oral lichen planus |
| LP: leukoplakia | ||
| NEOLP: Non-erosive oral lichen planus | ||
| OSCC: Oral squamous cell carcinoma | ||
| Prostate | 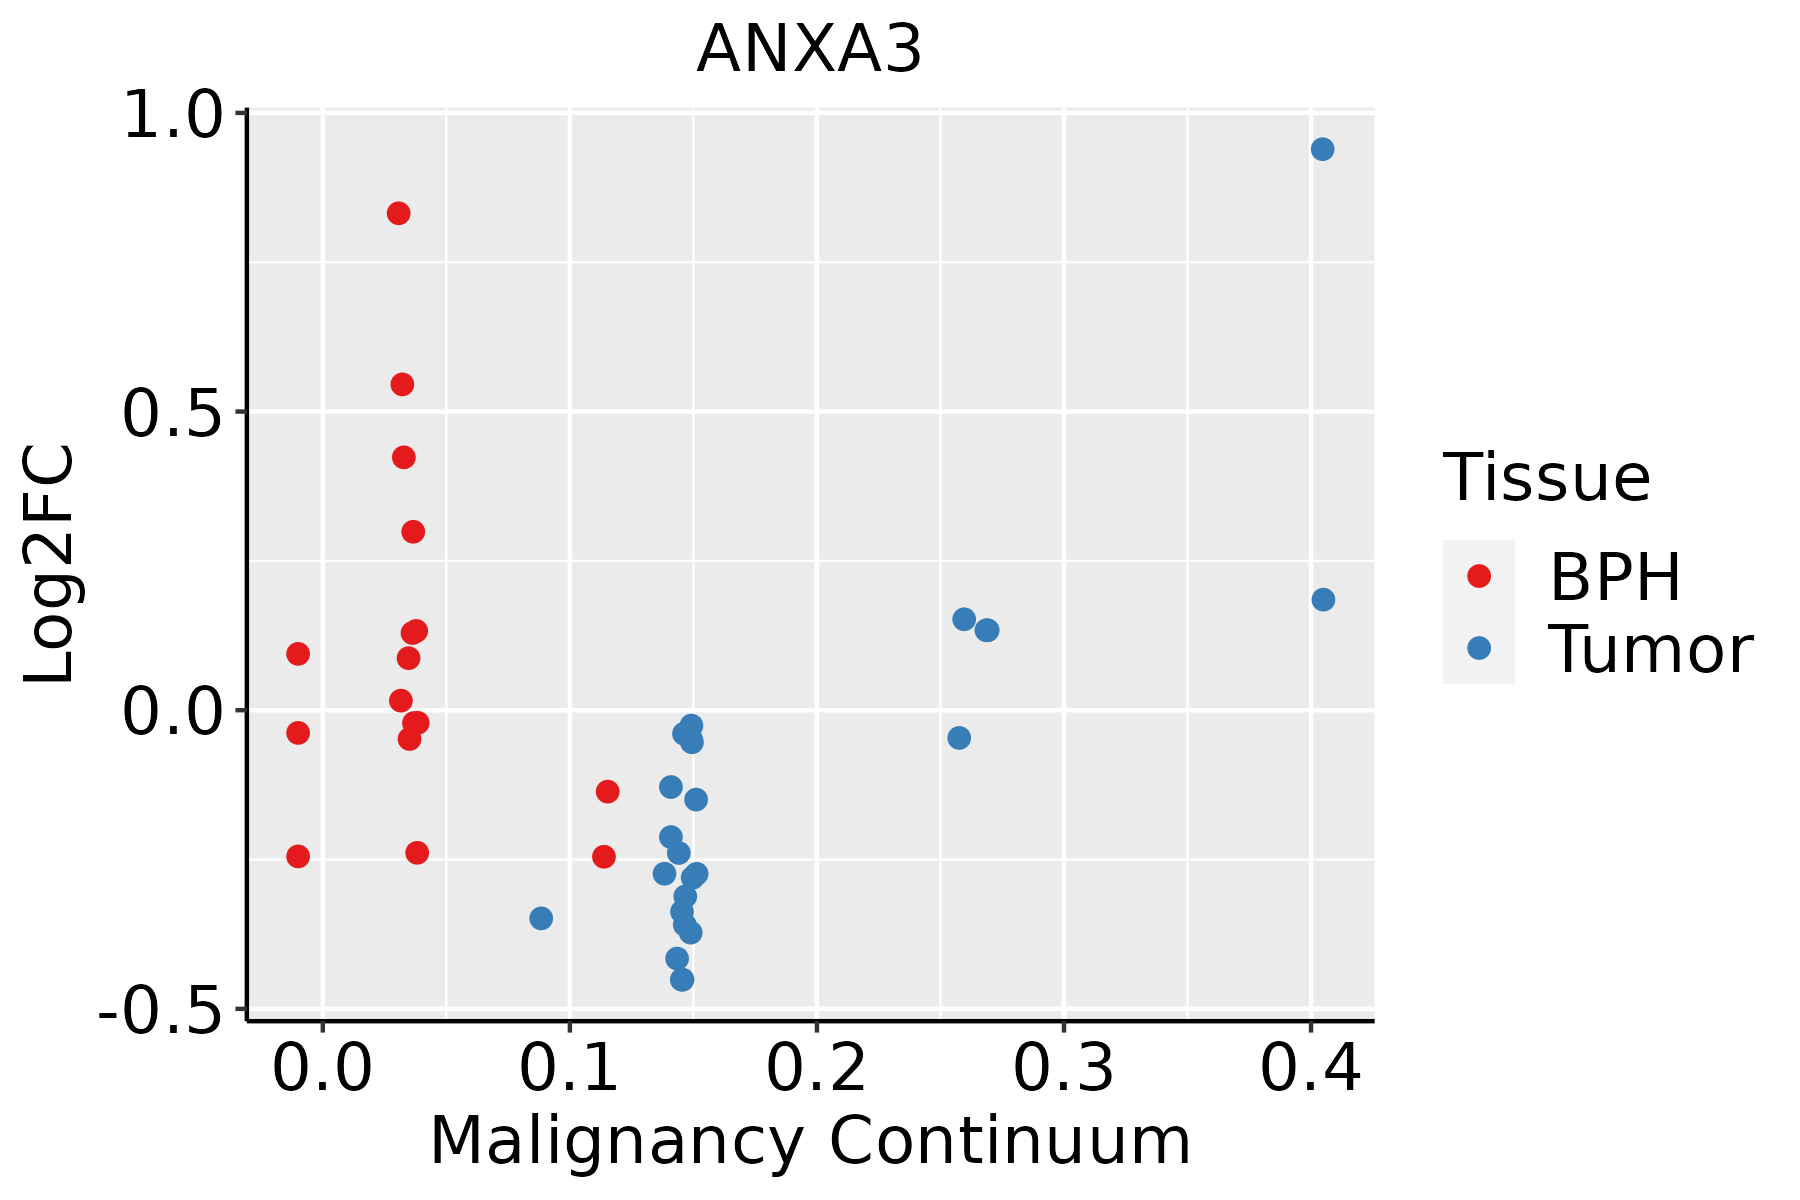 | BPH: Benign Prostatic Hyperplasia |
| Skin | 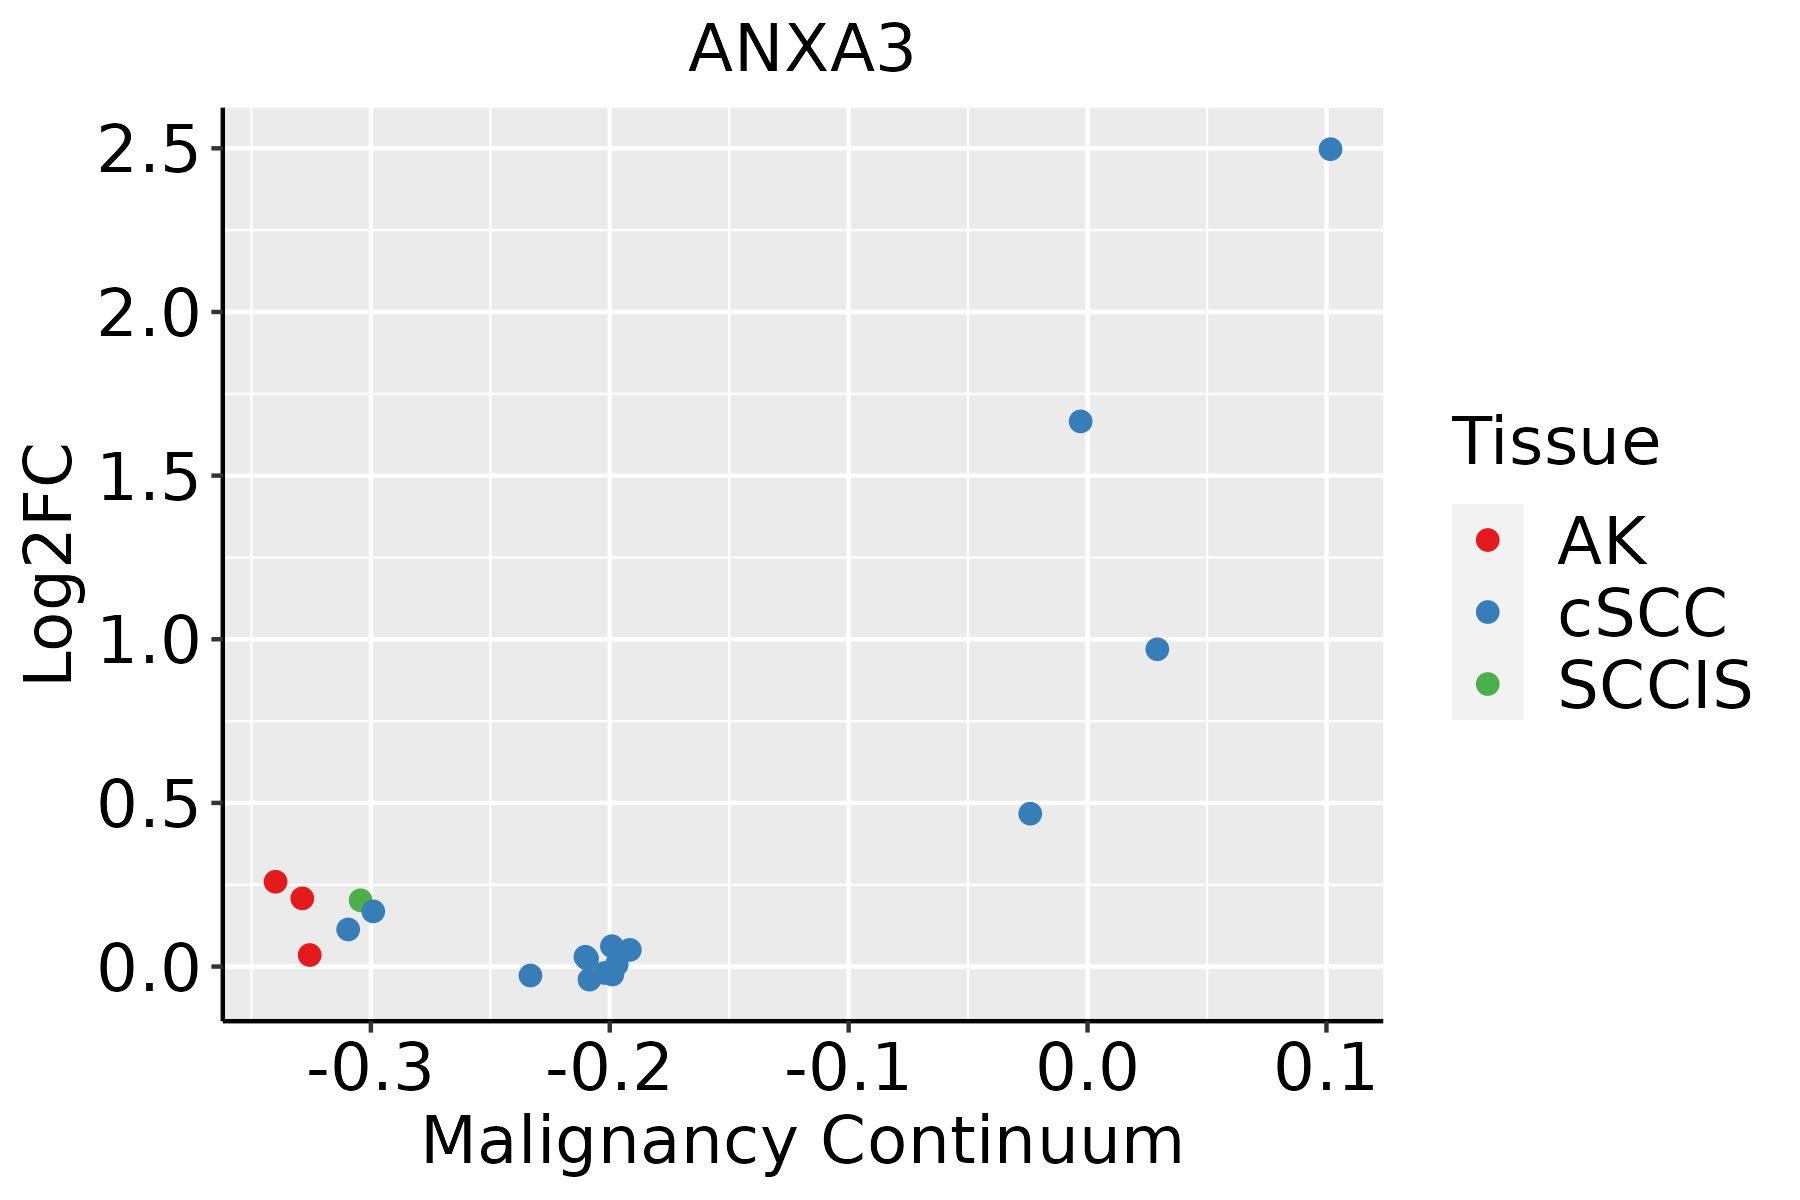 | AK: Actinic keratosis |
| cSCC: Cutaneous squamous cell carcinoma | ||
| SCCIS:squamous cell carcinoma in situ | ||
| Thyroid | 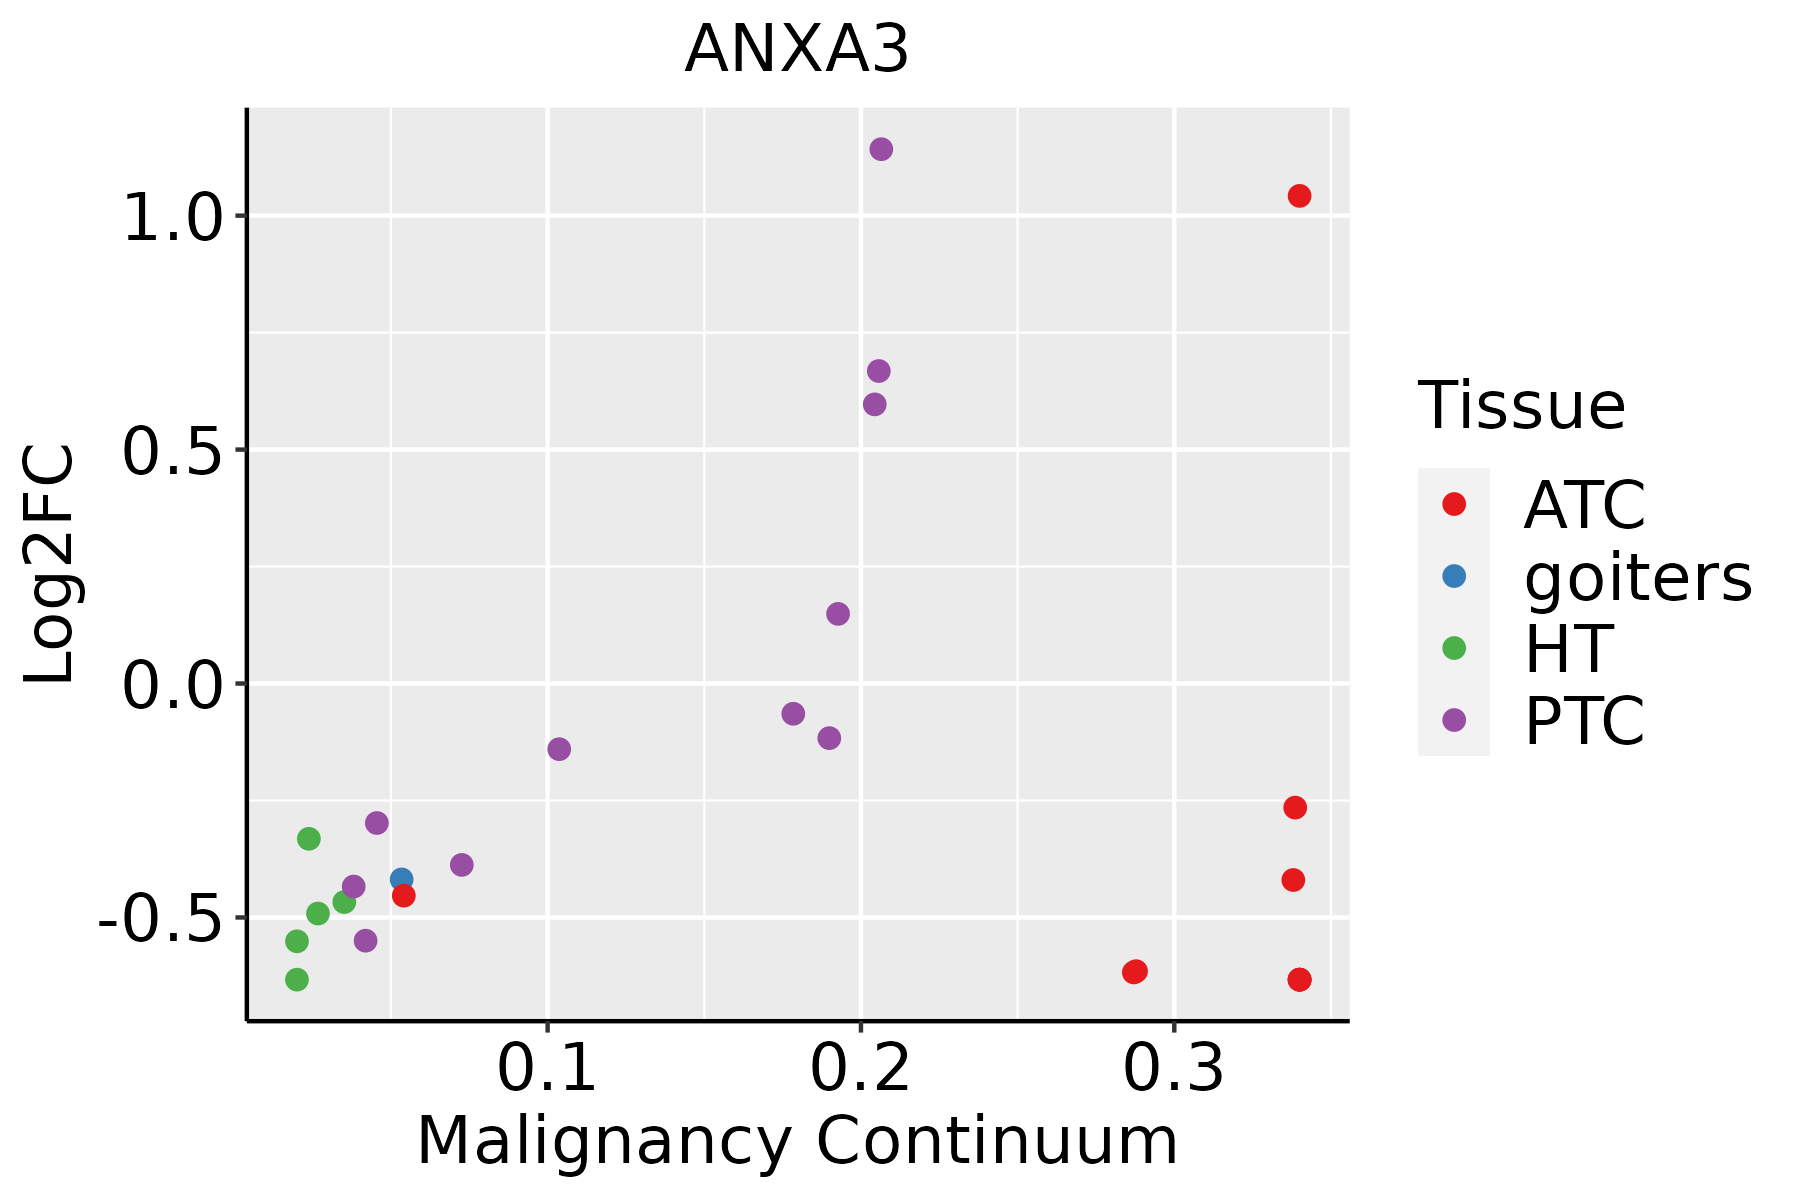 | ATC: Anaplastic thyroid cancer |
| HT: Hashimoto's thyroiditis | ||
| PTC: Papillary thyroid cancer |
| ∗log2FC in expression of this searched gene in stem-like cells from each diseased tissue sample relative to stem-like cells in normal samples in each tissue plotted against the malignancy continuum. Samples are colored based on if they are from different disease stage. |
Top |
Malignant transformation related pathway analysis |
| Find out the enriched GO biological processes and KEGG pathways involved in transition from healthy to precancer to cancer |
| Tissue | Disease Stage | Enriched GO biological Processes |
| Colorectum | AD |  |
| Colorectum | SER |  |
| Colorectum | MSS |  |
| Colorectum | MSI-H |  |
| Colorectum | FAP |  |
| ∗Top 15 enriched GO BP terms are showed in the bar plot of each disease state in each tissue. Each row represents a significant GO biological process which is colored according to the -log10(p.adjust). |
| Page: 1 2 3 4 5 6 7 8 9 |
| GO ID | Tissue | Disease Stage | Description | Gene Ratio | Bg Ratio | pvalue | p.adjust | Count |
| GO:0031099110 | Thyroid | PTC | regeneration | 82/5968 | 198/18723 | 2.83e-03 | 1.40e-02 | 82 |
| GO:00215373 | Thyroid | PTC | telencephalon development | 100/5968 | 248/18723 | 2.90e-03 | 1.44e-02 | 100 |
| GO:004576612 | Thyroid | PTC | positive regulation of angiogenesis | 75/5968 | 181/18723 | 4.09e-03 | 1.95e-02 | 75 |
| GO:190401812 | Thyroid | PTC | positive regulation of vasculature development | 75/5968 | 181/18723 | 4.09e-03 | 1.95e-02 | 75 |
| GO:0031960111 | Thyroid | PTC | response to corticosteroid | 69/5968 | 167/18723 | 6.18e-03 | 2.74e-02 | 69 |
| GO:0051384111 | Thyroid | PTC | response to glucocorticoid | 62/5968 | 148/18723 | 6.39e-03 | 2.81e-02 | 62 |
| GO:00309007 | Thyroid | PTC | forebrain development | 143/5968 | 379/18723 | 8.47e-03 | 3.56e-02 | 143 |
| GO:001059416 | Thyroid | PTC | regulation of endothelial cell migration | 91/5968 | 232/18723 | 1.03e-02 | 4.18e-02 | 91 |
| GO:001059522 | Thyroid | goiters | positive regulation of endothelial cell migration | 15/497 | 133/18723 | 2.55e-06 | 1.27e-04 | 15 |
| GO:001063426 | Thyroid | goiters | positive regulation of epithelial cell migration | 17/497 | 176/18723 | 4.76e-06 | 2.22e-04 | 17 |
| GO:001059422 | Thyroid | goiters | regulation of endothelial cell migration | 18/497 | 232/18723 | 5.06e-05 | 1.73e-03 | 18 |
| GO:004354223 | Thyroid | goiters | endothelial cell migration | 20/497 | 279/18723 | 6.02e-05 | 2.03e-03 | 20 |
| GO:001063225 | Thyroid | goiters | regulation of epithelial cell migration | 20/497 | 292/18723 | 1.13e-04 | 3.45e-03 | 20 |
| GO:009013027 | Thyroid | goiters | tissue migration | 23/497 | 365/18723 | 1.25e-04 | 3.77e-03 | 23 |
| GO:001063127 | Thyroid | goiters | epithelial cell migration | 22/497 | 357/18723 | 2.38e-04 | 6.62e-03 | 22 |
| GO:009013227 | Thyroid | goiters | epithelium migration | 22/497 | 360/18723 | 2.68e-04 | 7.20e-03 | 22 |
| GO:000166729 | Thyroid | goiters | ameboidal-type cell migration | 25/497 | 475/18723 | 9.67e-04 | 2.01e-02 | 25 |
| GO:003109925 | Thyroid | goiters | regeneration | 13/497 | 198/18723 | 2.50e-03 | 4.04e-02 | 13 |
| GO:005105219 | Thyroid | ATC | regulation of DNA metabolic process | 183/6293 | 359/18723 | 5.97e-12 | 2.30e-10 | 183 |
| GO:000166731 | Thyroid | ATC | ameboidal-type cell migration | 228/6293 | 475/18723 | 3.72e-11 | 1.22e-09 | 228 |
| Page: 1 2 3 4 5 6 7 8 9 10 11 12 13 |
| Pathway ID | Tissue | Disease Stage | Description | Gene Ratio | Bg Ratio | pvalue | p.adjust | qvalue | Count |
| Page: 1 |
Top |
Cell-cell communication analysis |
| Identification of potential cell-cell interactions between two cell types and their ligand-receptor pairs for different disease states |
| Ligand | Receptor | LRpair | Pathway | Tissue | Disease Stage |
| Page: 1 |
Top |
Single-cell gene regulatory network inference analysis |
| Find out the significant the regulons (TFs) and the target genes of each regulon across cell types for different disease states |
| TF | Cell Type | Tissue | Disease Stage | Target Gene | RSS | Regulon Activity |
| ∗The dot plots of a searched regulon are shown for all cell subpopulations in each disease state of each tissue based on the regulon specific score inferred using pySCENIC and by calculating the average expression. |
| Page: 1 |
Top |
Somatic mutation of malignant transformation related genes |
| Annotation of somatic variants for genes involved in malignant transformation |
| Hugo Symbol | Variant Class | Variant Classification | dbSNP RS | HGVSc | HGVSp | HGVSp Short | SWISSPROT | BIOTYPE | SIFT | PolyPhen | Tumor Sample Barcode | Tissue | Histology | Sex | Age | Stage | Therapy Types | Drugs | Outcome |
| ANXA3 | SNV | Missense_Mutation | rs73828045 | c.863G>A | p.Arg288Gln | p.R288Q | P12429 | protein_coding | deleterious(0.02) | benign(0.242) | TCGA-AN-A046-01 | Breast | breast invasive carcinoma | Female | >=65 | I/II | Unknown | Unknown | SD |
| ANXA3 | SNV | Missense_Mutation | rs181568024 | c.157N>T | p.Arg53Trp | p.R53W | P12429 | protein_coding | deleterious(0) | probably_damaging(0.999) | TCGA-AN-A0AK-01 | Breast | breast invasive carcinoma | Female | >=65 | I/II | Unknown | Unknown | SD |
| ANXA3 | SNV | Missense_Mutation | novel | c.505N>G | p.Lys169Glu | p.K169E | P12429 | protein_coding | tolerated(0.87) | benign(0.035) | TCGA-C8-A3M7-01 | Breast | breast invasive carcinoma | Female | <65 | III/IV | Unknown | Unknown | PD |
| ANXA3 | SNV | Missense_Mutation | c.786N>C | p.Leu262Phe | p.L262F | P12429 | protein_coding | deleterious(0) | possibly_damaging(0.85) | TCGA-E2-A10C-01 | Breast | breast invasive carcinoma | Female | <65 | I/II | Chemotherapy | cytoxan | SD | |
| ANXA3 | SNV | Missense_Mutation | novel | c.104N>C | p.Gly35Ala | p.G35A | P12429 | protein_coding | deleterious(0) | probably_damaging(0.999) | TCGA-GM-A3XL-01 | Breast | breast invasive carcinoma | Female | <65 | I/II | Chemotherapy | fluorouracil | CR |
| ANXA3 | SNV | Missense_Mutation | c.112N>A | p.Glu38Lys | p.E38K | P12429 | protein_coding | tolerated(0.11) | probably_damaging(0.992) | TCGA-EK-A2PG-01 | Cervix | cervical & endocervical cancer | Female | >=65 | I/II | Unknown | Unknown | SD | |
| ANXA3 | SNV | Missense_Mutation | c.8N>G | p.Ser3Cys | p.S3C | P12429 | protein_coding | deleterious(0) | benign(0) | TCGA-IR-A3LA-01 | Cervix | cervical & endocervical cancer | Female | <65 | I/II | Chemotherapy | cisplatin | CR | |
| ANXA3 | SNV | Missense_Mutation | c.703N>T | p.His235Tyr | p.H235Y | P12429 | protein_coding | tolerated(0.06) | possibly_damaging(0.58) | TCGA-A6-6653-01 | Colorectum | colon adenocarcinoma | Male | >=65 | I/II | Unknown | Unknown | SD | |
| ANXA3 | SNV | Missense_Mutation | novel | c.253N>A | p.Val85Met | p.V85M | P12429 | protein_coding | deleterious(0.04) | probably_damaging(0.998) | TCGA-AA-3972-01 | Colorectum | colon adenocarcinoma | Male | >=65 | III/IV | Chemotherapy | capecitabine | PD |
| ANXA3 | SNV | Missense_Mutation | novel | c.591N>A | p.Phe197Leu | p.F197L | P12429 | protein_coding | deleterious(0.01) | probably_damaging(0.98) | TCGA-AZ-4315-01 | Colorectum | colon adenocarcinoma | Male | <65 | I/II | Unknown | Unknown | SD |
| Page: 1 2 3 4 |
Top |
Related drugs of malignant transformation related genes |
| Identification of chemicals and drugs interact with genes involved in malignant transfromation |
| (DGIdb 4.0) |
| Entrez ID | Symbol | Category | Interaction Types | Drug Claim Name | Drug Name | PMIDs |
| Page: 1 |

Copyright 2023-Present -The University of Texas Health Science Center at Houston |