| Tissue | Expression Dynamics | Abbreviation |
| Esophagus | 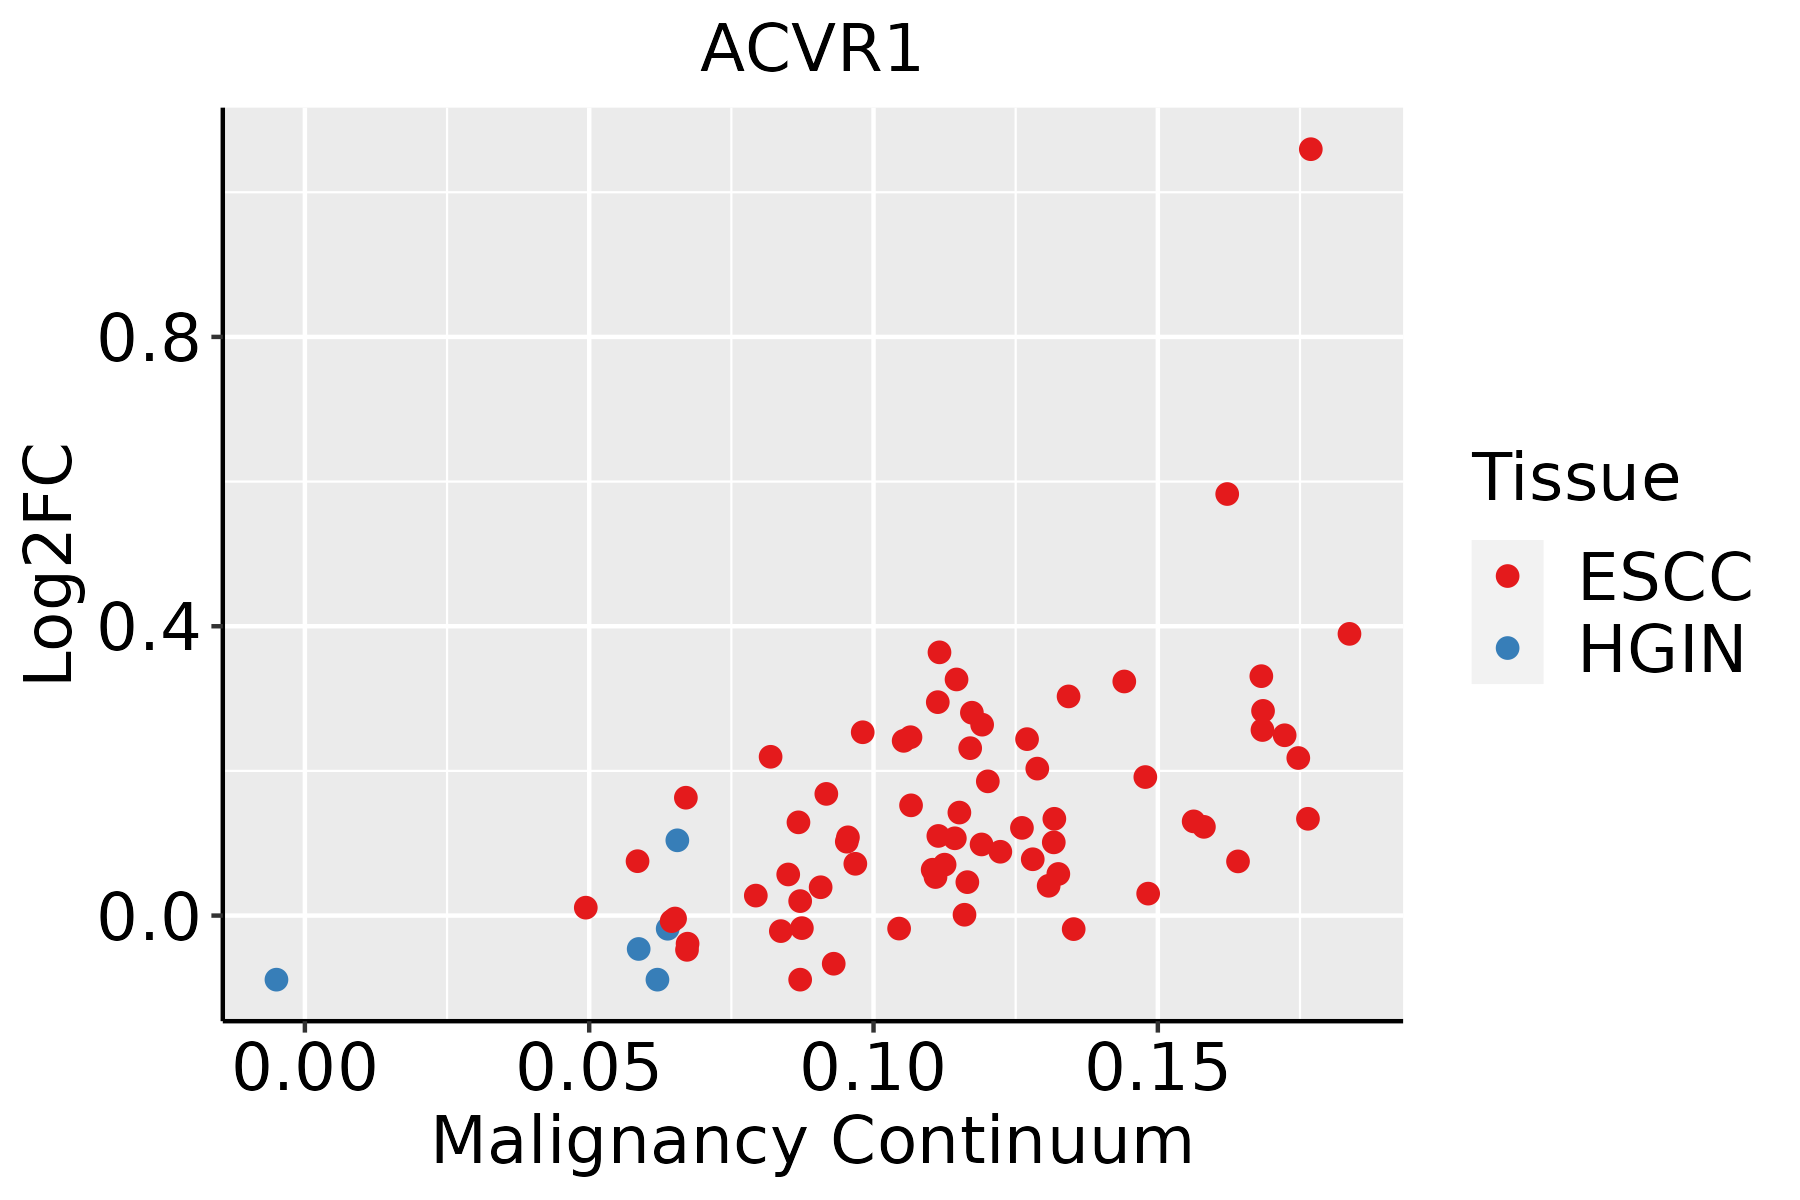 | ESCC: Esophageal squamous cell carcinoma |
| HGIN: High-grade intraepithelial neoplasias |
| LGIN: Low-grade intraepithelial neoplasias |
| Oral Cavity |  | EOLP: Erosive Oral lichen planus |
| LP: leukoplakia |
| NEOLP: Non-erosive oral lichen planus |
| OSCC: Oral squamous cell carcinoma |
| Thyroid | 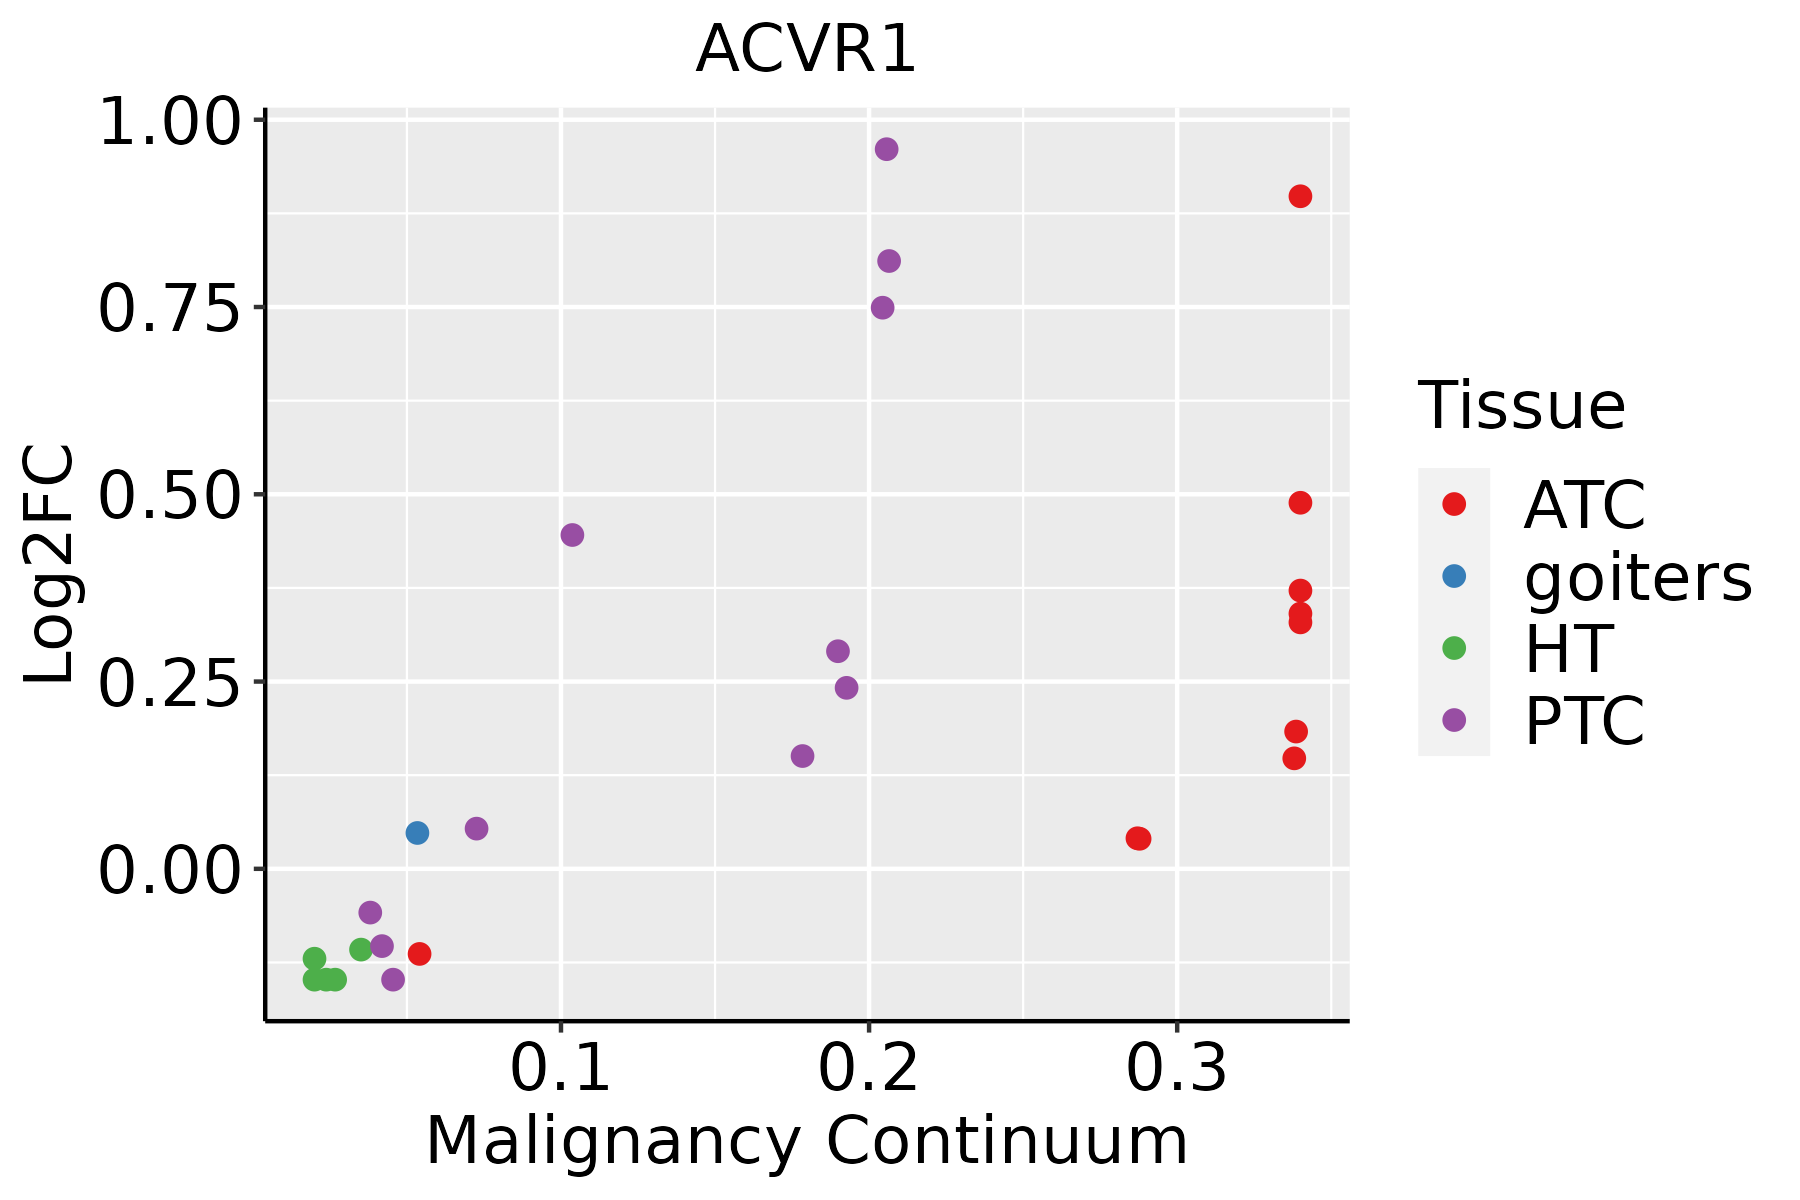 | ATC: Anaplastic thyroid cancer |
| HT: Hashimoto's thyroiditis |
| PTC: Papillary thyroid cancer |
| GO ID | Tissue | Disease Stage | Description | Gene Ratio | Bg Ratio | pvalue | p.adjust | Count |
| GO:001821015 | Oral cavity | EOLP | peptidyl-threonine modification | 35/2218 | 125/18723 | 7.33e-07 | 1.85e-05 | 35 |
| GO:001810715 | Oral cavity | EOLP | peptidyl-threonine phosphorylation | 33/2218 | 116/18723 | 1.02e-06 | 2.51e-05 | 33 |
| GO:004269214 | Oral cavity | EOLP | muscle cell differentiation | 77/2218 | 384/18723 | 2.18e-06 | 4.91e-05 | 77 |
| GO:007155916 | Oral cavity | EOLP | response to transforming growth factor beta | 56/2218 | 256/18723 | 3.54e-06 | 7.58e-05 | 56 |
| GO:007156016 | Oral cavity | EOLP | cellular response to transforming growth factor beta stimulus | 54/2218 | 250/18723 | 7.76e-06 | 1.49e-04 | 54 |
| GO:004477222 | Oral cavity | EOLP | mitotic cell cycle phase transition | 81/2218 | 424/18723 | 8.32e-06 | 1.59e-04 | 81 |
| GO:000170123 | Oral cavity | EOLP | in utero embryonic development | 72/2218 | 367/18723 | 1.02e-05 | 1.83e-04 | 72 |
| GO:006053715 | Oral cavity | EOLP | muscle tissue development | 77/2218 | 403/18723 | 1.37e-05 | 2.31e-04 | 77 |
| GO:00511467 | Oral cavity | EOLP | striated muscle cell differentiation | 57/2218 | 283/18723 | 3.82e-05 | 5.25e-04 | 57 |
| GO:000008221 | Oral cavity | EOLP | G1/S transition of mitotic cell cycle | 46/2218 | 214/18723 | 4.02e-05 | 5.51e-04 | 46 |
| GO:200123724 | Oral cavity | EOLP | negative regulation of extrinsic apoptotic signaling pathway | 26/2218 | 97/18723 | 4.30e-05 | 5.82e-04 | 26 |
| GO:001470614 | Oral cavity | EOLP | striated muscle tissue development | 72/2218 | 384/18723 | 4.87e-05 | 6.43e-04 | 72 |
| GO:000717916 | Oral cavity | EOLP | transforming growth factor beta receptor signaling pathway | 43/2218 | 198/18723 | 5.48e-05 | 7.03e-04 | 43 |
| GO:000736913 | Oral cavity | EOLP | gastrulation | 39/2218 | 185/18723 | 2.29e-04 | 2.25e-03 | 39 |
| GO:004484321 | Oral cavity | EOLP | cell cycle G1/S phase transition | 47/2218 | 241/18723 | 3.79e-04 | 3.41e-03 | 47 |
| GO:000717816 | Oral cavity | EOLP | transmembrane receptor protein serine/threonine kinase signaling pathway | 64/2218 | 355/18723 | 3.85e-04 | 3.46e-03 | 64 |
| GO:00031702 | Oral cavity | EOLP | heart valve development | 18/2218 | 65/18723 | 4.03e-04 | 3.58e-03 | 18 |
| GO:000150322 | Oral cavity | EOLP | ossification | 70/2218 | 408/18723 | 8.89e-04 | 6.81e-03 | 70 |
| GO:00182121 | Oral cavity | EOLP | peptidyl-tyrosine modification | 65/2218 | 378/18723 | 1.25e-03 | 9.02e-03 | 65 |
| GO:00031792 | Oral cavity | EOLP | heart valve morphogenesis | 15/2218 | 55/18723 | 1.42e-03 | 9.62e-03 | 15 |
| Pathway ID | Tissue | Disease Stage | Description | Gene Ratio | Bg Ratio | pvalue | p.adjust | qvalue | Count |
| hsa05418211 | Esophagus | ESCC | Fluid shear stress and atherosclerosis | 109/4205 | 139/8465 | 2.00e-12 | 3.72e-11 | 1.90e-11 | 109 |
| hsa043507 | Esophagus | ESCC | TGF-beta signaling pathway | 69/4205 | 108/8465 | 1.92e-03 | 5.54e-03 | 2.84e-03 | 69 |
| hsa05418310 | Esophagus | ESCC | Fluid shear stress and atherosclerosis | 109/4205 | 139/8465 | 2.00e-12 | 3.72e-11 | 1.90e-11 | 109 |
| hsa0435014 | Esophagus | ESCC | TGF-beta signaling pathway | 69/4205 | 108/8465 | 1.92e-03 | 5.54e-03 | 2.84e-03 | 69 |
| hsa0541830 | Oral cavity | OSCC | Fluid shear stress and atherosclerosis | 92/3704 | 139/8465 | 6.51e-08 | 4.84e-07 | 2.47e-07 | 92 |
| hsa043506 | Oral cavity | OSCC | TGF-beta signaling pathway | 60/3704 | 108/8465 | 8.66e-03 | 1.97e-02 | 1.00e-02 | 60 |
| hsa05418114 | Oral cavity | OSCC | Fluid shear stress and atherosclerosis | 92/3704 | 139/8465 | 6.51e-08 | 4.84e-07 | 2.47e-07 | 92 |
| hsa0435013 | Oral cavity | OSCC | TGF-beta signaling pathway | 60/3704 | 108/8465 | 8.66e-03 | 1.97e-02 | 1.00e-02 | 60 |
| hsa0541846 | Oral cavity | EOLP | Fluid shear stress and atherosclerosis | 41/1218 | 139/8465 | 2.95e-06 | 2.16e-05 | 1.28e-05 | 41 |
| hsa0541856 | Oral cavity | EOLP | Fluid shear stress and atherosclerosis | 41/1218 | 139/8465 | 2.95e-06 | 2.16e-05 | 1.28e-05 | 41 |
| hsa0541863 | Oral cavity | NEOLP | Fluid shear stress and atherosclerosis | 40/1112 | 139/8465 | 7.44e-07 | 9.10e-06 | 5.72e-06 | 40 |
| hsa0541873 | Oral cavity | NEOLP | Fluid shear stress and atherosclerosis | 40/1112 | 139/8465 | 7.44e-07 | 9.10e-06 | 5.72e-06 | 40 |
| Hugo Symbol | Variant Class | Variant Classification | dbSNP RS | HGVSc | HGVSp | HGVSp Short | SWISSPROT | BIOTYPE | SIFT | PolyPhen | Tumor Sample Barcode | Tissue | Histology | Sex | Age | Stage | Therapy Types | Drugs | Outcome |
| ACVR1 | SNV | Missense_Mutation | rs370028017 | c.193N>A | p.Val65Ile | p.V65I | Q04771 | protein_coding | tolerated(0.21) | benign(0.005) | TCGA-A2-A0D0-01 | Breast | breast invasive carcinoma | Female | <65 | I/II | Chemotherapy | cytoxan | SD |
| ACVR1 | SNV | Missense_Mutation | novel | c.1270G>A | p.Val424Met | p.V424M | Q04771 | protein_coding | tolerated(0.07) | probably_damaging(0.973) | TCGA-LL-A441-01 | Breast | breast invasive carcinoma | Female | <65 | I/II | Chemotherapy | taxotere | CR |
| ACVR1 | insertion | In_Frame_Ins | novel | c.260_261insGGATTGCTGCCCTTCATGTGAGTTACAATGTCATGCATG | p.Pro87_Gly88insAspCysCysProSerCysGluLeuGlnCysHisAlaCys | p.P87_G88insDCCPSCELQCHAC | Q04771 | protein_coding | | | TCGA-A8-A07J-01 | Breast | breast invasive carcinoma | Female | <65 | I/II | Chemotherapy | 5-fluorouracil | CR |
| ACVR1 | insertion | Nonsense_Mutation | novel | c.355_356insTAAGGACATTTCATTTCAAAAAGTAGAGAAATACAATTTTTT | p.Asn119delinsIleArgThrPheHisPheLysLysTerArgAsnThrIlePheTyr | p.N119delinsIRTFHFKK*RNTIFY | Q04771 | protein_coding | | | TCGA-AR-A0TY-01 | Breast | breast invasive carcinoma | Female | <65 | I/II | Unspecific | Paclitaxel | PD |
| ACVR1 | SNV | Missense_Mutation | novel | c.987N>C | p.Lys329Asn | p.K329N | Q04771 | protein_coding | deleterious(0) | probably_damaging(1) | TCGA-A6-3808-01 | Colorectum | colon adenocarcinoma | Male | >=65 | I/II | Unknown | Unknown | SD |
| ACVR1 | SNV | Missense_Mutation | | c.895N>G | p.Thr299Ala | p.T299A | Q04771 | protein_coding | tolerated(0.22) | benign(0.006) | TCGA-AA-3492-01 | Colorectum | colon adenocarcinoma | Female | >=65 | I/II | Unknown | Unknown | SD |
| ACVR1 | SNV | Missense_Mutation | | c.433N>A | p.Ala145Thr | p.A145T | Q04771 | protein_coding | tolerated(0.4) | benign(0.039) | TCGA-AA-3852-01 | Colorectum | colon adenocarcinoma | Male | >=65 | I/II | Unknown | Unknown | PD |
| ACVR1 | SNV | Missense_Mutation | novel | c.1411G>T | p.Ala471Ser | p.A471S | Q04771 | protein_coding | tolerated(0.42) | benign(0.289) | TCGA-AA-3949-01 | Colorectum | colon adenocarcinoma | Female | >=65 | III/IV | Unknown | Unknown | SD |
| ACVR1 | SNV | Missense_Mutation | novel | c.548N>C | p.Leu183Ser | p.L183S | Q04771 | protein_coding | deleterious(0.01) | benign(0.307) | TCGA-CA-6717-01 | Colorectum | colon adenocarcinoma | Male | <65 | I/II | Chemotherapy | oxaliplatin | CR |
| ACVR1 | SNV | Missense_Mutation | | c.869C>T | p.Ser290Leu | p.S290L | Q04771 | protein_coding | deleterious(0) | probably_damaging(1) | TCGA-D5-6530-01 | Colorectum | colon adenocarcinoma | Male | <65 | I/II | Unknown | Unknown | SD |
| Entrez ID | Symbol | Category | Interaction Types | Drug Claim Name | Drug Name | PMIDs |
| 90 | ACVR1 | DRUGGABLE GENOME, ENZYME, KINASE, SERINE THREONINE KINASE | | OSI-632 | OSI-632 | |
| 90 | ACVR1 | DRUGGABLE GENOME, ENZYME, KINASE, SERINE THREONINE KINASE | | MEK-1/MEKK-1 INHIBITOR E6201 | | 32142668 |
| 90 | ACVR1 | DRUGGABLE GENOME, ENZYME, KINASE, SERINE THREONINE KINASE | inhibitor | 249565824 | | |
| 90 | ACVR1 | DRUGGABLE GENOME, ENZYME, KINASE, SERINE THREONINE KINASE | | 681640 | CHEMBL379975 | |
| 90 | ACVR1 | DRUGGABLE GENOME, ENZYME, KINASE, SERINE THREONINE KINASE | | AG-1879 | CHEMBL406845 | |
| 90 | ACVR1 | DRUGGABLE GENOME, ENZYME, KINASE, SERINE THREONINE KINASE | | TANDUTINIB | TANDUTINIB | |
| 90 | ACVR1 | DRUGGABLE GENOME, ENZYME, KINASE, SERINE THREONINE KINASE | | VANDETANIB | VANDETANIB | |
| 90 | ACVR1 | DRUGGABLE GENOME, ENZYME, KINASE, SERINE THREONINE KINASE | inhibitor | 404859109 | | |
| 90 | ACVR1 | DRUGGABLE GENOME, ENZYME, KINASE, SERINE THREONINE KINASE | | ALK2 INHIBITOR LDN-193189 | | 24705252 |
| 90 | ACVR1 | DRUGGABLE GENOME, ENZYME, KINASE, SERINE THREONINE KINASE | inhibitor | 252166689 | | |


