| Tissue | Expression Dynamics | Abbreviation |
| Breast |  | IDC: Invasive ductal carcinoma |
| DCIS: Ductal carcinoma in situ |
| Precancer(BRCA1-mut): Precancerous lesion from BRCA1 mutation carriers |
| Colorectum (GSE201348) |  | FAP: Familial adenomatous polyposis |
| CRC: Colorectal cancer |
| Colorectum (HTA11) |  | AD: Adenomas |
| SER: Sessile serrated lesions |
| MSI-H: Microsatellite-high colorectal cancer |
| MSS: Microsatellite stable colorectal cancer |
| Endometrium | 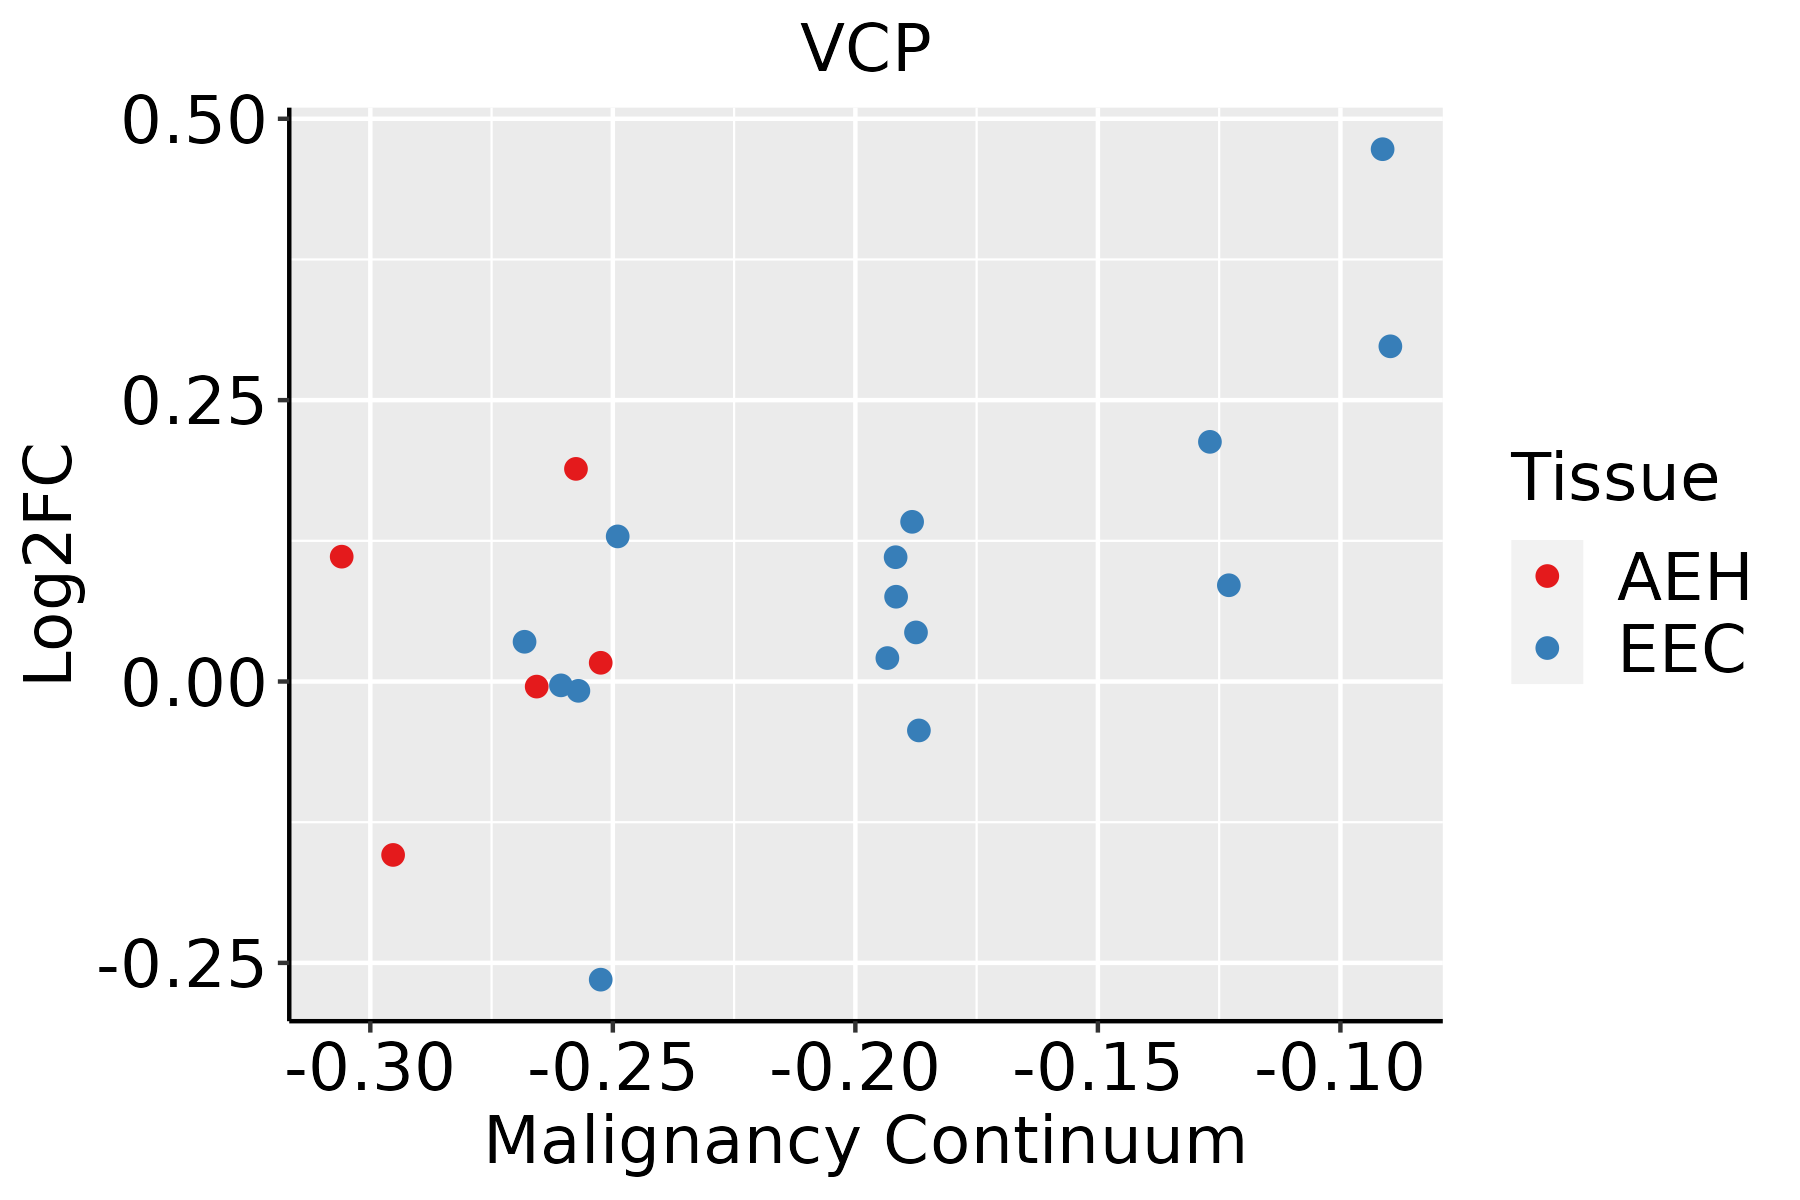 | AEH: Atypical endometrial hyperplasia |
| EEC: Endometrioid Cancer |
| Esophagus | 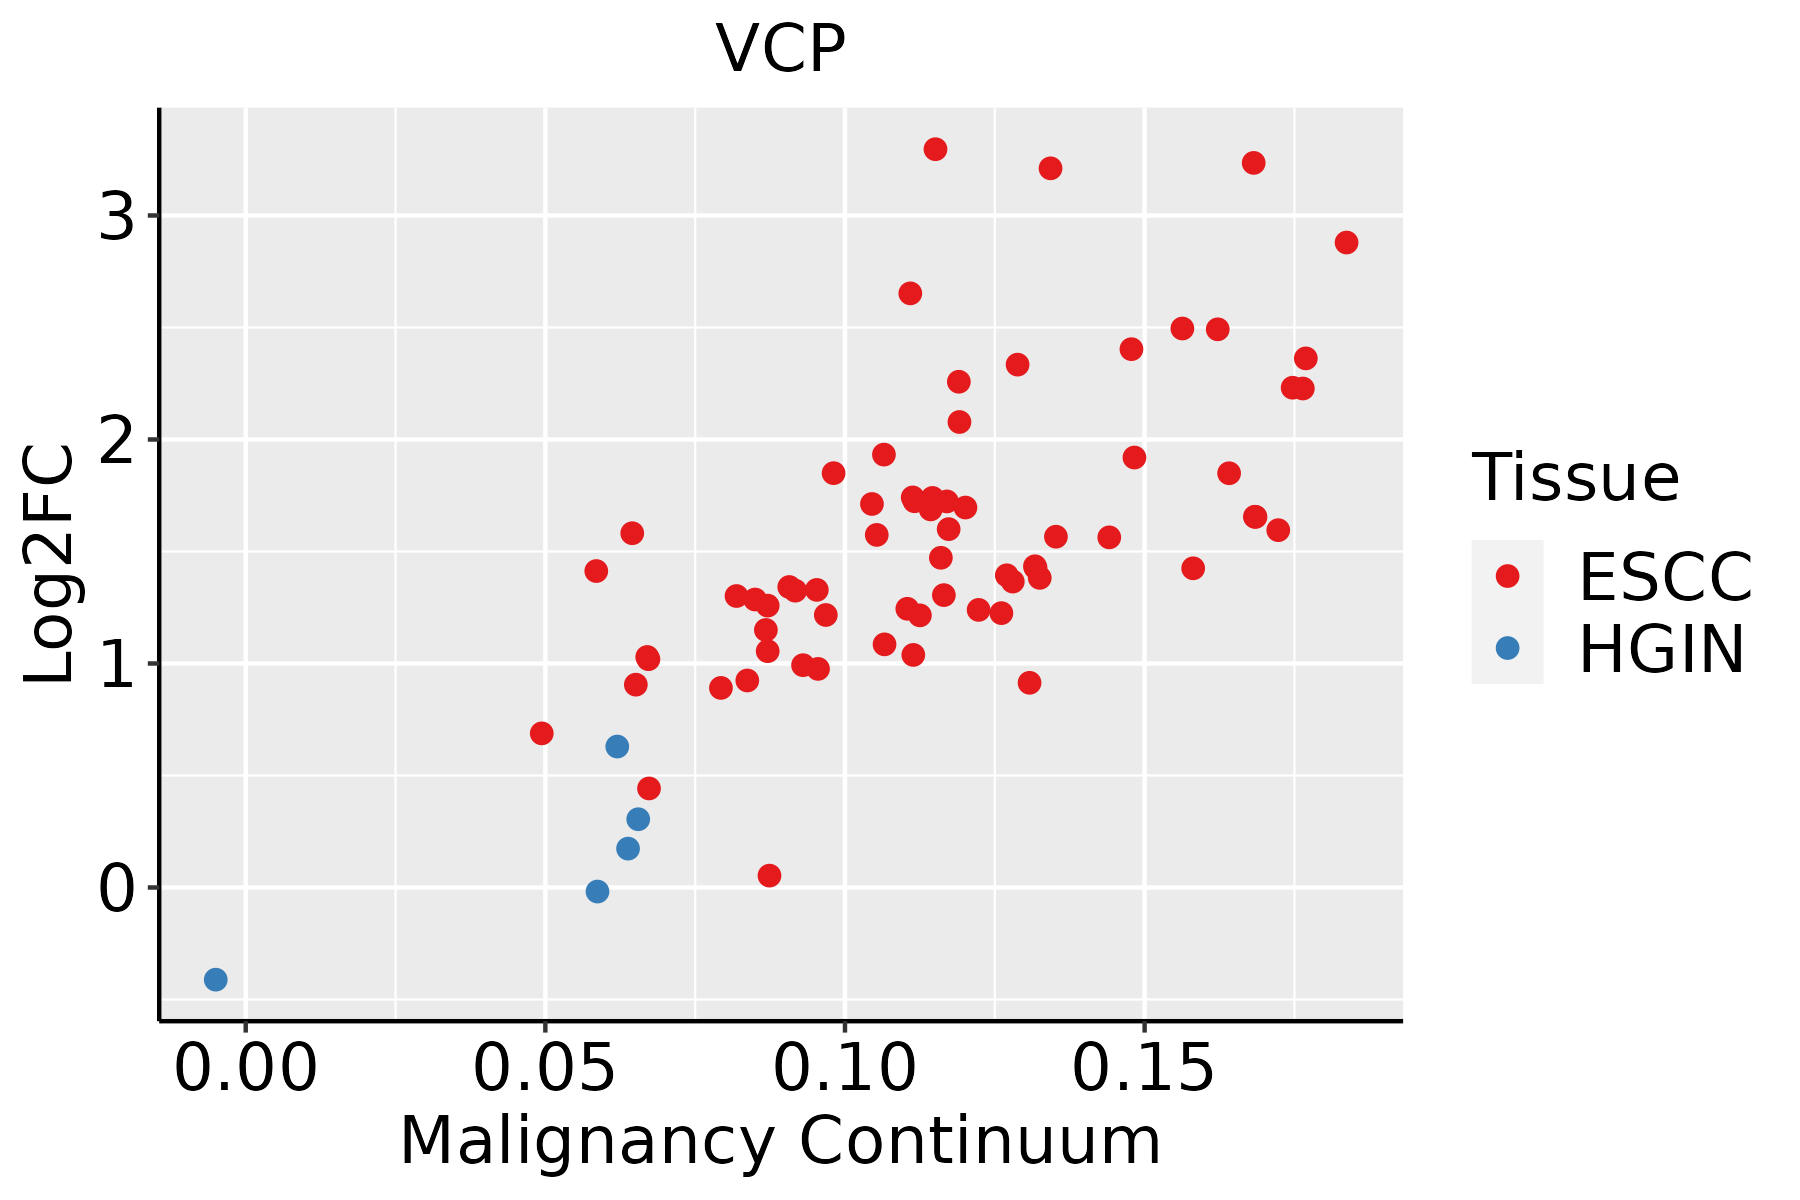 | ESCC: Esophageal squamous cell carcinoma |
| HGIN: High-grade intraepithelial neoplasias |
| LGIN: Low-grade intraepithelial neoplasias |
| GC | 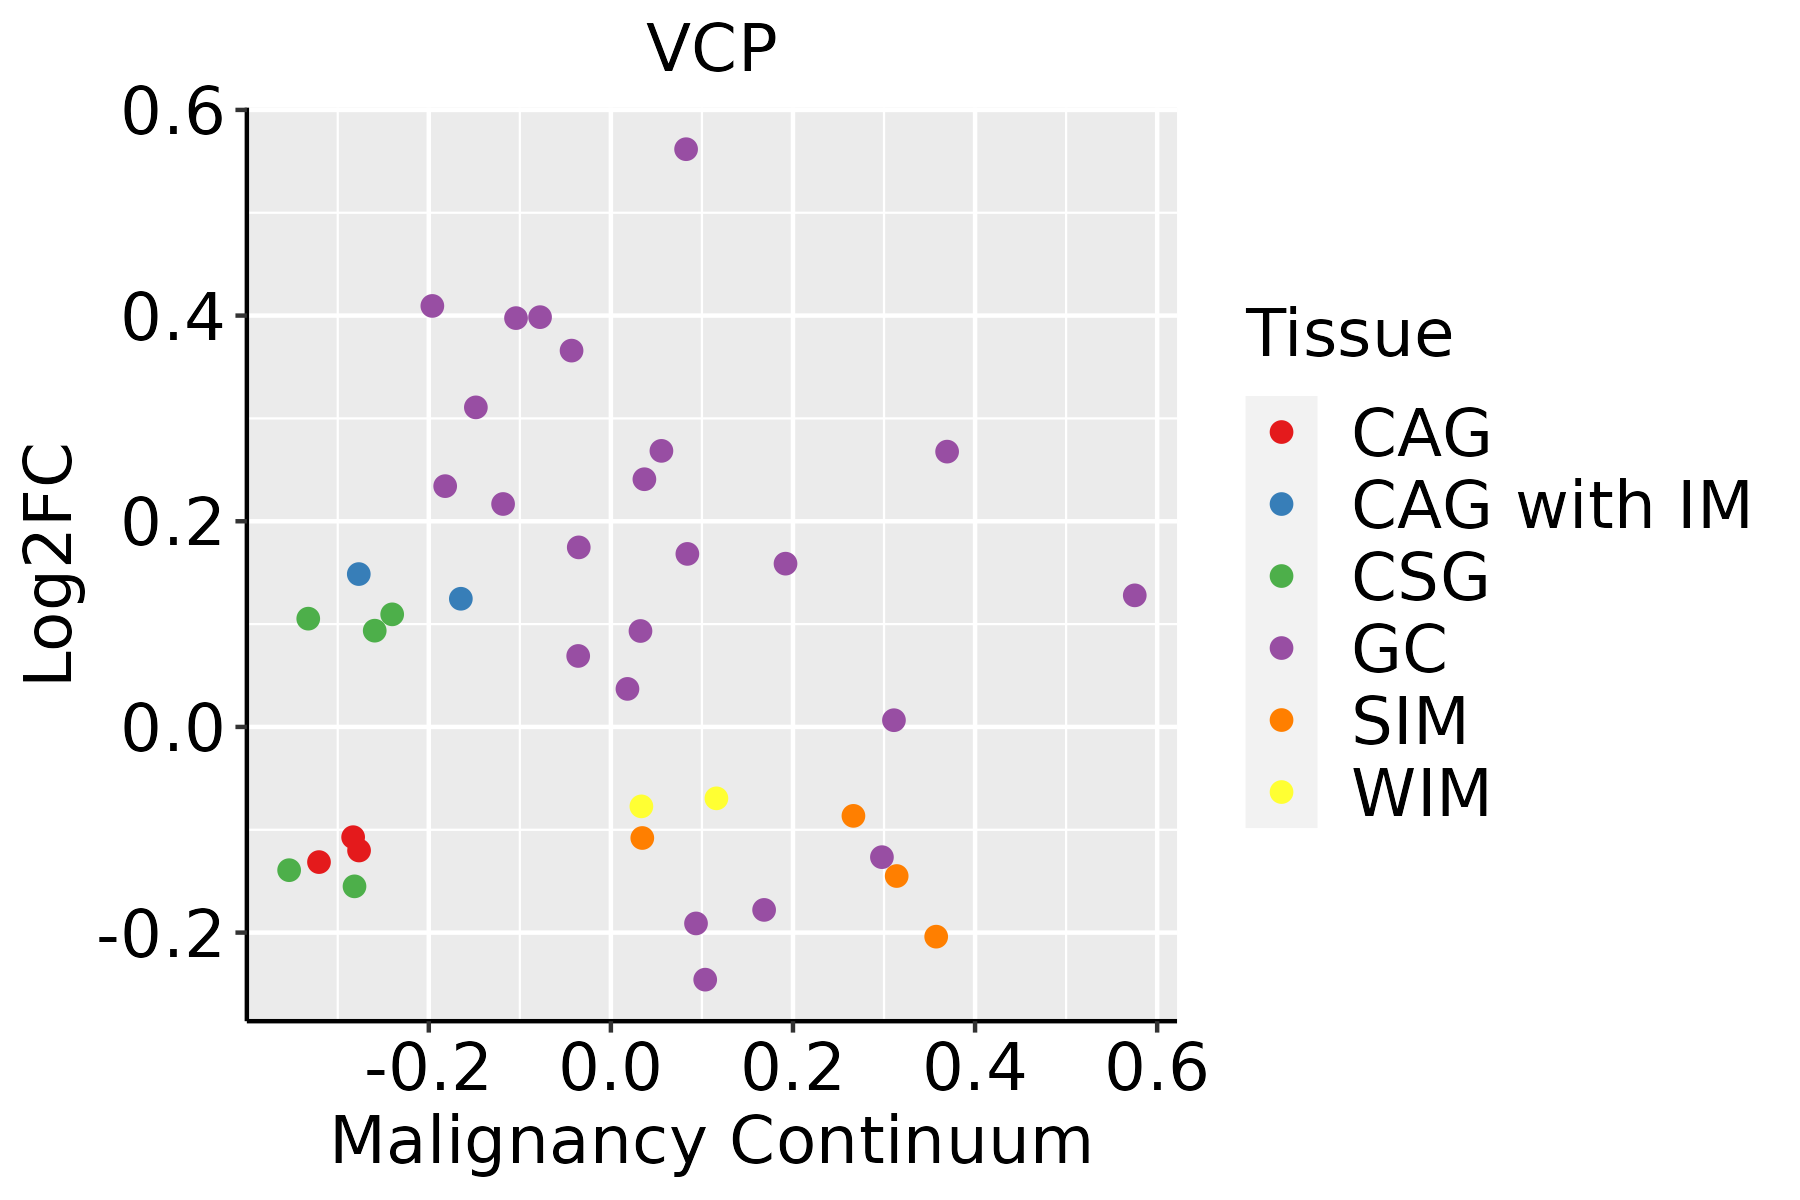 | CAG: Chronic atrophic gastritis |
| CAG with IM: Chronic atrophic gastritis with intestinal metaplasia |
| CSG: Chronic superficial gastritis |
| GC: Gastric cancer |
| SIM: Severe intestinal metaplasia |
| WIM: Wild intestinal metaplasia |
| Liver | 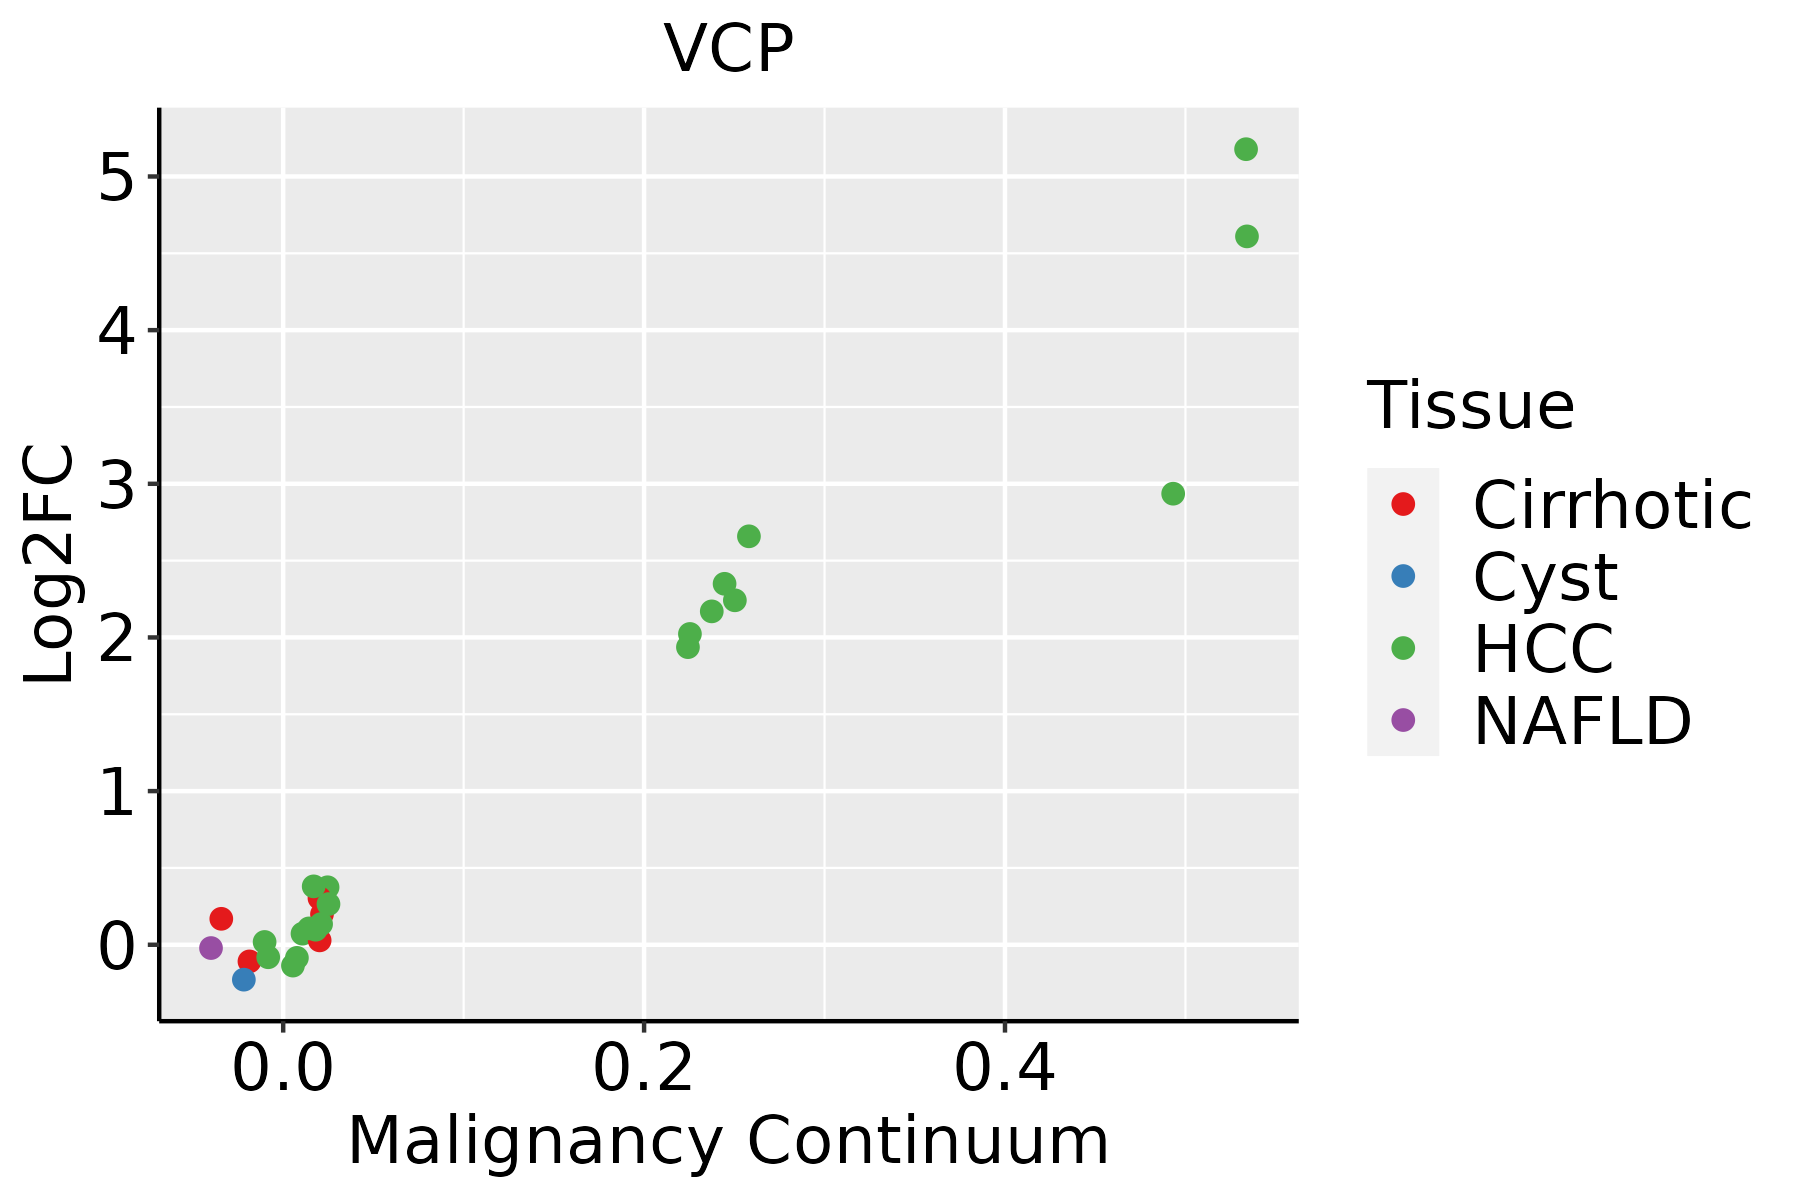 | HCC: Hepatocellular carcinoma |
| NAFLD: Non-alcoholic fatty liver disease |
| Lung |  | AAH: Atypical adenomatous hyperplasia |
| AIS: Adenocarcinoma in situ |
| IAC: Invasive lung adenocarcinoma |
| MIA: Minimally invasive adenocarcinoma |
| Oral Cavity | 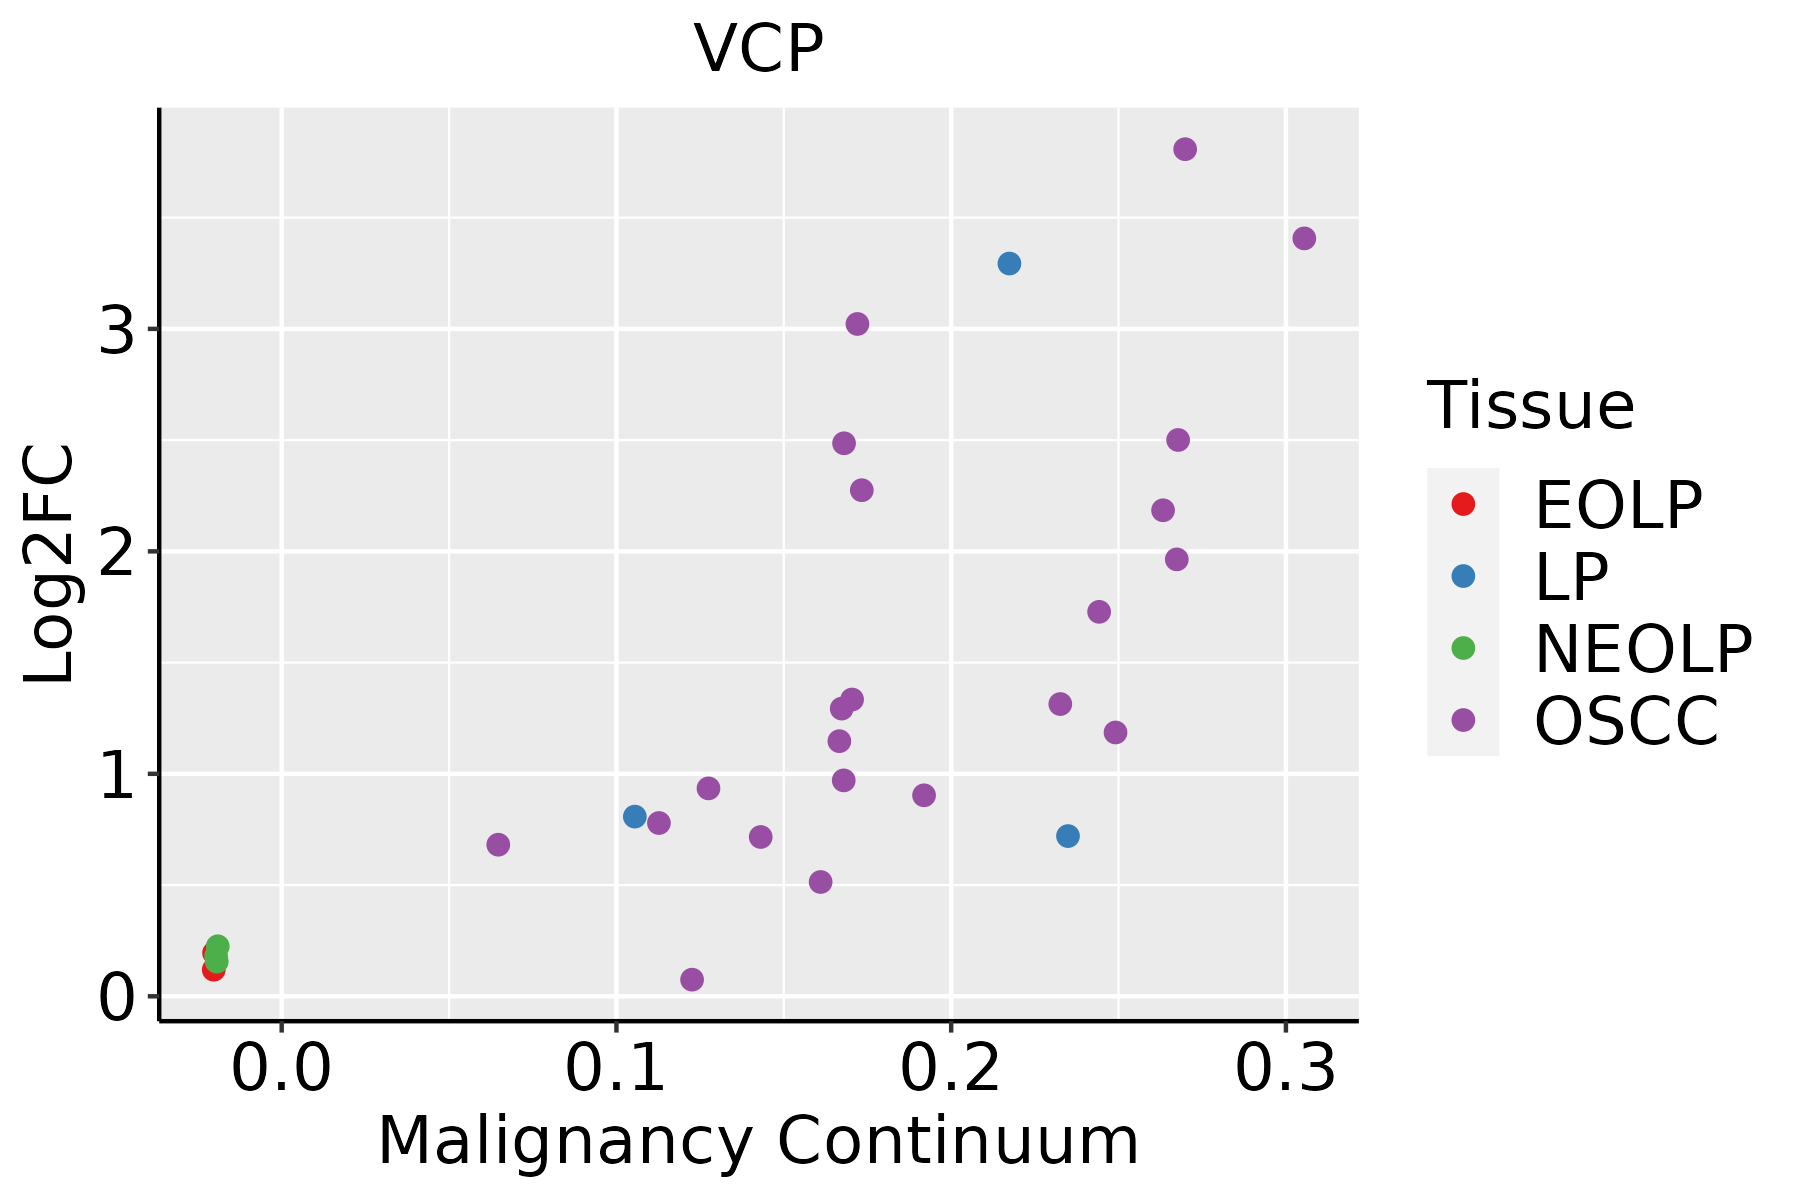 | EOLP: Erosive Oral lichen planus |
| LP: leukoplakia |
| NEOLP: Non-erosive oral lichen planus |
| OSCC: Oral squamous cell carcinoma |
| Prostate | 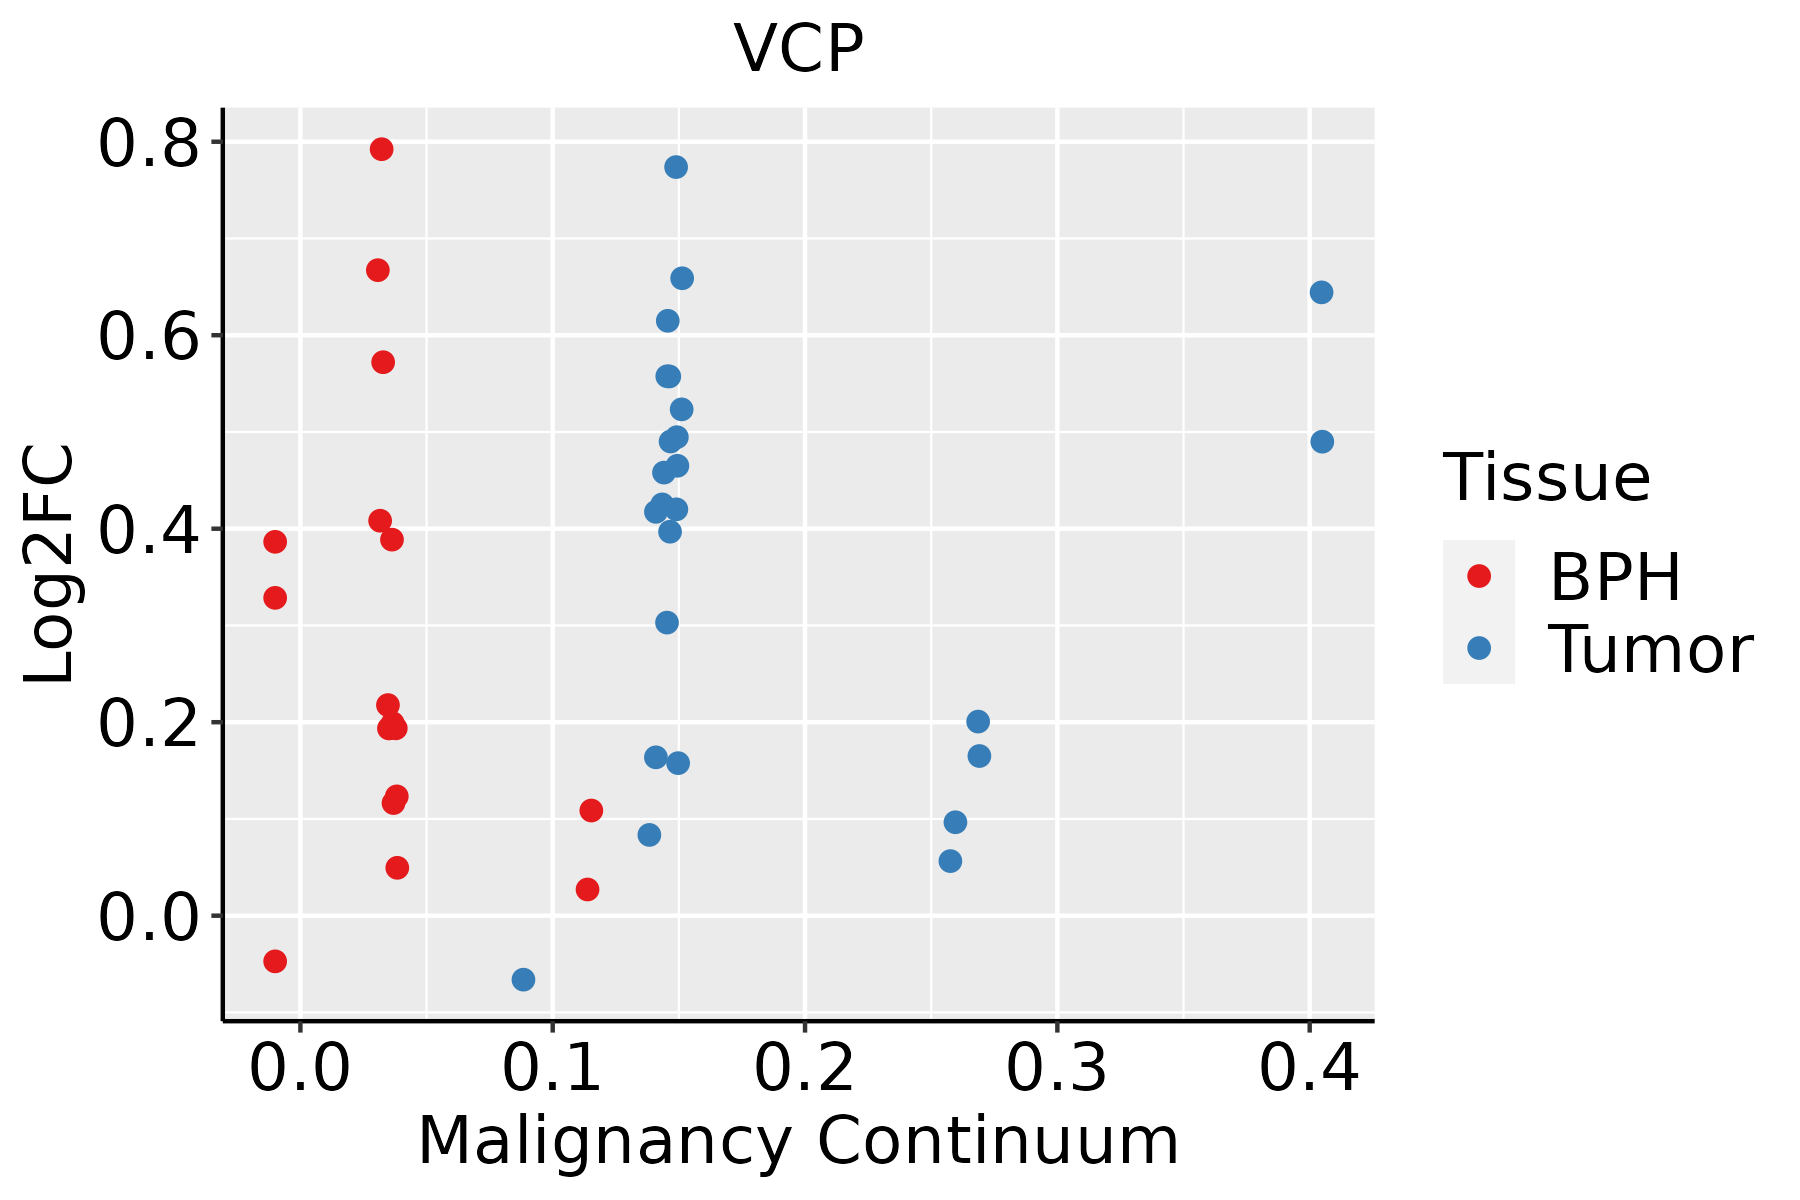 | BPH: Benign Prostatic Hyperplasia |
| Skin |  | AK: Actinic keratosis |
| cSCC: Cutaneous squamous cell carcinoma |
| SCCIS:squamous cell carcinoma in situ |
| Thyroid |  | ATC: Anaplastic thyroid cancer |
| HT: Hashimoto's thyroiditis |
| PTC: Papillary thyroid cancer |
| GO ID | Tissue | Disease Stage | Description | Gene Ratio | Bg Ratio | pvalue | p.adjust | Count |
| GO:001095219 | Prostate | Tumor | positive regulation of peptidase activity | 68/3246 | 197/18723 | 4.09e-09 | 1.66e-07 | 68 |
| GO:003011114 | Prostate | Tumor | regulation of Wnt signaling pathway | 99/3246 | 328/18723 | 5.92e-09 | 2.34e-07 | 99 |
| GO:000914418 | Prostate | Tumor | purine nucleoside triphosphate metabolic process | 38/3246 | 88/18723 | 1.28e-08 | 4.66e-07 | 38 |
| GO:190336419 | Prostate | Tumor | positive regulation of cellular protein catabolic process | 56/3246 | 155/18723 | 1.51e-08 | 5.43e-07 | 56 |
| GO:003460518 | Prostate | Tumor | cellular response to heat | 32/3246 | 69/18723 | 2.21e-08 | 7.68e-07 | 32 |
| GO:000925918 | Prostate | Tumor | ribonucleotide metabolic process | 110/3246 | 385/18723 | 2.45e-08 | 8.29e-07 | 110 |
| GO:000688813 | Prostate | Tumor | endoplasmic reticulum to Golgi vesicle-mediated transport | 49/3246 | 130/18723 | 2.49e-08 | 8.33e-07 | 49 |
| GO:001907919 | Prostate | Tumor | viral genome replication | 49/3246 | 131/18723 | 3.31e-08 | 1.06e-06 | 49 |
| GO:006082814 | Prostate | Tumor | regulation of canonical Wnt signaling pathway | 79/3246 | 253/18723 | 4.01e-08 | 1.25e-06 | 79 |
| GO:000616319 | Prostate | Tumor | purine nucleotide metabolic process | 111/3246 | 396/18723 | 6.46e-08 | 1.88e-06 | 111 |
| GO:001969318 | Prostate | Tumor | ribose phosphate metabolic process | 111/3246 | 396/18723 | 6.46e-08 | 1.88e-06 | 111 |
| GO:000920517 | Prostate | Tumor | purine ribonucleoside triphosphate metabolic process | 35/3246 | 82/18723 | 6.76e-08 | 1.95e-06 | 35 |
| GO:001623614 | Prostate | Tumor | macroautophagy | 87/3246 | 291/18723 | 7.82e-08 | 2.16e-06 | 87 |
| GO:002241118 | Prostate | Tumor | cellular component disassembly | 121/3246 | 443/18723 | 8.10e-08 | 2.23e-06 | 121 |
| GO:007252119 | Prostate | Tumor | purine-containing compound metabolic process | 115/3246 | 416/18723 | 8.47e-08 | 2.31e-06 | 115 |
| GO:000914517 | Prostate | Tumor | purine nucleoside triphosphate biosynthetic process | 31/3246 | 69/18723 | 9.10e-08 | 2.45e-06 | 31 |
| GO:003465516 | Prostate | Tumor | nucleobase-containing compound catabolic process | 112/3246 | 407/18723 | 1.61e-07 | 4.02e-06 | 112 |
| GO:200006019 | Prostate | Tumor | positive regulation of ubiquitin-dependent protein catabolic process | 41/3246 | 107/18723 | 1.99e-07 | 4.86e-06 | 41 |
| GO:000926615 | Prostate | Tumor | response to temperature stimulus | 59/3246 | 178/18723 | 2.14e-07 | 5.21e-06 | 59 |
| GO:000920617 | Prostate | Tumor | purine ribonucleoside triphosphate biosynthetic process | 30/3246 | 68/18723 | 2.40e-07 | 5.65e-06 | 30 |
| Pathway ID | Tissue | Disease Stage | Description | Gene Ratio | Bg Ratio | pvalue | p.adjust | qvalue | Count |
| hsa0501416 | Breast | Precancer | Amyotrophic lateral sclerosis | 98/684 | 364/8465 | 2.13e-28 | 8.41e-27 | 6.44e-27 | 98 |
| hsa0502216 | Breast | Precancer | Pathways of neurodegeneration - multiple diseases | 112/684 | 476/8465 | 6.96e-27 | 2.44e-25 | 1.87e-25 | 112 |
| hsa0513414 | Breast | Precancer | Legionellosis | 19/684 | 57/8465 | 4.62e-08 | 9.12e-07 | 6.98e-07 | 19 |
| hsa0414118 | Breast | Precancer | Protein processing in endoplasmic reticulum | 33/684 | 174/8465 | 2.78e-06 | 3.83e-05 | 2.94e-05 | 33 |
| hsa0501417 | Breast | Precancer | Amyotrophic lateral sclerosis | 98/684 | 364/8465 | 2.13e-28 | 8.41e-27 | 6.44e-27 | 98 |
| hsa0502217 | Breast | Precancer | Pathways of neurodegeneration - multiple diseases | 112/684 | 476/8465 | 6.96e-27 | 2.44e-25 | 1.87e-25 | 112 |
| hsa0513415 | Breast | Precancer | Legionellosis | 19/684 | 57/8465 | 4.62e-08 | 9.12e-07 | 6.98e-07 | 19 |
| hsa0414119 | Breast | Precancer | Protein processing in endoplasmic reticulum | 33/684 | 174/8465 | 2.78e-06 | 3.83e-05 | 2.94e-05 | 33 |
| hsa0501423 | Breast | IDC | Amyotrophic lateral sclerosis | 102/867 | 364/8465 | 1.29e-22 | 5.22e-21 | 3.91e-21 | 102 |
| hsa0502223 | Breast | IDC | Pathways of neurodegeneration - multiple diseases | 116/867 | 476/8465 | 3.63e-20 | 1.18e-18 | 8.82e-19 | 116 |
| hsa0513422 | Breast | IDC | Legionellosis | 19/867 | 57/8465 | 1.89e-06 | 3.07e-05 | 2.29e-05 | 19 |
| hsa0414124 | Breast | IDC | Protein processing in endoplasmic reticulum | 36/867 | 174/8465 | 2.73e-05 | 2.86e-04 | 2.14e-04 | 36 |
| hsa0501433 | Breast | IDC | Amyotrophic lateral sclerosis | 102/867 | 364/8465 | 1.29e-22 | 5.22e-21 | 3.91e-21 | 102 |
| hsa0502233 | Breast | IDC | Pathways of neurodegeneration - multiple diseases | 116/867 | 476/8465 | 3.63e-20 | 1.18e-18 | 8.82e-19 | 116 |
| hsa0513432 | Breast | IDC | Legionellosis | 19/867 | 57/8465 | 1.89e-06 | 3.07e-05 | 2.29e-05 | 19 |
| hsa0414134 | Breast | IDC | Protein processing in endoplasmic reticulum | 36/867 | 174/8465 | 2.73e-05 | 2.86e-04 | 2.14e-04 | 36 |
| hsa0501443 | Breast | DCIS | Amyotrophic lateral sclerosis | 101/846 | 364/8465 | 7.14e-23 | 2.88e-21 | 2.12e-21 | 101 |
| hsa0502243 | Breast | DCIS | Pathways of neurodegeneration - multiple diseases | 114/846 | 476/8465 | 4.74e-20 | 1.53e-18 | 1.13e-18 | 114 |
| hsa0513441 | Breast | DCIS | Legionellosis | 19/846 | 57/8465 | 1.30e-06 | 2.10e-05 | 1.55e-05 | 19 |
| hsa0414143 | Breast | DCIS | Protein processing in endoplasmic reticulum | 36/846 | 174/8465 | 1.60e-05 | 1.91e-04 | 1.41e-04 | 36 |
| Hugo Symbol | Variant Class | Variant Classification | dbSNP RS | HGVSc | HGVSp | HGVSp Short | SWISSPROT | BIOTYPE | SIFT | PolyPhen | Tumor Sample Barcode | Tissue | Histology | Sex | Age | Stage | Therapy Types | Drugs | Outcome |
| VCP | SNV | Missense_Mutation | rs748091463 | c.211G>A | p.Val71Ile | p.V71I | P55072 | protein_coding | tolerated(0.09) | benign(0.013) | TCGA-A8-A07B-01 | Breast | breast invasive carcinoma | Female | >=65 | I/II | Unknown | Unknown | SD |
| VCP | SNV | Missense_Mutation | | c.574N>C | p.Glu192Gln | p.E192Q | P55072 | protein_coding | deleterious(0.02) | possibly_damaging(0.669) | TCGA-A8-A095-01 | Breast | breast invasive carcinoma | Female | <65 | I/II | Chemotherapy | 5-fluorouracil | CR |
| VCP | SNV | Missense_Mutation | | c.764C>T | p.Ala255Val | p.A255V | P55072 | protein_coding | deleterious(0.01) | probably_damaging(0.999) | TCGA-AN-A0AK-01 | Breast | breast invasive carcinoma | Female | >=65 | I/II | Unknown | Unknown | SD |
| VCP | SNV | Missense_Mutation | | c.1675G>A | p.Val559Ile | p.V559I | P55072 | protein_coding | tolerated(0.34) | possibly_damaging(0.863) | TCGA-AR-A0TT-01 | Breast | breast invasive carcinoma | Female | <65 | III/IV | Chemotherapy | doxorubicin | SD |
| VCP | SNV | Missense_Mutation | | c.186G>C | p.Lys62Asn | p.K62N | P55072 | protein_coding | deleterious(0.02) | probably_damaging(0.979) | TCGA-E2-A10C-01 | Breast | breast invasive carcinoma | Female | <65 | I/II | Chemotherapy | cytoxan | SD |
| VCP | insertion | Nonsense_Mutation | novel | c.1128_1129insACCTACTGTTCTTAGGTTTGAGG | p.Arg377ThrfsTer5 | p.R377Tfs*5 | P55072 | protein_coding | | | TCGA-BH-A0EE-01 | Breast | breast invasive carcinoma | Female | >=65 | I/II | Chemotherapy | docetaxel | SD |
| VCP | deletion | Frame_Shift_Del | novel | c.1226delN | p.Ala409ValfsTer3 | p.A409Vfs*3 | P55072 | protein_coding | | | TCGA-D8-A27V-01 | Breast | breast invasive carcinoma | Female | <65 | I/II | Hormone Therapy | tamoxiphen | SD |
| VCP | SNV | Missense_Mutation | | c.1271N>A | p.Arg424His | p.R424H | P55072 | protein_coding | deleterious(0) | probably_damaging(0.999) | TCGA-2W-A8YY-01 | Cervix | cervical & endocervical cancer | Female | <65 | I/II | Chemotherapy | cisplatin | CR |
| VCP | SNV | Missense_Mutation | | c.85N>C | p.Asp29His | p.D29H | P55072 | protein_coding | deleterious(0) | probably_damaging(0.955) | TCGA-DS-A1OC-01 | Cervix | cervical & endocervical cancer | Female | <65 | I/II | Chemotherapy | gemcitabine | SD |
| VCP | SNV | Missense_Mutation | | c.585A>T | p.Glu195Asp | p.E195D | P55072 | protein_coding | tolerated(0.21) | benign(0.017) | TCGA-EA-A1QS-01 | Cervix | cervical & endocervical cancer | Female | <65 | I/II | Unknown | Unknown | SD |


