| Tissue | Expression Dynamics | Abbreviation |
| Cervix | 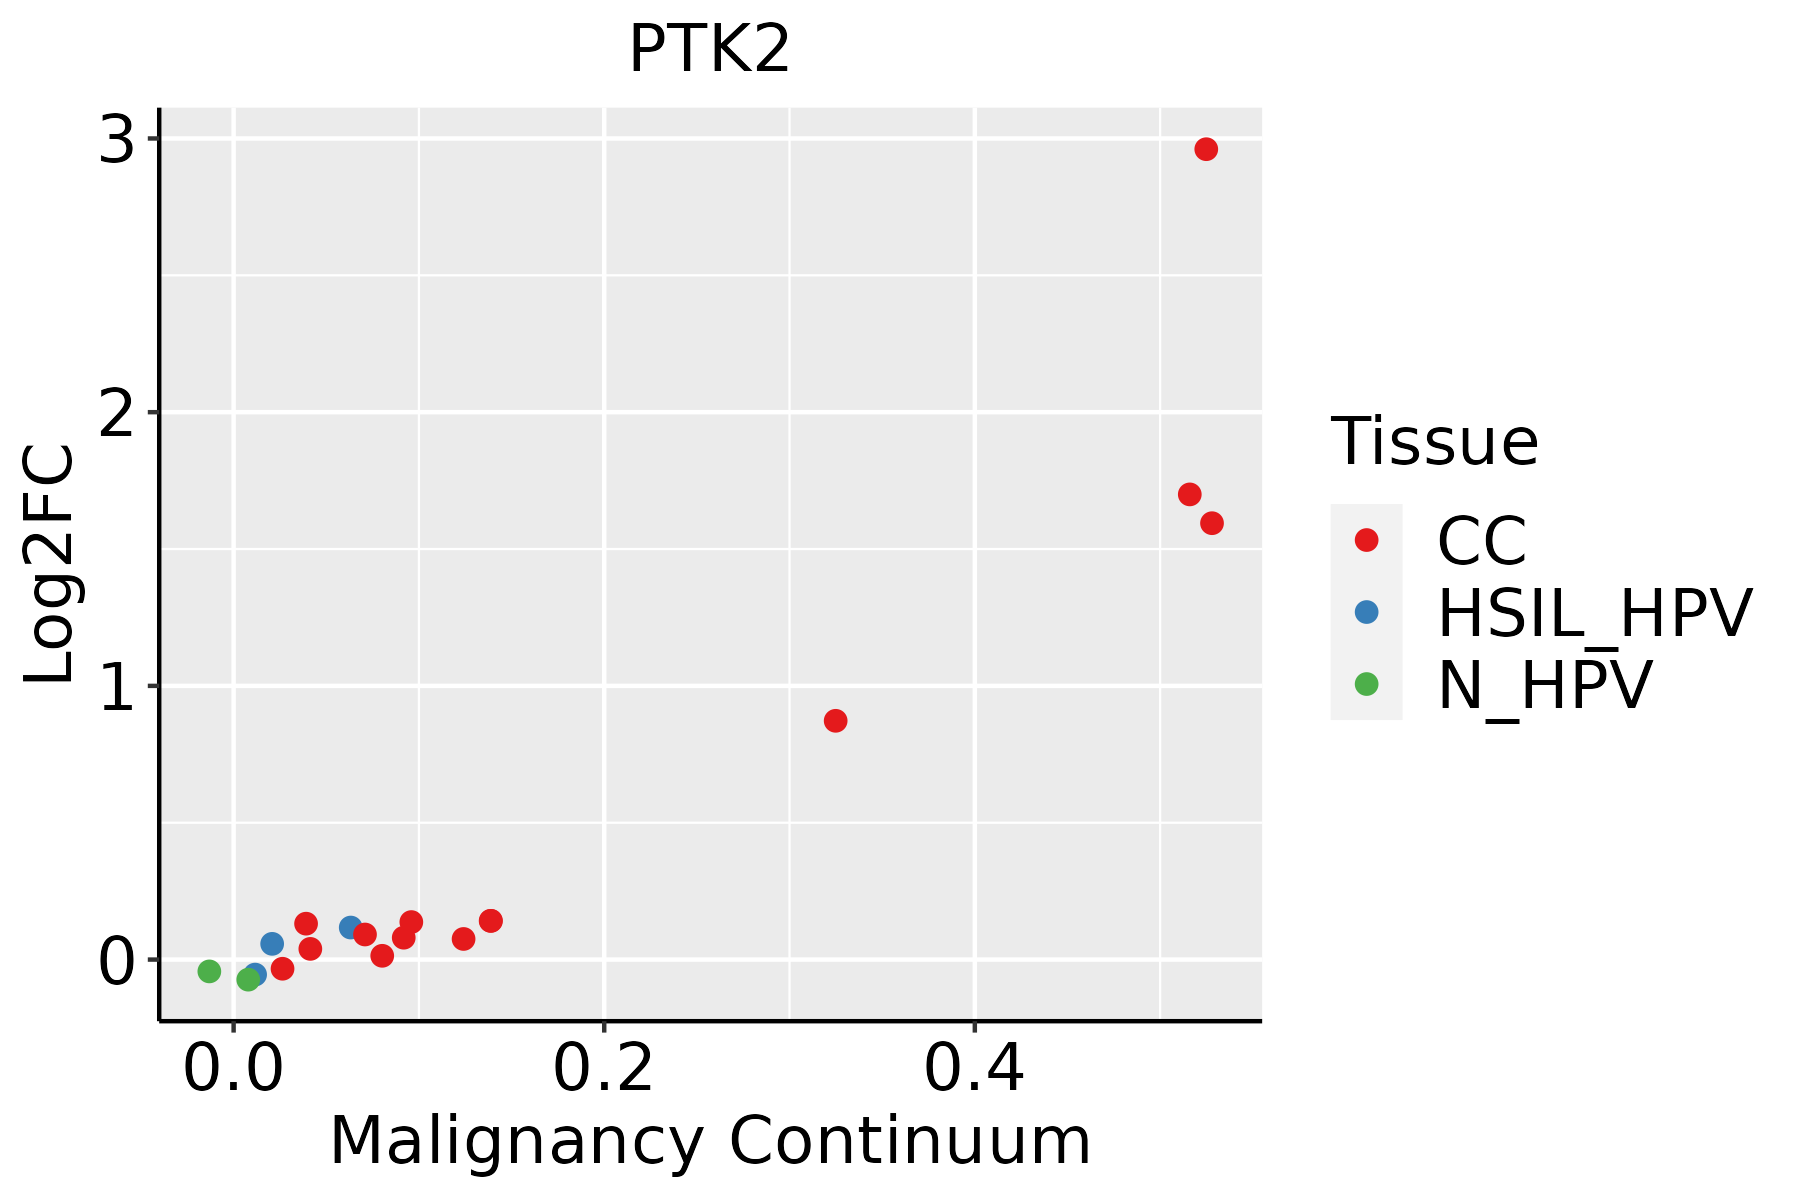 | CC: Cervix cancer |
| HSIL_HPV: HPV-infected high-grade squamous intraepithelial lesions |
| N_HPV: HPV-infected normal cervix |
| Colorectum (GSE201348) |  | FAP: Familial adenomatous polyposis |
| CRC: Colorectal cancer |
| Colorectum (HTA11) |  | AD: Adenomas |
| SER: Sessile serrated lesions |
| MSI-H: Microsatellite-high colorectal cancer |
| MSS: Microsatellite stable colorectal cancer |
| Endometrium | 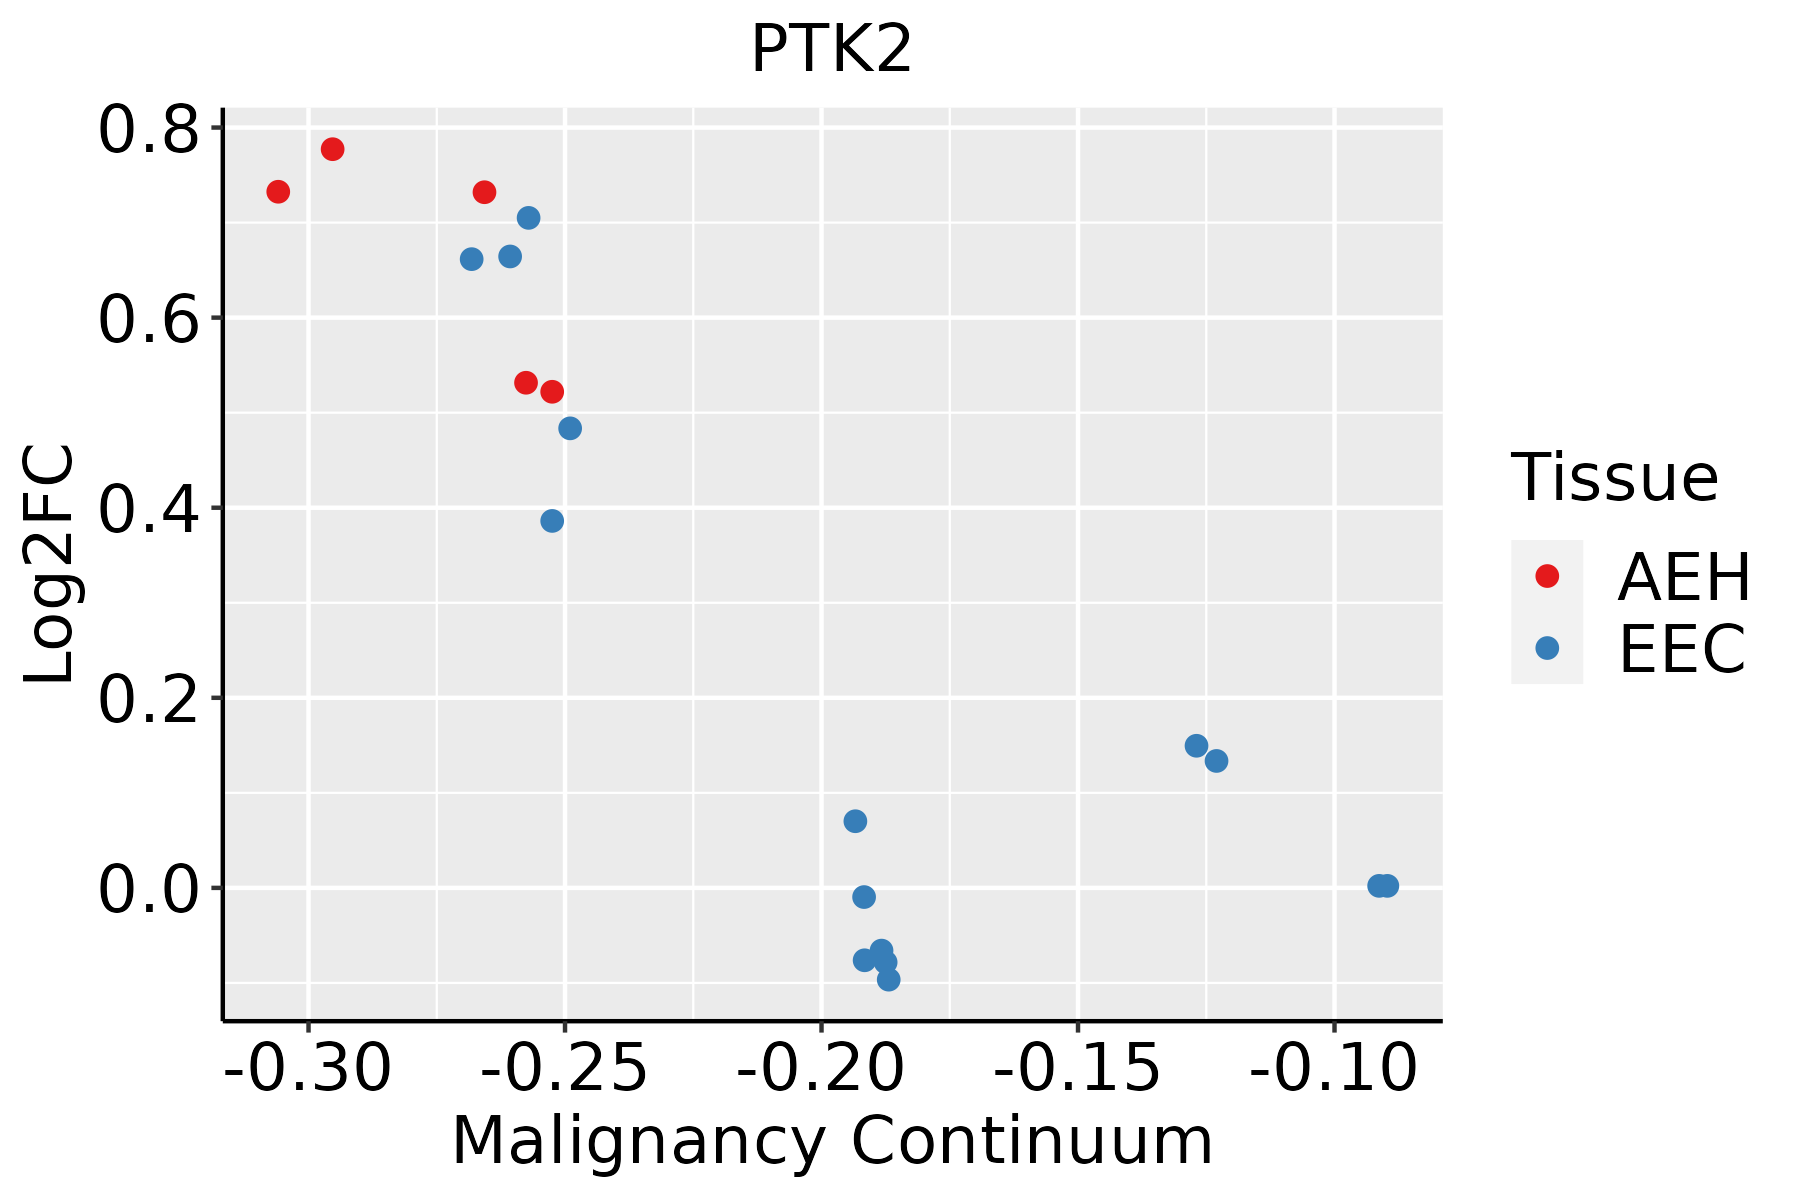 | AEH: Atypical endometrial hyperplasia |
| EEC: Endometrioid Cancer |
| Esophagus | 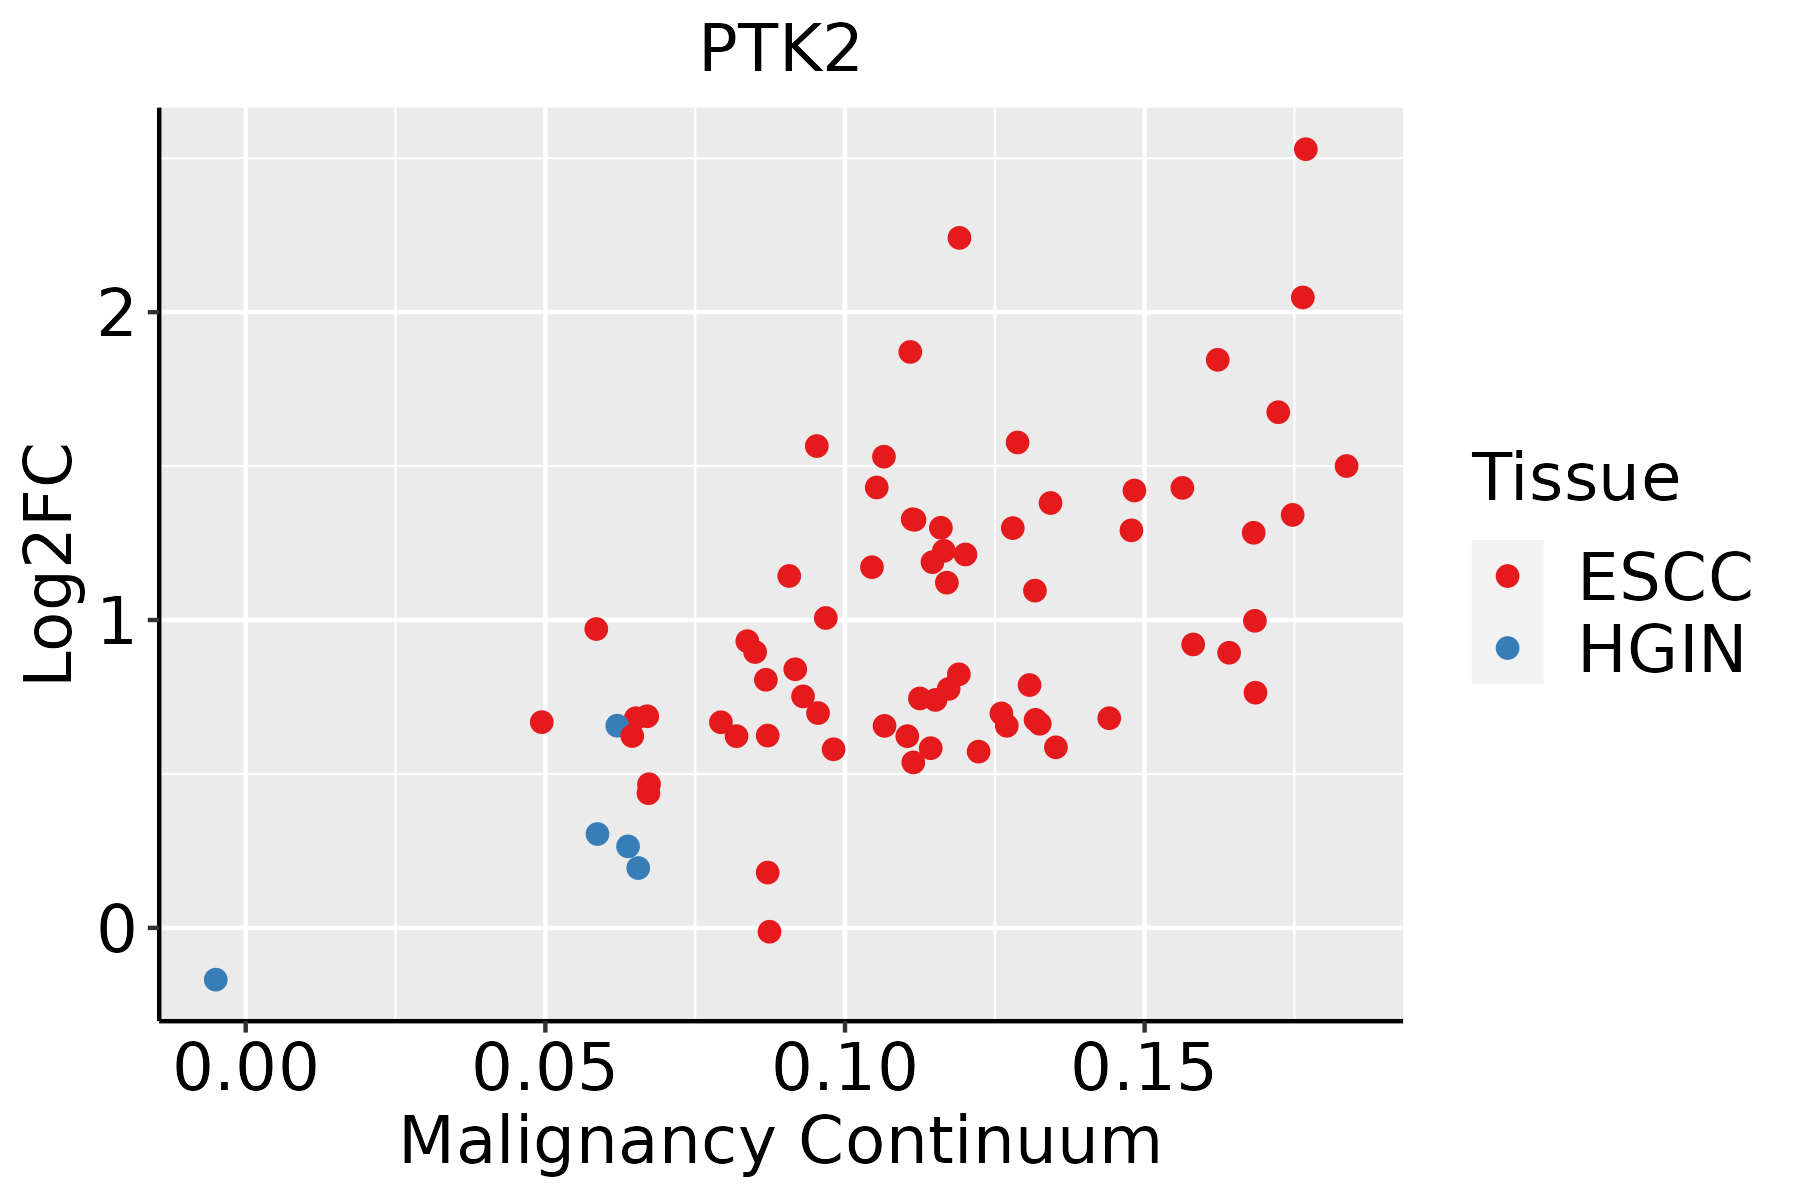 | ESCC: Esophageal squamous cell carcinoma |
| HGIN: High-grade intraepithelial neoplasias |
| LGIN: Low-grade intraepithelial neoplasias |
| Liver |  | HCC: Hepatocellular carcinoma |
| NAFLD: Non-alcoholic fatty liver disease |
| Lung | 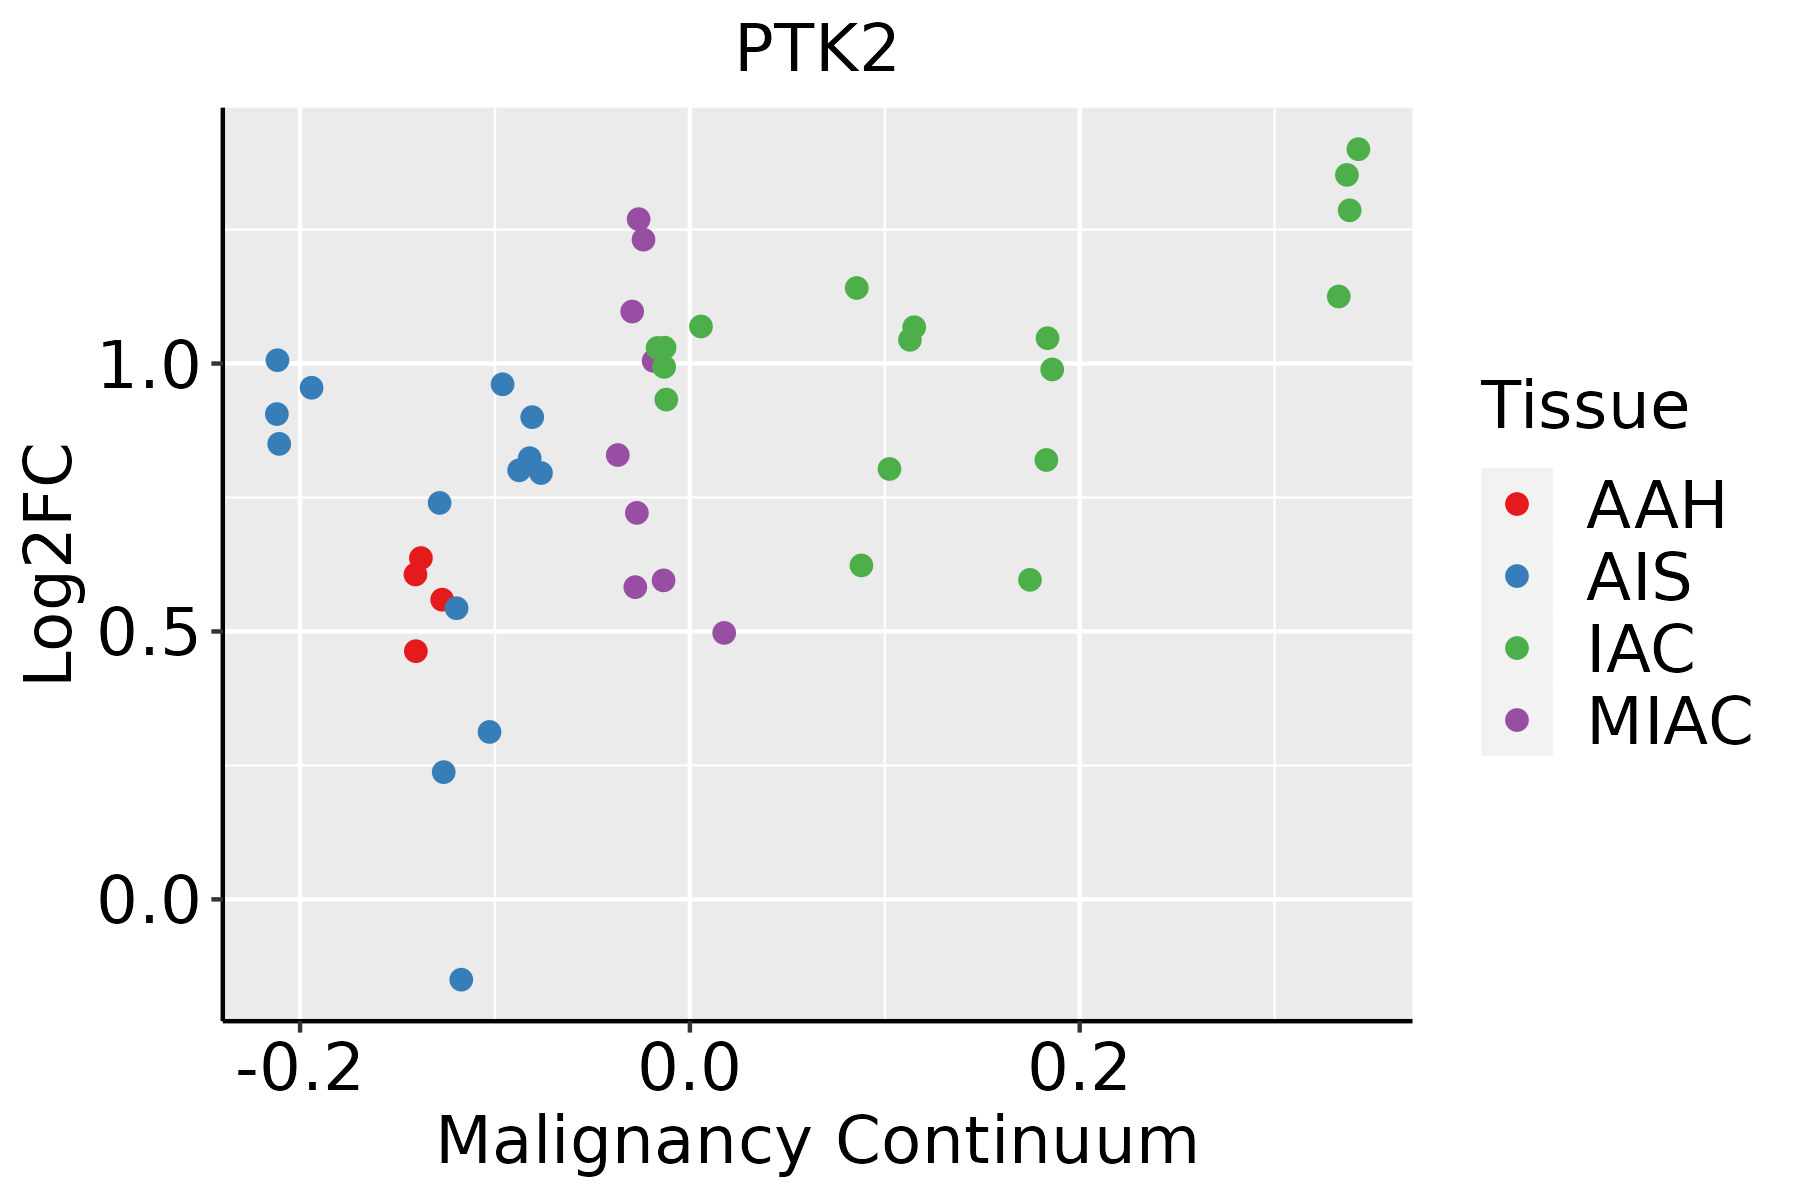 | AAH: Atypical adenomatous hyperplasia |
| AIS: Adenocarcinoma in situ |
| IAC: Invasive lung adenocarcinoma |
| MIA: Minimally invasive adenocarcinoma |
| Oral Cavity | 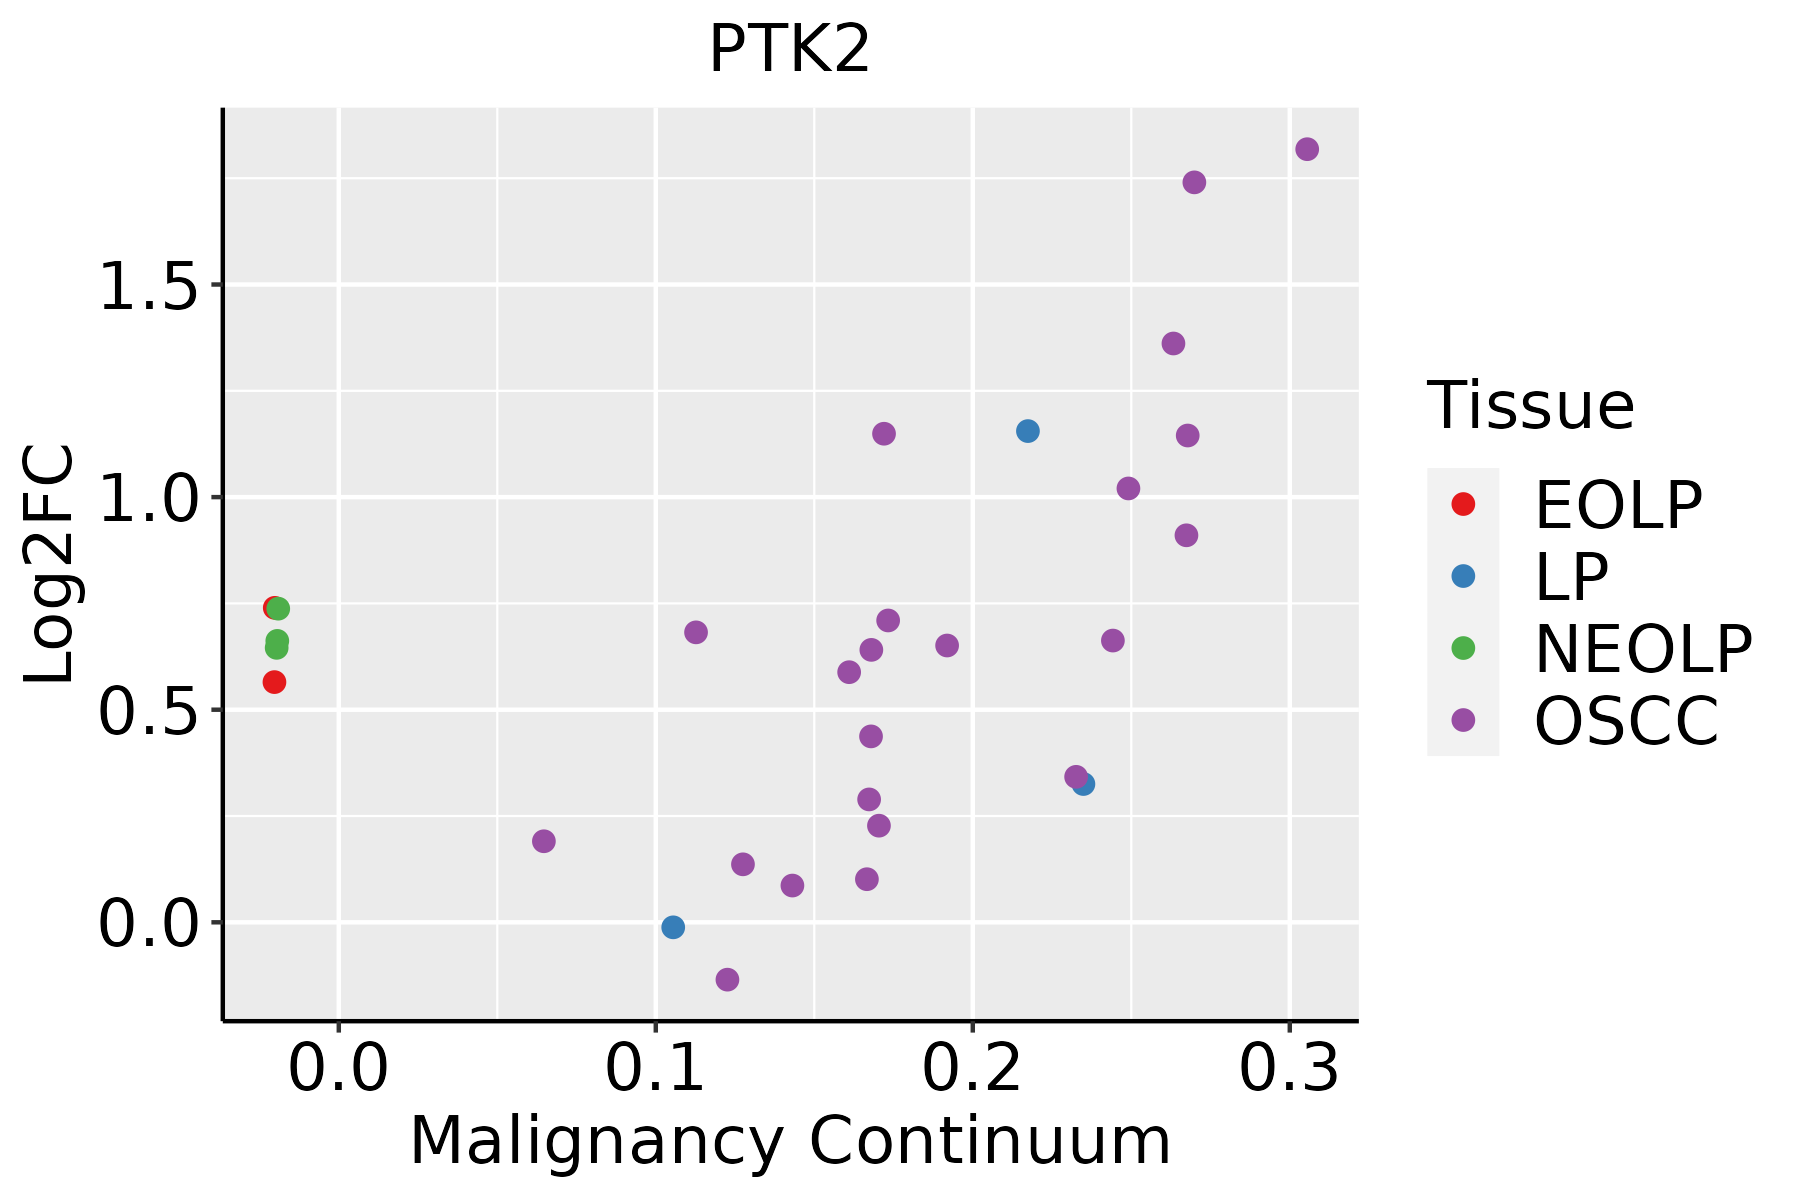 | EOLP: Erosive Oral lichen planus |
| LP: leukoplakia |
| NEOLP: Non-erosive oral lichen planus |
| OSCC: Oral squamous cell carcinoma |
| Prostate | 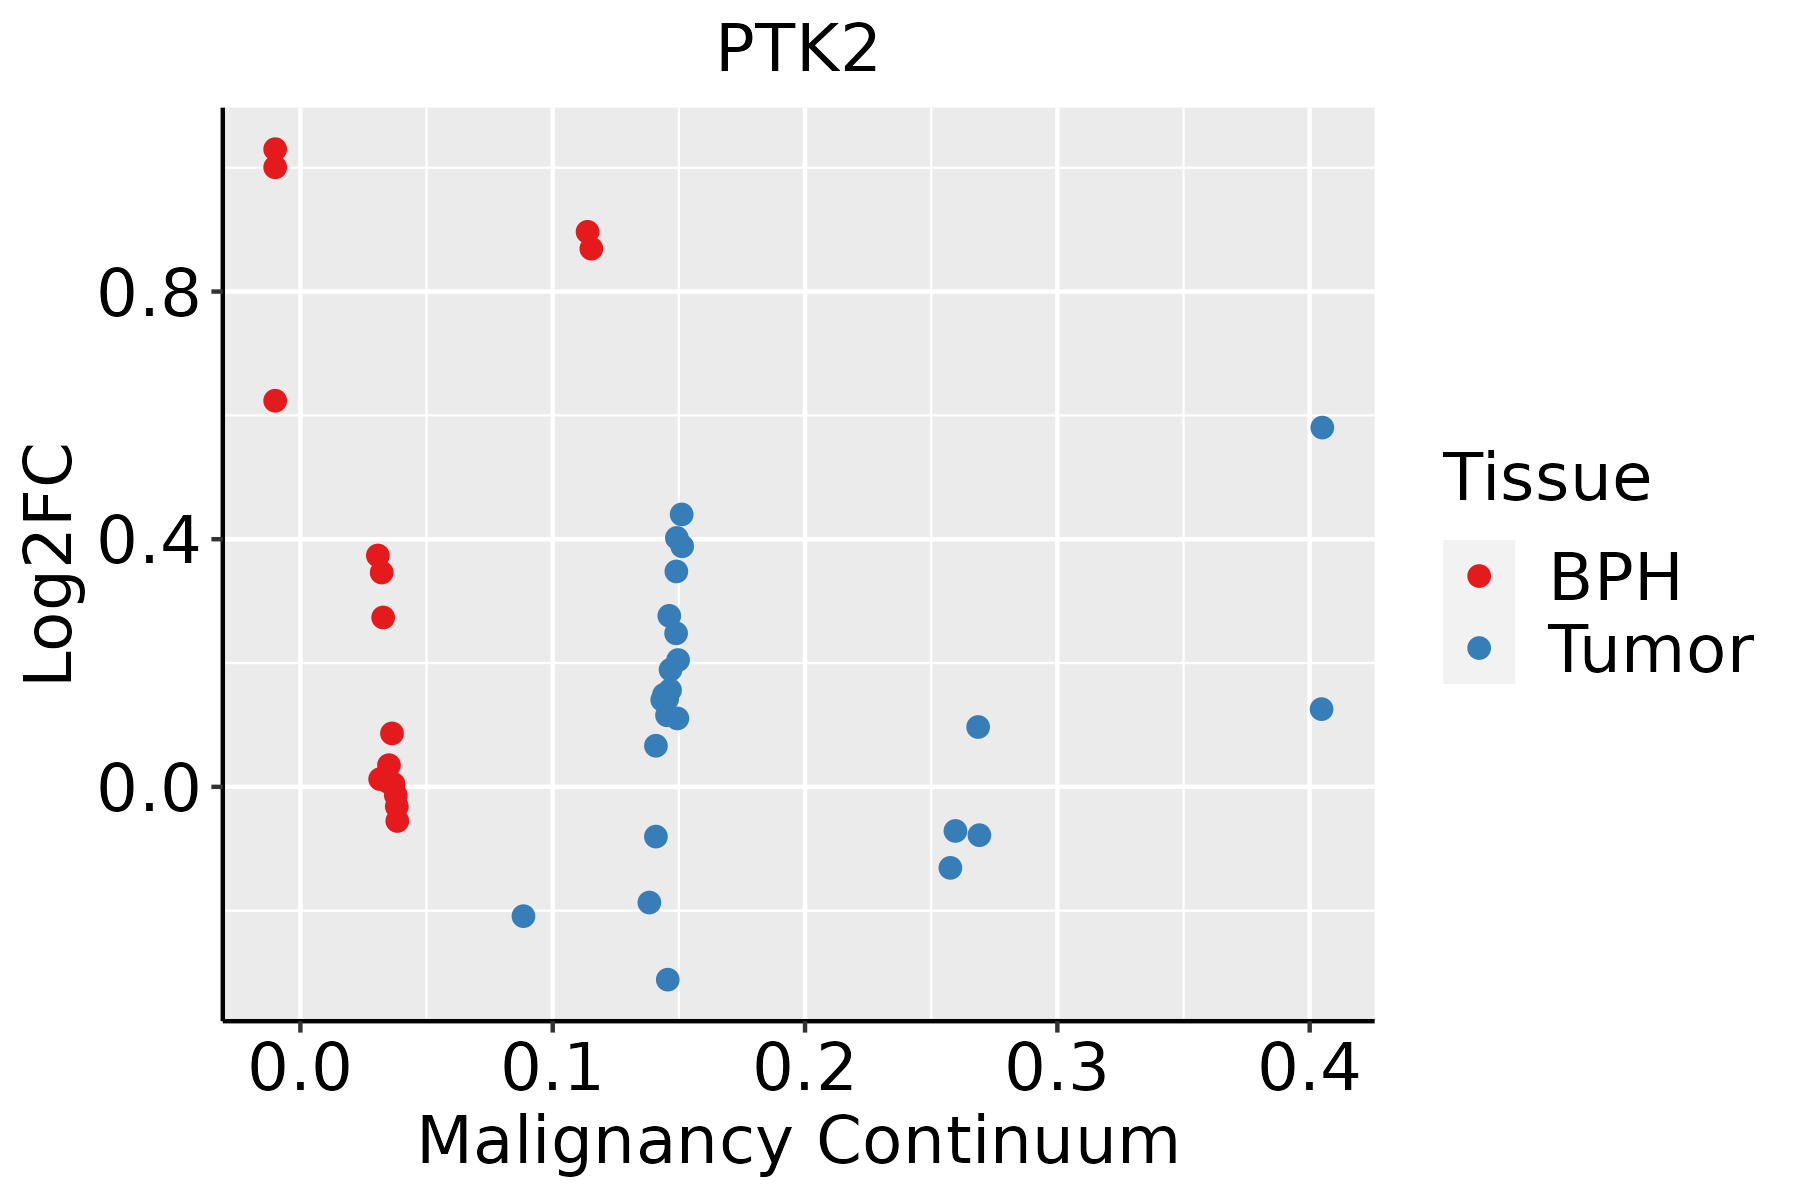 | BPH: Benign Prostatic Hyperplasia |
| Skin | 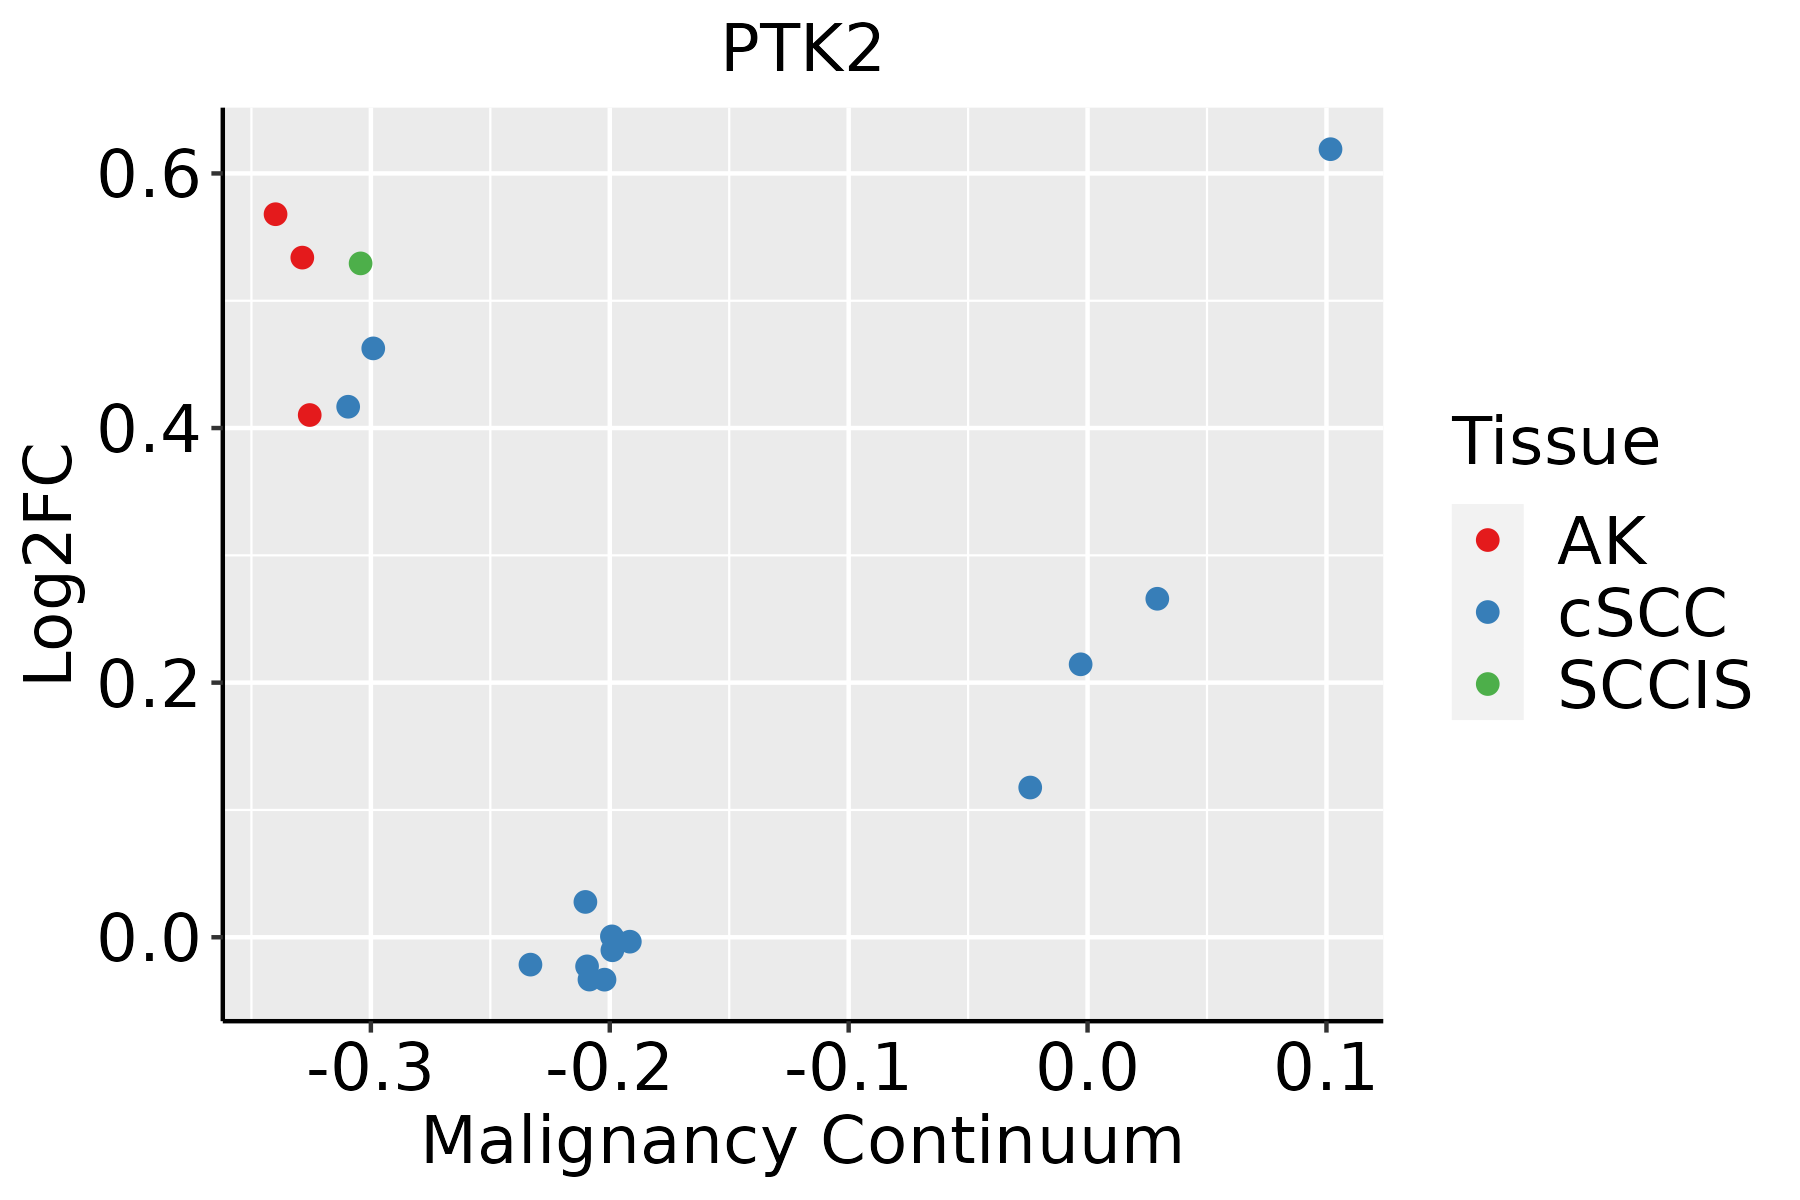 | AK: Actinic keratosis |
| cSCC: Cutaneous squamous cell carcinoma |
| SCCIS:squamous cell carcinoma in situ |
| Thyroid | 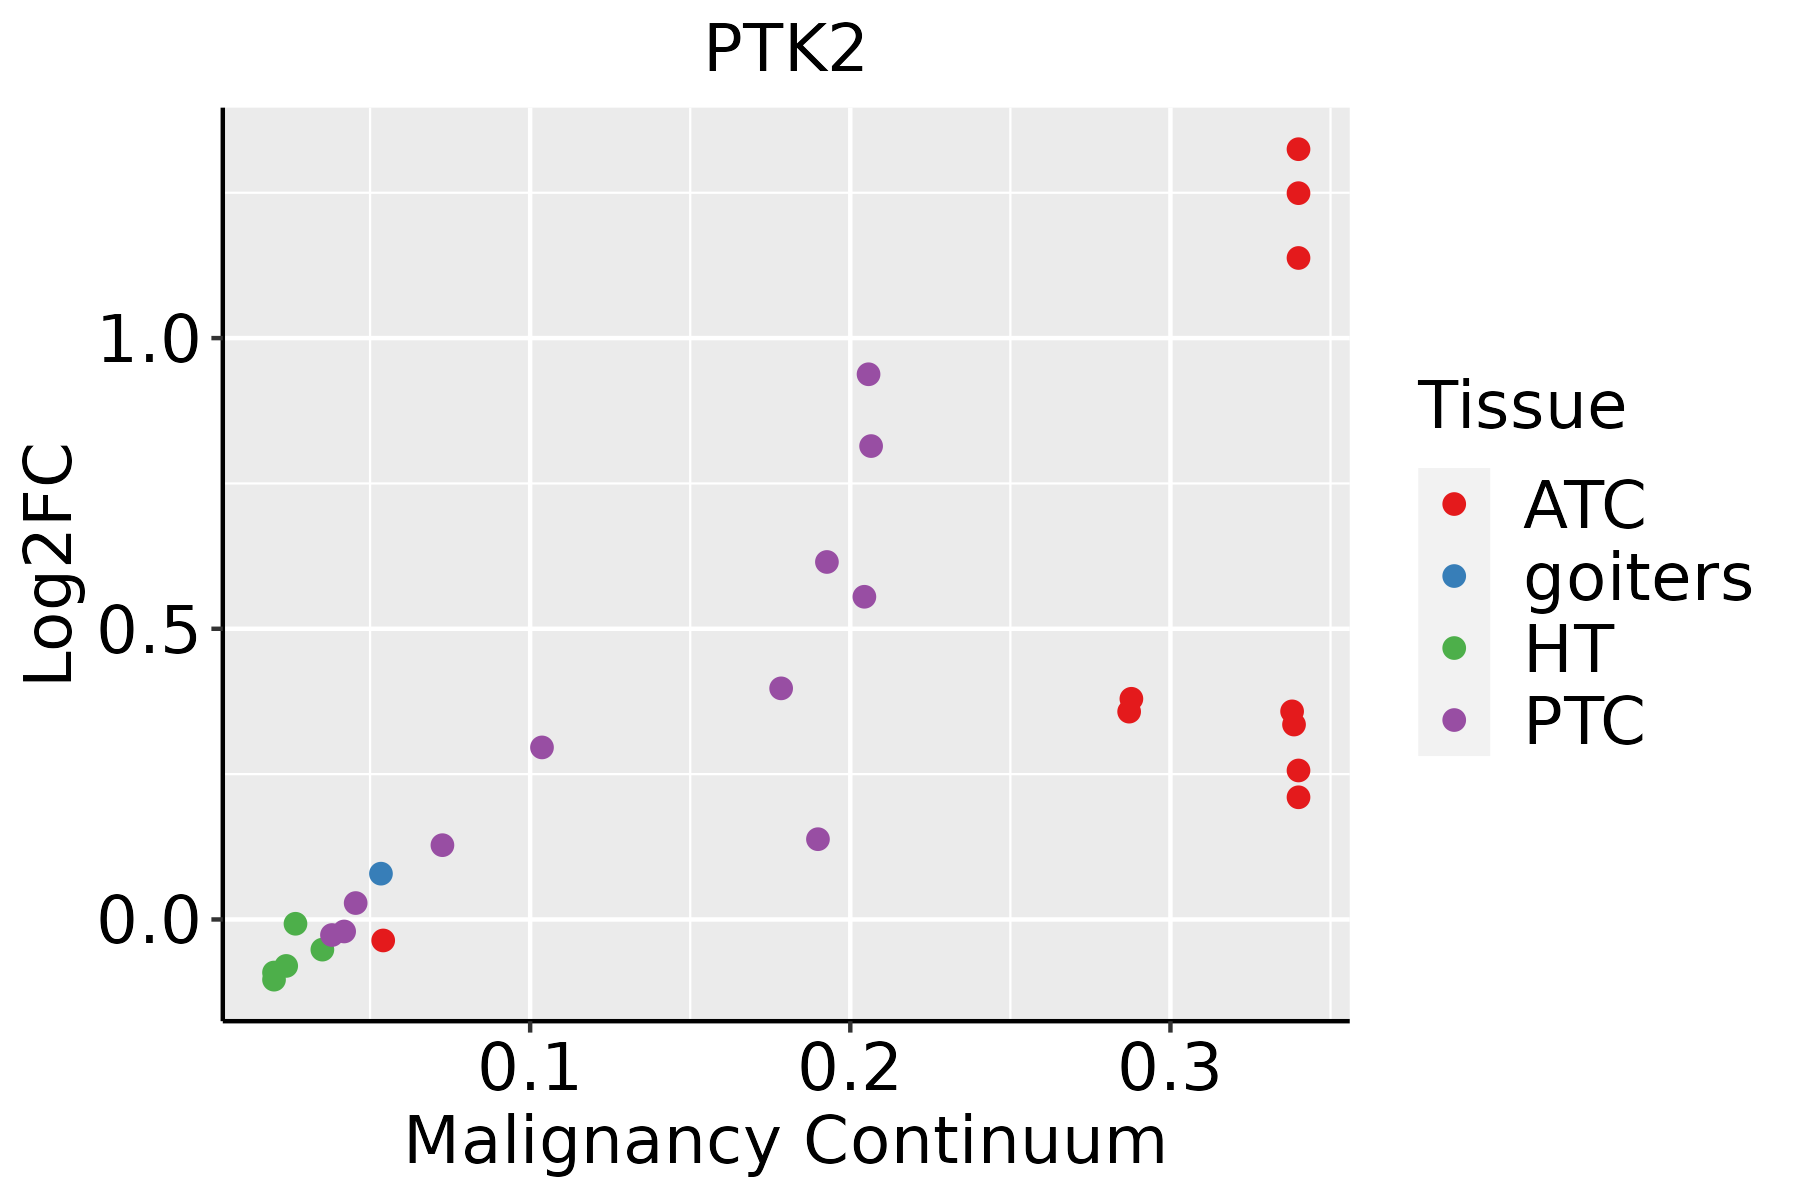 | ATC: Anaplastic thyroid cancer |
| HT: Hashimoto's thyroiditis |
| PTC: Papillary thyroid cancer |
| GO ID | Tissue | Disease Stage | Description | Gene Ratio | Bg Ratio | pvalue | p.adjust | Count |
| GO:00706657 | Oral cavity | OSCC | positive regulation of leukocyte proliferation | 72/7305 | 150/18723 | 1.53e-02 | 4.95e-02 | 72 |
| GO:004325426 | Oral cavity | EOLP | regulation of protein-containing complex assembly | 112/2218 | 428/18723 | 1.58e-16 | 1.35e-13 | 112 |
| GO:000989625 | Oral cavity | EOLP | positive regulation of catabolic process | 118/2218 | 492/18723 | 2.32e-14 | 9.26e-12 | 118 |
| GO:003133125 | Oral cavity | EOLP | positive regulation of cellular catabolic process | 106/2218 | 427/18723 | 4.63e-14 | 1.63e-11 | 106 |
| GO:000276413 | Oral cavity | EOLP | immune response-regulating signaling pathway | 108/2218 | 468/18723 | 4.04e-12 | 7.34e-10 | 108 |
| GO:000641726 | Oral cavity | EOLP | regulation of translation | 108/2218 | 468/18723 | 4.04e-12 | 7.34e-10 | 108 |
| GO:003133424 | Oral cavity | EOLP | positive regulation of protein-containing complex assembly | 67/2218 | 237/18723 | 4.77e-12 | 8.17e-10 | 67 |
| GO:190290326 | Oral cavity | EOLP | regulation of supramolecular fiber organization | 93/2218 | 383/18723 | 6.50e-12 | 1.08e-09 | 93 |
| GO:004586226 | Oral cavity | EOLP | positive regulation of proteolysis | 91/2218 | 372/18723 | 7.08e-12 | 1.15e-09 | 91 |
| GO:004206026 | Oral cavity | EOLP | wound healing | 99/2218 | 422/18723 | 1.18e-11 | 1.85e-09 | 99 |
| GO:000701526 | Oral cavity | EOLP | actin filament organization | 102/2218 | 442/18723 | 1.61e-11 | 2.48e-09 | 102 |
| GO:003009926 | Oral cavity | EOLP | myeloid cell differentiation | 91/2218 | 381/18723 | 2.87e-11 | 4.15e-09 | 91 |
| GO:003297026 | Oral cavity | EOLP | regulation of actin filament-based process | 93/2218 | 397/18723 | 5.39e-11 | 7.03e-09 | 93 |
| GO:003227125 | Oral cavity | EOLP | regulation of protein polymerization | 64/2218 | 233/18723 | 5.54e-11 | 7.07e-09 | 64 |
| GO:190165323 | Oral cavity | EOLP | cellular response to peptide | 85/2218 | 359/18723 | 2.06e-10 | 2.06e-08 | 85 |
| GO:000704417 | Oral cavity | EOLP | cell-substrate junction assembly | 35/2218 | 95/18723 | 2.61e-10 | 2.45e-08 | 35 |
| GO:005125825 | Oral cavity | EOLP | protein polymerization | 74/2218 | 297/18723 | 2.65e-10 | 2.45e-08 | 74 |
| GO:004217626 | Oral cavity | EOLP | regulation of protein catabolic process | 90/2218 | 391/18723 | 2.92e-10 | 2.58e-08 | 90 |
| GO:003295626 | Oral cavity | EOLP | regulation of actin cytoskeleton organization | 84/2218 | 358/18723 | 4.24e-10 | 3.65e-08 | 84 |
| GO:015011524 | Oral cavity | EOLP | cell-substrate junction organization | 36/2218 | 101/18723 | 4.26e-10 | 3.65e-08 | 36 |
| Pathway ID | Tissue | Disease Stage | Description | Gene Ratio | Bg Ratio | pvalue | p.adjust | qvalue | Count |
| hsa0520820 | Cervix | CC | Chemical carcinogenesis - reactive oxygen species | 92/1267 | 223/8465 | 4.71e-22 | 5.09e-20 | 3.01e-20 | 92 |
| hsa0541820 | Cervix | CC | Fluid shear stress and atherosclerosis | 50/1267 | 139/8465 | 5.71e-10 | 1.32e-08 | 7.81e-09 | 50 |
| hsa0541720 | Cervix | CC | Lipid and atherosclerosis | 65/1267 | 215/8465 | 6.47e-09 | 1.10e-07 | 6.52e-08 | 65 |
| hsa0516318 | Cervix | CC | Human cytomegalovirus infection | 65/1267 | 225/8465 | 4.59e-08 | 6.47e-07 | 3.83e-07 | 65 |
| hsa0513120 | Cervix | CC | Shigellosis | 69/1267 | 247/8465 | 7.64e-08 | 1.03e-06 | 6.10e-07 | 69 |
| hsa0520516 | Cervix | CC | Proteoglycans in cancer | 60/1267 | 205/8465 | 9.13e-08 | 1.18e-06 | 7.00e-07 | 60 |
| hsa0451010 | Cervix | CC | Focal adhesion | 59/1267 | 203/8465 | 1.53e-07 | 1.84e-06 | 1.09e-06 | 59 |
| hsa0481016 | Cervix | CC | Regulation of actin cytoskeleton | 64/1267 | 229/8465 | 2.24e-07 | 2.59e-06 | 1.53e-06 | 64 |
| hsa0467020 | Cervix | CC | Leukocyte transendothelial migration | 36/1267 | 114/8465 | 5.22e-06 | 4.83e-05 | 2.86e-05 | 36 |
| hsa0517016 | Cervix | CC | Human immunodeficiency virus 1 infection | 55/1267 | 212/8465 | 1.80e-05 | 1.42e-04 | 8.40e-05 | 55 |
| hsa0401210 | Cervix | CC | ErbB signaling pathway | 28/1267 | 85/8465 | 2.40e-05 | 1.82e-04 | 1.08e-04 | 28 |
| hsa0513516 | Cervix | CC | Yersinia infection | 39/1267 | 137/8465 | 3.27e-05 | 2.41e-04 | 1.42e-04 | 39 |
| hsa052226 | Cervix | CC | Small cell lung cancer | 29/1267 | 92/8465 | 4.38e-05 | 3.09e-04 | 1.83e-04 | 29 |
| hsa043609 | Cervix | CC | Axon guidance | 47/1267 | 182/8465 | 8.13e-05 | 5.38e-04 | 3.18e-04 | 47 |
| hsa051657 | Cervix | CC | Human papillomavirus infection | 74/1267 | 331/8465 | 1.70e-04 | 1.02e-03 | 6.03e-04 | 74 |
| hsa051465 | Cervix | CC | Amoebiasis | 29/1267 | 102/8465 | 3.31e-04 | 1.70e-03 | 1.01e-03 | 29 |
| hsa015223 | Cervix | CC | Endocrine resistance | 28/1267 | 98/8465 | 3.82e-04 | 1.87e-03 | 1.11e-03 | 28 |
| hsa0510020 | Cervix | CC | Bacterial invasion of epithelial cells | 23/1267 | 77/8465 | 6.25e-04 | 2.93e-03 | 1.73e-03 | 23 |
| hsa04062 | Cervix | CC | Chemokine signaling pathway | 43/1267 | 192/8465 | 3.60e-03 | 1.34e-02 | 7.91e-03 | 43 |
| hsa05208110 | Cervix | CC | Chemical carcinogenesis - reactive oxygen species | 92/1267 | 223/8465 | 4.71e-22 | 5.09e-20 | 3.01e-20 | 92 |
| Hugo Symbol | Variant Class | Variant Classification | dbSNP RS | HGVSc | HGVSp | HGVSp Short | SWISSPROT | BIOTYPE | SIFT | PolyPhen | Tumor Sample Barcode | Tissue | Histology | Sex | Age | Stage | Therapy Types | Drugs | Outcome |
| PTK2 | SNV | Missense_Mutation | | c.1688N>T | p.Gly563Val | p.G563V | Q05397 | protein_coding | deleterious(0.01) | probably_damaging(0.998) | TCGA-A2-A0T0-01 | Breast | breast invasive carcinoma | Female | <65 | I/II | Chemotherapy | taxotere | SD |
| PTK2 | SNV | Missense_Mutation | rs542542126 | c.2696N>T | p.Ala899Val | p.A899V | Q05397 | protein_coding | tolerated(0.07) | possibly_damaging(0.652) | TCGA-AC-A23H-01 | Breast | breast invasive carcinoma | Female | >=65 | I/II | Unknown | Unknown | PD |
| PTK2 | SNV | Missense_Mutation | | c.755N>T | p.Arg252Ile | p.R252I | Q05397 | protein_coding | deleterious(0.02) | probably_damaging(0.996) | TCGA-AN-A046-01 | Breast | breast invasive carcinoma | Female | >=65 | I/II | Unknown | Unknown | SD |
| PTK2 | SNV | Missense_Mutation | novel | c.1834A>G | p.Met612Val | p.M612V | Q05397 | protein_coding | tolerated(0.09) | benign(0.001) | TCGA-AR-A0U0-01 | Breast | breast invasive carcinoma | Female | >=65 | I/II | Unknown | Unknown | SD |
| PTK2 | SNV | Missense_Mutation | rs374554975 | c.140G>A | p.Ser47Asn | p.S47N | Q05397 | protein_coding | tolerated_low_confidence(0.21) | benign(0) | TCGA-BH-A18S-01 | Breast | breast invasive carcinoma | Female | >=65 | I/II | Unknown | Unknown | SD |
| PTK2 | SNV | Missense_Mutation | | c.121N>T | p.His41Tyr | p.H41Y | Q05397 | protein_coding | deleterious_low_confidence(0) | probably_damaging(0.998) | TCGA-C8-A1HM-01 | Breast | breast invasive carcinoma | Female | >=65 | I/II | Chemotherapy | doxorubicin | CR |
| PTK2 | SNV | Missense_Mutation | | c.1648N>T | p.Arg550Trp | p.R550W | Q05397 | protein_coding | deleterious(0) | probably_damaging(0.974) | TCGA-D8-A1XK-01 | Breast | breast invasive carcinoma | Female | <65 | I/II | Chemotherapy | doxorubicine+cyclophosphamide | SD |
| PTK2 | SNV | Missense_Mutation | novel | c.1166N>C | p.Val389Ala | p.V389A | Q05397 | protein_coding | tolerated(0.33) | benign(0.412) | TCGA-D8-A73X-01 | Breast | breast invasive carcinoma | Female | <65 | I/II | Hormone Therapy | tamoxiphen | SD |
| PTK2 | SNV | Missense_Mutation | | c.1790N>T | p.Arg597Leu | p.R597L | Q05397 | protein_coding | deleterious(0) | probably_damaging(0.995) | TCGA-E9-A1RA-01 | Breast | breast invasive carcinoma | Female | <65 | I/II | Hormone Therapy | tamoxiphen | SD |
| PTK2 | SNV | Missense_Mutation | | c.1456N>G | p.Leu486Val | p.L486V | Q05397 | protein_coding | deleterious(0) | benign(0.178) | TCGA-E9-A1RH-01 | Breast | breast invasive carcinoma | Female | <65 | I/II | Chemotherapy | 5-fluorouracil | SD |
| Entrez ID | Symbol | Category | Interaction Types | Drug Claim Name | Drug Name | PMIDs |
| 5747 | PTK2 | TYROSINE KINASE, DRUGGABLE GENOME, KINASE, G PROTEIN COUPLED RECEPTOR, ENZYME | | DNDI1417467 | CHEMBL1997335 | |
| 5747 | PTK2 | TYROSINE KINASE, DRUGGABLE GENOME, KINASE, G PROTEIN COUPLED RECEPTOR, ENZYME | | SNS-314 | SNS-314 | |
| 5747 | PTK2 | TYROSINE KINASE, DRUGGABLE GENOME, KINASE, G PROTEIN COUPLED RECEPTOR, ENZYME | inhibitor | CHEMBL1084546 | PF-00562271 | |
| 5747 | PTK2 | TYROSINE KINASE, DRUGGABLE GENOME, KINASE, G PROTEIN COUPLED RECEPTOR, ENZYME | | RG-1530 | RG-1530 | |
| 5747 | PTK2 | TYROSINE KINASE, DRUGGABLE GENOME, KINASE, G PROTEIN COUPLED RECEPTOR, ENZYME | | BI-853520 | BI-853520 | |
| 5747 | PTK2 | TYROSINE KINASE, DRUGGABLE GENOME, KINASE, G PROTEIN COUPLED RECEPTOR, ENZYME | | PF-562271 | PF-00562271 | |
| 5747 | PTK2 | TYROSINE KINASE, DRUGGABLE GENOME, KINASE, G PROTEIN COUPLED RECEPTOR, ENZYME | | PF-04554878 | DEFACTINIB | |
| 5747 | PTK2 | TYROSINE KINASE, DRUGGABLE GENOME, KINASE, G PROTEIN COUPLED RECEPTOR, ENZYME | | GW843682X | GW843682X | |
| 5747 | PTK2 | TYROSINE KINASE, DRUGGABLE GENOME, KINASE, G PROTEIN COUPLED RECEPTOR, ENZYME | inhibitor | CHEMBL3544967 | GSK-2256098 | |
| 5747 | PTK2 | TYROSINE KINASE, DRUGGABLE GENOME, KINASE, G PROTEIN COUPLED RECEPTOR, ENZYME | | 1,2,4-triazolo[1,5a]pyridine derivative 1 | | |


