| Tissue | Expression Dynamics | Abbreviation |
| Cervix |  | CC: Cervix cancer |
| HSIL_HPV: HPV-infected high-grade squamous intraepithelial lesions |
| N_HPV: HPV-infected normal cervix |
| Colorectum (GSE201348) |  | FAP: Familial adenomatous polyposis |
| CRC: Colorectal cancer |
| Colorectum (HTA11) |  | AD: Adenomas |
| SER: Sessile serrated lesions |
| MSI-H: Microsatellite-high colorectal cancer |
| MSS: Microsatellite stable colorectal cancer |
| Endometrium | 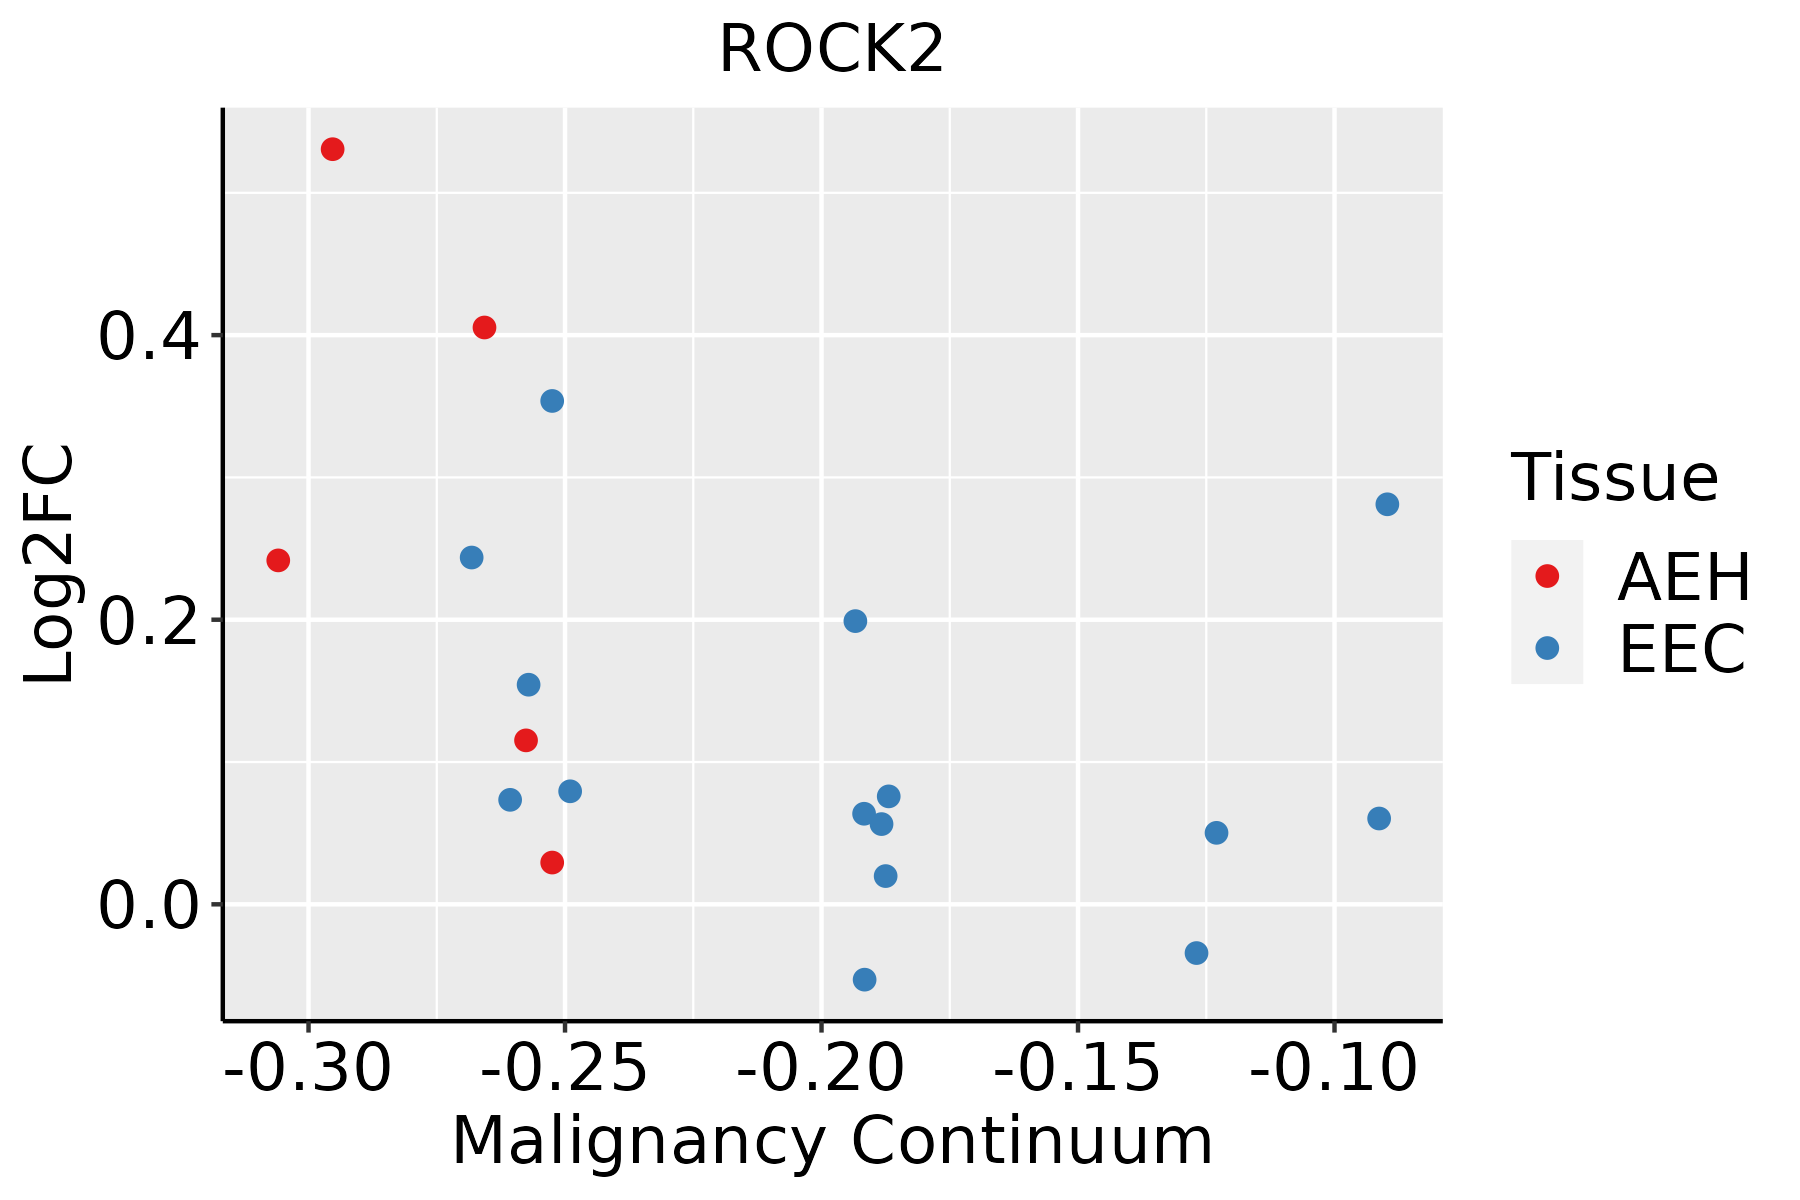 | AEH: Atypical endometrial hyperplasia |
| EEC: Endometrioid Cancer |
| Esophagus | 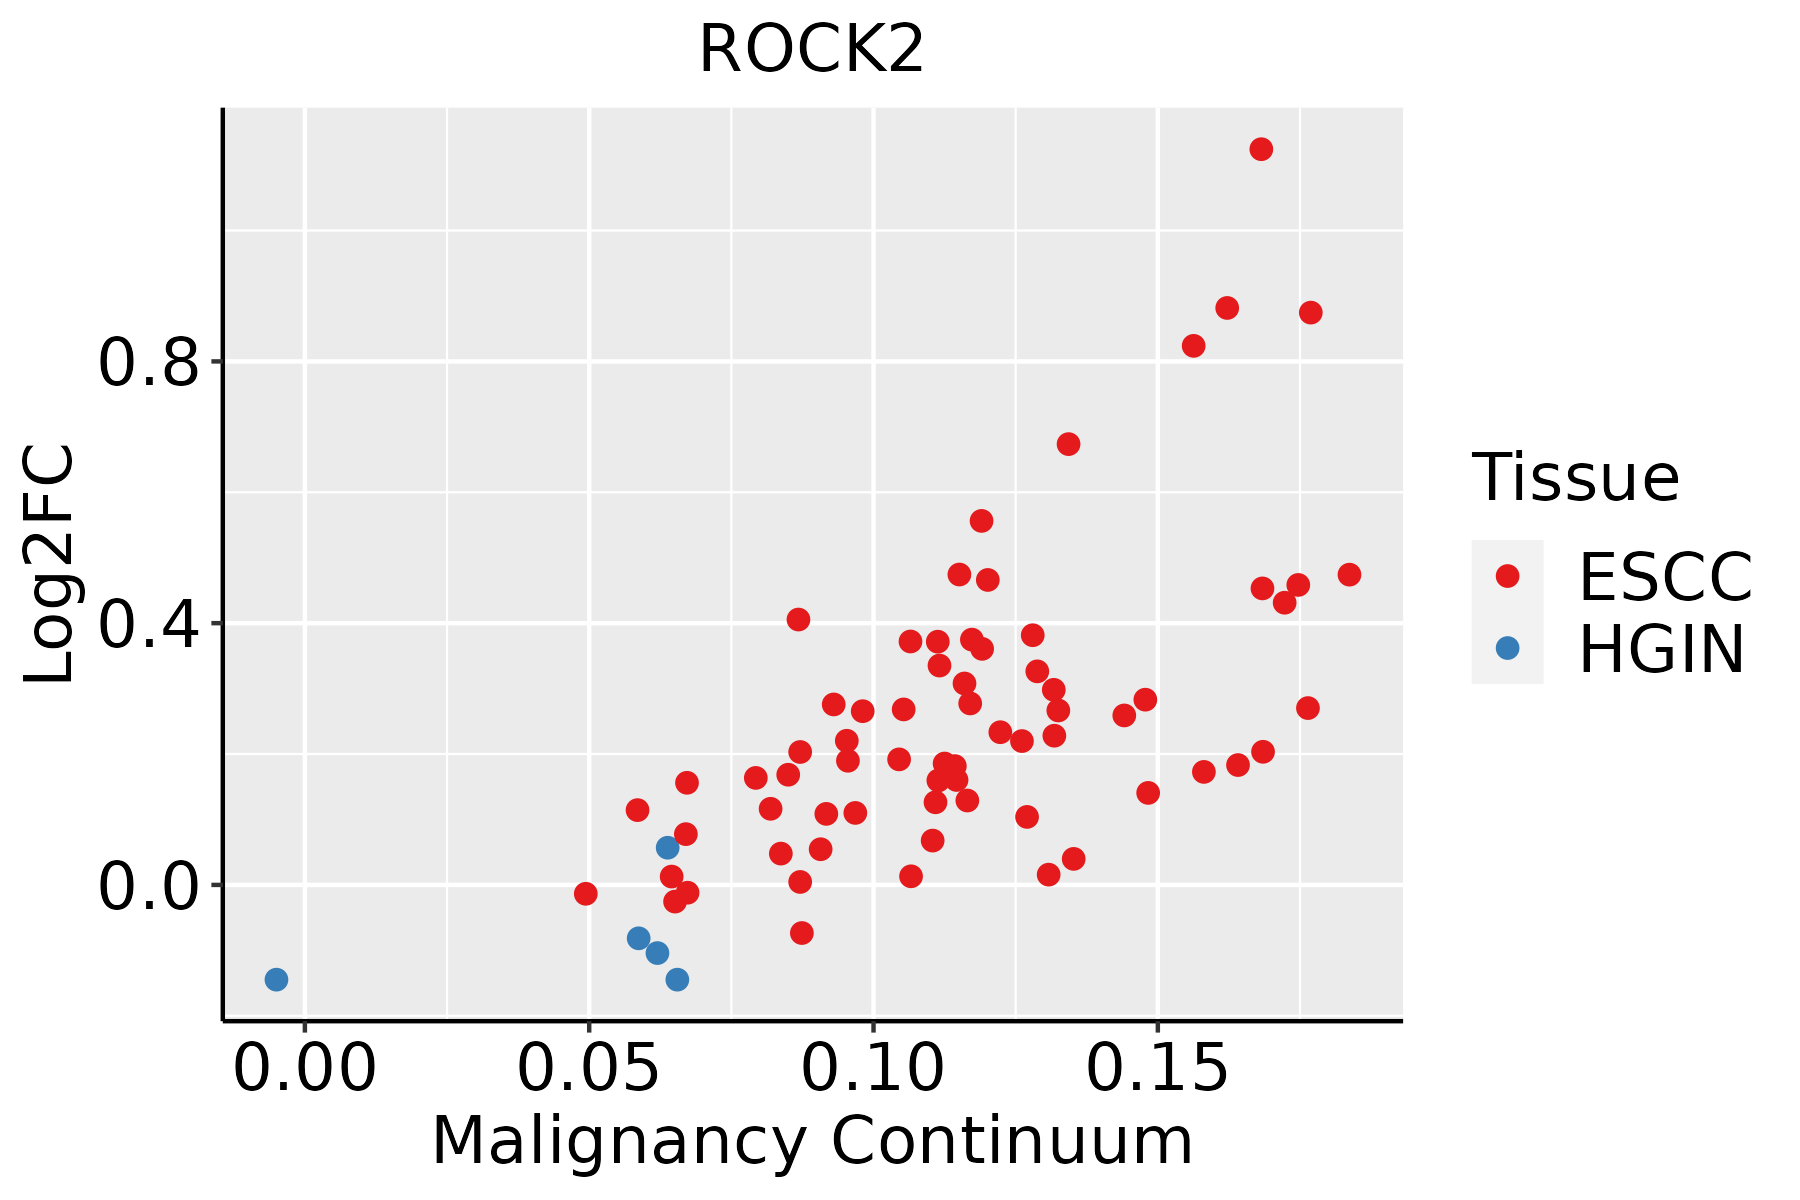 | ESCC: Esophageal squamous cell carcinoma |
| HGIN: High-grade intraepithelial neoplasias |
| LGIN: Low-grade intraepithelial neoplasias |
| Liver | 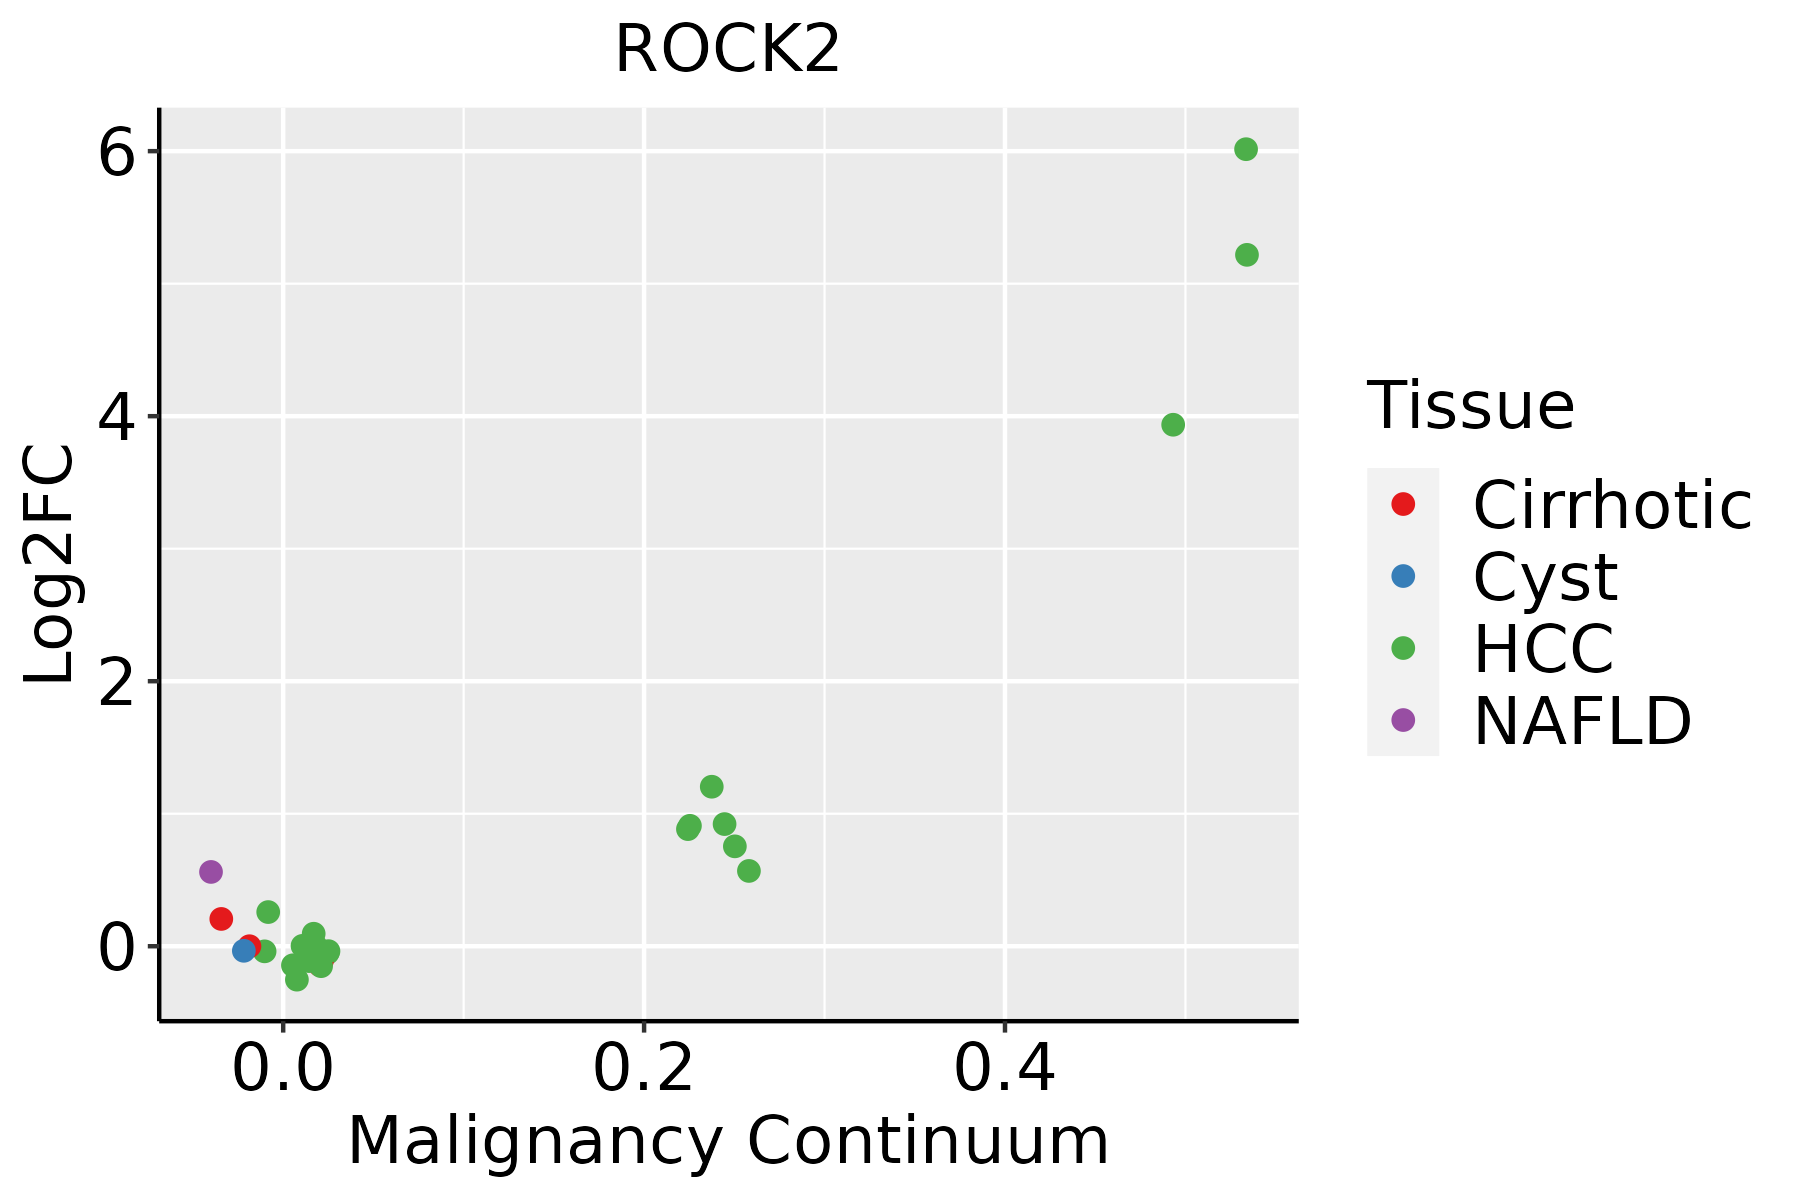 | HCC: Hepatocellular carcinoma |
| NAFLD: Non-alcoholic fatty liver disease |
| Lung | 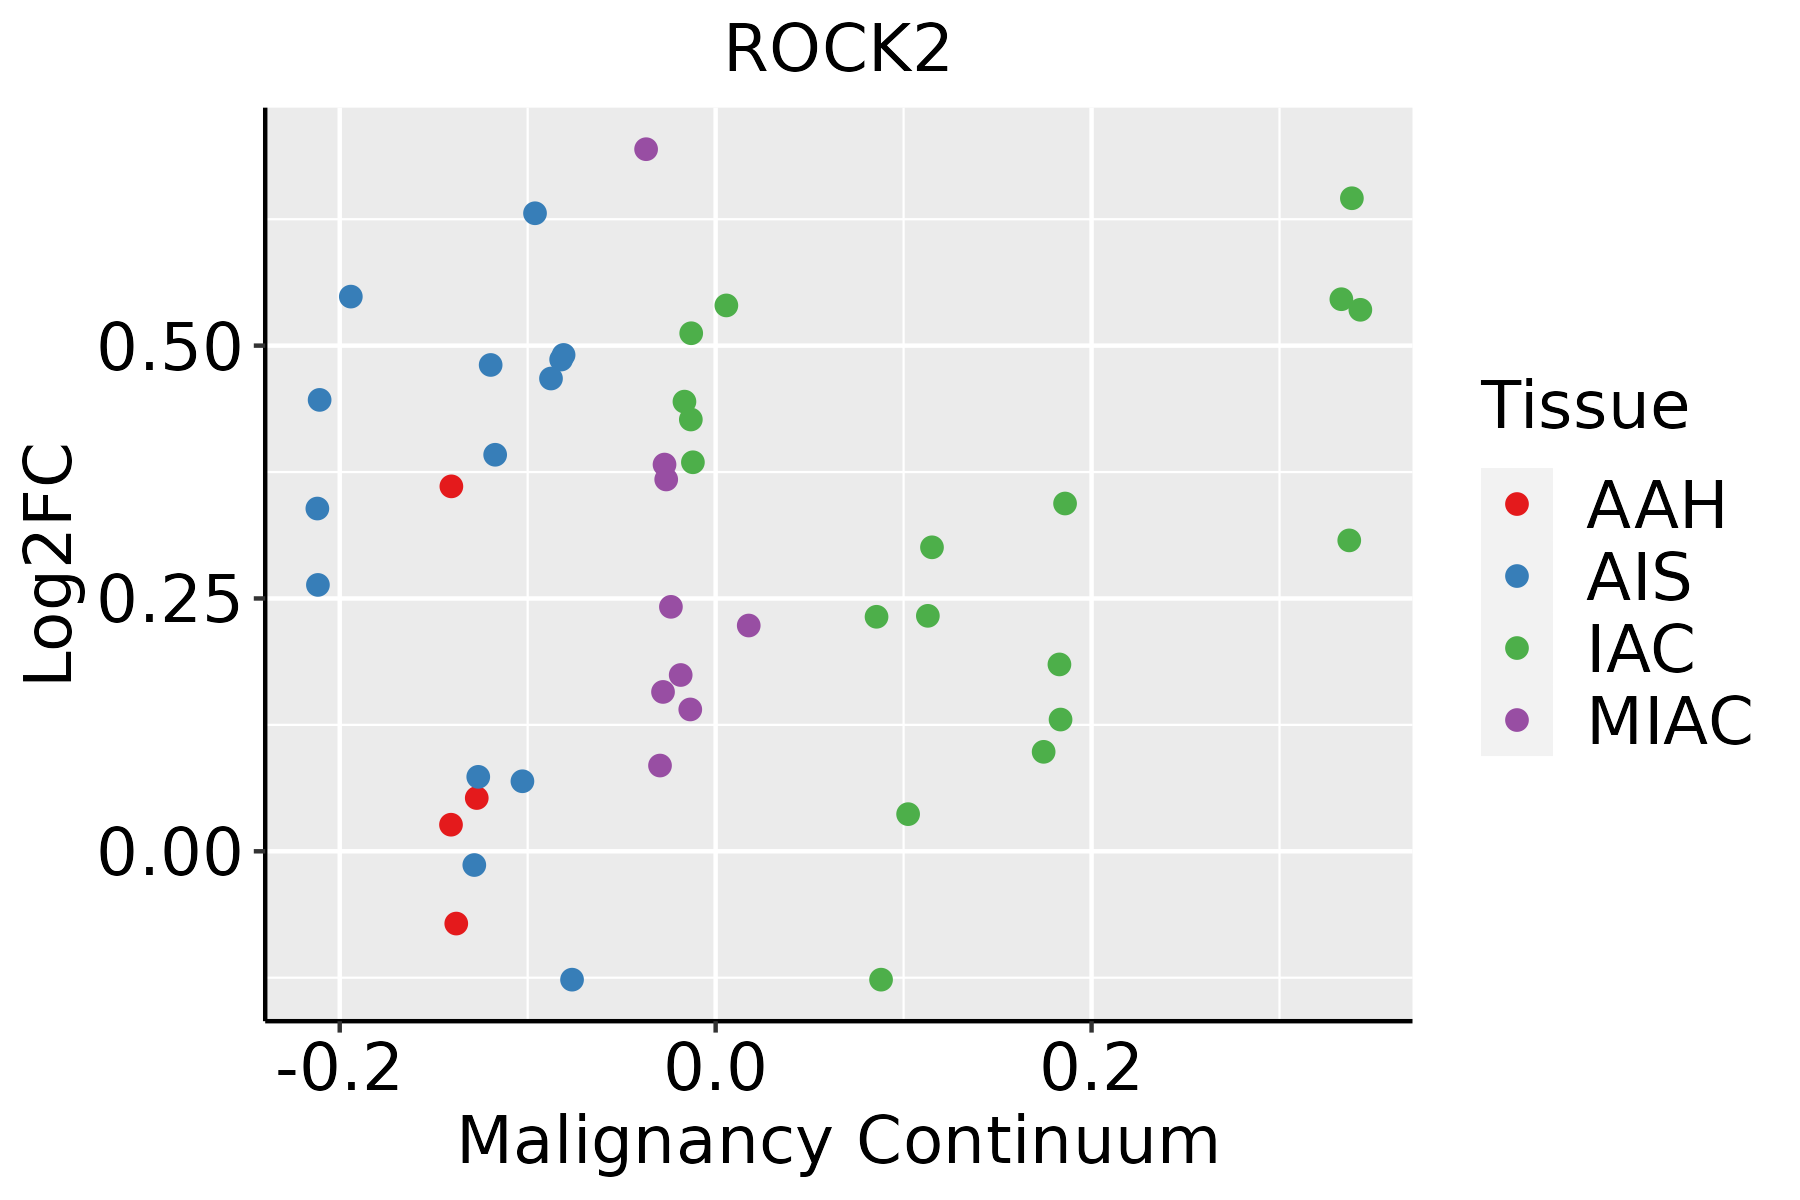 | AAH: Atypical adenomatous hyperplasia |
| AIS: Adenocarcinoma in situ |
| IAC: Invasive lung adenocarcinoma |
| MIA: Minimally invasive adenocarcinoma |
| Prostate | 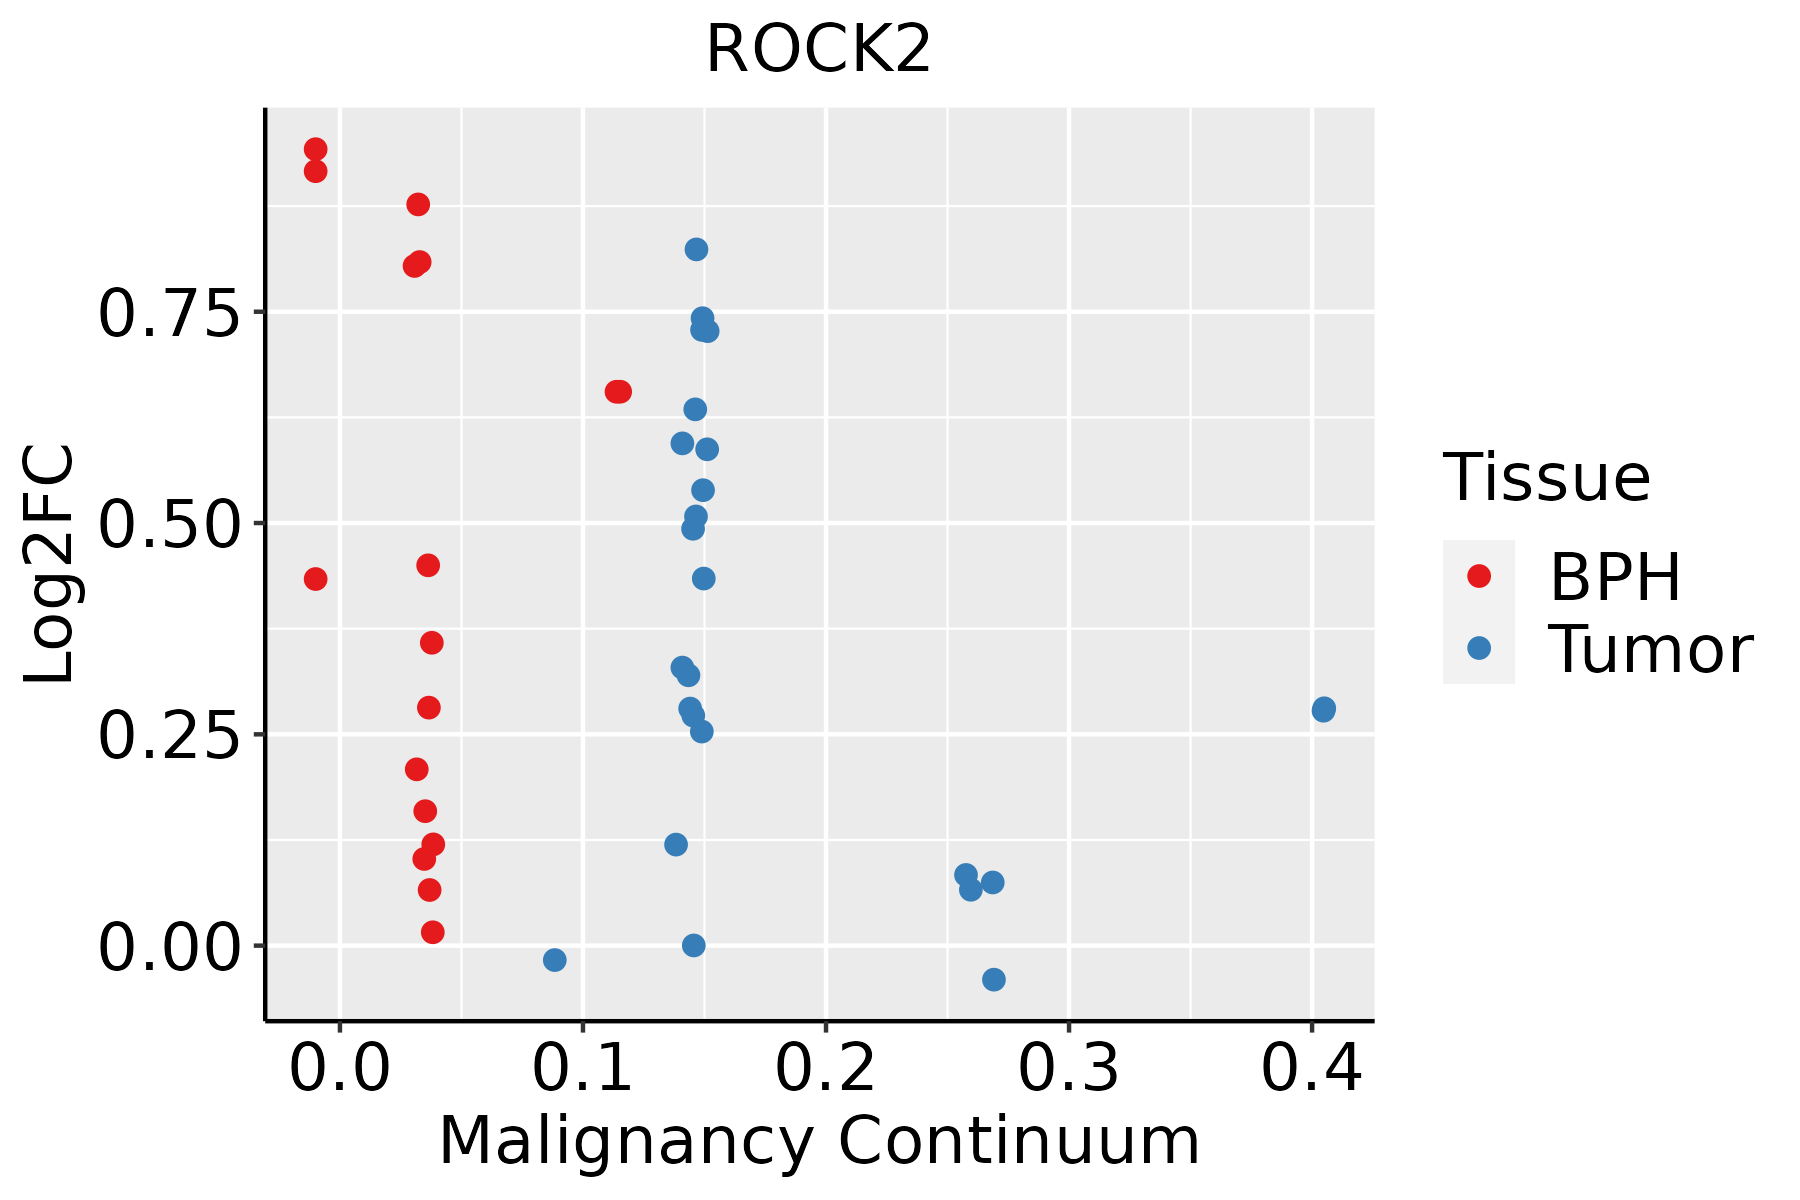 | BPH: Benign Prostatic Hyperplasia |
| Skin | 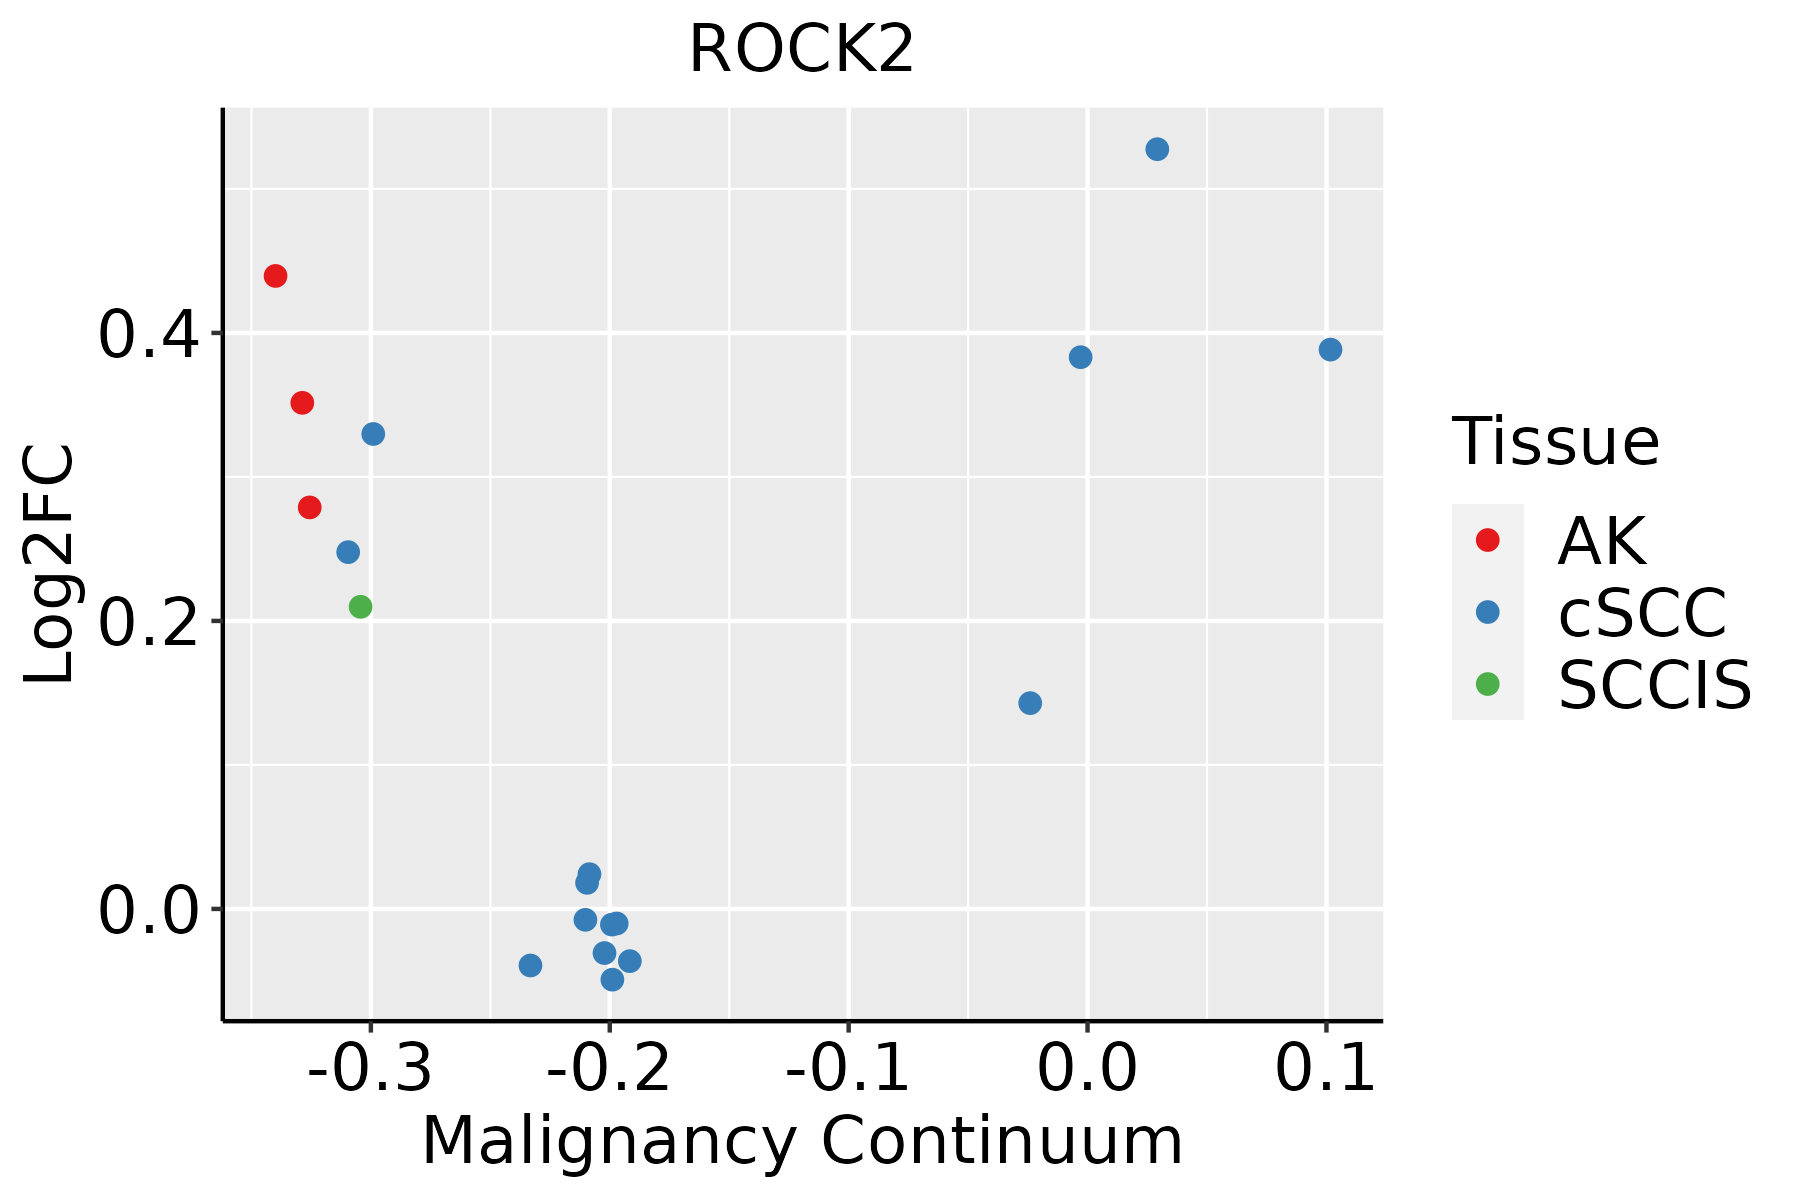 | AK: Actinic keratosis |
| cSCC: Cutaneous squamous cell carcinoma |
| SCCIS:squamous cell carcinoma in situ |
| Thyroid | 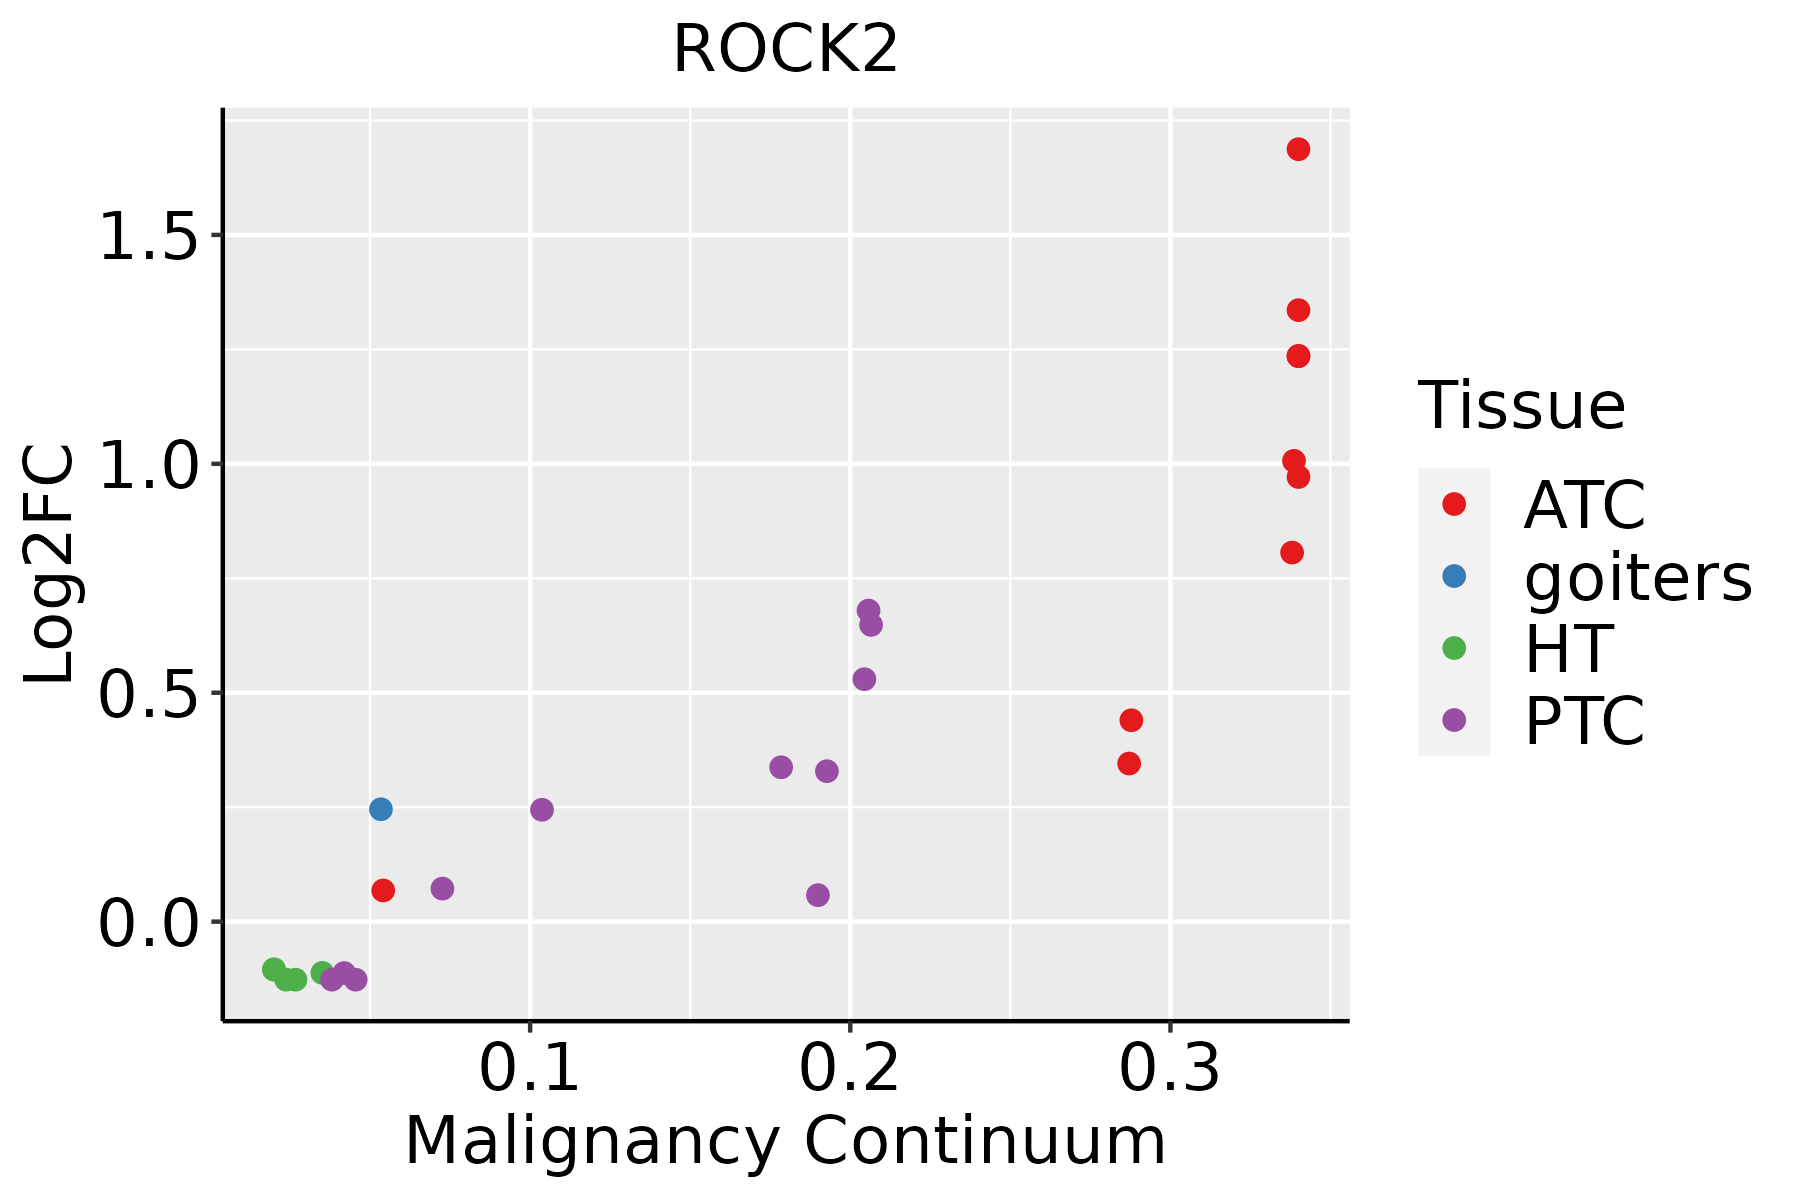 | ATC: Anaplastic thyroid cancer |
| HT: Hashimoto's thyroiditis |
| PTC: Papillary thyroid cancer |
| GO ID | Tissue | Disease Stage | Description | Gene Ratio | Bg Ratio | pvalue | p.adjust | Count |
| GO:000166618 | Prostate | Tumor | response to hypoxia | 90/3246 | 307/18723 | 1.27e-07 | 3.28e-06 | 90 |
| GO:003465516 | Prostate | Tumor | nucleobase-containing compound catabolic process | 112/3246 | 407/18723 | 1.61e-07 | 4.02e-06 | 112 |
| GO:004343418 | Prostate | Tumor | response to peptide hormone | 113/3246 | 414/18723 | 2.24e-07 | 5.42e-06 | 113 |
| GO:004348815 | Prostate | Tumor | regulation of mRNA stability | 54/3246 | 158/18723 | 2.26e-07 | 5.42e-06 | 54 |
| GO:003103216 | Prostate | Tumor | actomyosin structure organization | 63/3246 | 196/18723 | 2.94e-07 | 6.72e-06 | 63 |
| GO:003223118 | Prostate | Tumor | regulation of actin filament bundle assembly | 40/3246 | 105/18723 | 3.34e-07 | 7.55e-06 | 40 |
| GO:001063217 | Prostate | Tumor | regulation of epithelial cell migration | 85/3246 | 292/18723 | 3.91e-07 | 8.63e-06 | 85 |
| GO:003432915 | Prostate | Tumor | cell junction assembly | 113/3246 | 420/18723 | 4.94e-07 | 1.07e-05 | 113 |
| GO:000716015 | Prostate | Tumor | cell-matrix adhesion | 71/3246 | 233/18723 | 5.40e-07 | 1.16e-05 | 71 |
| GO:003085614 | Prostate | Tumor | regulation of epithelial cell differentiation | 52/3246 | 154/18723 | 5.76e-07 | 1.22e-05 | 52 |
| GO:007266514 | Prostate | Tumor | protein localization to vacuole | 29/3246 | 67/18723 | 6.20e-07 | 1.30e-05 | 29 |
| GO:003424912 | Prostate | Tumor | negative regulation of cellular amide metabolic process | 80/3246 | 273/18723 | 6.33e-07 | 1.32e-05 | 80 |
| GO:001095018 | Prostate | Tumor | positive regulation of endopeptidase activity | 58/3246 | 179/18723 | 6.35e-07 | 1.32e-05 | 58 |
| GO:007155915 | Prostate | Tumor | response to transforming growth factor beta | 76/3246 | 256/18723 | 6.86e-07 | 1.40e-05 | 76 |
| GO:011002019 | Prostate | Tumor | regulation of actomyosin structure organization | 38/3246 | 100/18723 | 7.01e-07 | 1.42e-05 | 38 |
| GO:000188514 | Prostate | Tumor | endothelial cell development | 28/3246 | 64/18723 | 7.39e-07 | 1.47e-05 | 28 |
| GO:004670014 | Prostate | Tumor | heterocycle catabolic process | 117/3246 | 445/18723 | 1.11e-06 | 2.10e-05 | 117 |
| GO:007137514 | Prostate | Tumor | cellular response to peptide hormone stimulus | 83/3246 | 290/18723 | 1.14e-06 | 2.16e-05 | 83 |
| GO:004427015 | Prostate | Tumor | cellular nitrogen compound catabolic process | 118/3246 | 451/18723 | 1.30e-06 | 2.39e-05 | 118 |
| GO:003003818 | Prostate | Tumor | contractile actin filament bundle assembly | 39/3246 | 106/18723 | 1.31e-06 | 2.39e-05 | 39 |
| Pathway ID | Tissue | Disease Stage | Description | Gene Ratio | Bg Ratio | pvalue | p.adjust | qvalue | Count |
| hsa0513020 | Cervix | CC | Pathogenic Escherichia coli infection | 63/1267 | 197/8465 | 9.28e-10 | 2.00e-08 | 1.19e-08 | 63 |
| hsa0541720 | Cervix | CC | Lipid and atherosclerosis | 65/1267 | 215/8465 | 6.47e-09 | 1.10e-07 | 6.52e-08 | 65 |
| hsa0516318 | Cervix | CC | Human cytomegalovirus infection | 65/1267 | 225/8465 | 4.59e-08 | 6.47e-07 | 3.83e-07 | 65 |
| hsa0513120 | Cervix | CC | Shigellosis | 69/1267 | 247/8465 | 7.64e-08 | 1.03e-06 | 6.10e-07 | 69 |
| hsa0520516 | Cervix | CC | Proteoglycans in cancer | 60/1267 | 205/8465 | 9.13e-08 | 1.18e-06 | 7.00e-07 | 60 |
| hsa0451010 | Cervix | CC | Focal adhesion | 59/1267 | 203/8465 | 1.53e-07 | 1.84e-06 | 1.09e-06 | 59 |
| hsa0481016 | Cervix | CC | Regulation of actin cytoskeleton | 64/1267 | 229/8465 | 2.24e-07 | 2.59e-06 | 1.53e-06 | 64 |
| hsa0452020 | Cervix | CC | Adherens junction | 33/1267 | 93/8465 | 6.99e-07 | 7.31e-06 | 4.32e-06 | 33 |
| hsa0453020 | Cervix | CC | Tight junction | 49/1267 | 169/8465 | 1.87e-06 | 1.78e-05 | 1.05e-05 | 49 |
| hsa0467020 | Cervix | CC | Leukocyte transendothelial migration | 36/1267 | 114/8465 | 5.22e-06 | 4.83e-05 | 2.86e-05 | 36 |
| hsa0513516 | Cervix | CC | Yersinia infection | 39/1267 | 137/8465 | 3.27e-05 | 2.41e-04 | 1.42e-04 | 39 |
| hsa0407110 | Cervix | CC | Sphingolipid signaling pathway | 35/1267 | 121/8465 | 5.70e-05 | 3.93e-04 | 2.32e-04 | 35 |
| hsa043609 | Cervix | CC | Axon guidance | 47/1267 | 182/8465 | 8.13e-05 | 5.38e-04 | 3.18e-04 | 47 |
| hsa043109 | Cervix | CC | Wnt signaling pathway | 43/1267 | 171/8465 | 3.03e-04 | 1.64e-03 | 9.68e-04 | 43 |
| hsa04062 | Cervix | CC | Chemokine signaling pathway | 43/1267 | 192/8465 | 3.60e-03 | 1.34e-02 | 7.91e-03 | 43 |
| hsa049218 | Cervix | CC | Oxytocin signaling pathway | 34/1267 | 154/8465 | 1.12e-02 | 3.42e-02 | 2.02e-02 | 34 |
| hsa046115 | Cervix | CC | Platelet activation | 28/1267 | 124/8465 | 1.50e-02 | 4.45e-02 | 2.63e-02 | 28 |
| hsa05130110 | Cervix | CC | Pathogenic Escherichia coli infection | 63/1267 | 197/8465 | 9.28e-10 | 2.00e-08 | 1.19e-08 | 63 |
| hsa05417110 | Cervix | CC | Lipid and atherosclerosis | 65/1267 | 215/8465 | 6.47e-09 | 1.10e-07 | 6.52e-08 | 65 |
| hsa0516319 | Cervix | CC | Human cytomegalovirus infection | 65/1267 | 225/8465 | 4.59e-08 | 6.47e-07 | 3.83e-07 | 65 |
| Hugo Symbol | Variant Class | Variant Classification | dbSNP RS | HGVSc | HGVSp | HGVSp Short | SWISSPROT | BIOTYPE | SIFT | PolyPhen | Tumor Sample Barcode | Tissue | Histology | Sex | Age | Stage | Therapy Types | Drugs | Outcome |
| ROCK2 | SNV | Missense_Mutation | novel | c.3226N>C | p.Lys1076Gln | p.K1076Q | O75116 | protein_coding | deleterious(0) | probably_damaging(0.946) | TCGA-AN-A046-01 | Breast | breast invasive carcinoma | Female | >=65 | I/II | Unknown | Unknown | SD |
| ROCK2 | SNV | Missense_Mutation | rs747260728 | c.1715N>A | p.Arg572Gln | p.R572Q | O75116 | protein_coding | tolerated(0.38) | benign(0.065) | TCGA-AN-A046-01 | Breast | breast invasive carcinoma | Female | >=65 | I/II | Unknown | Unknown | SD |
| ROCK2 | SNV | Missense_Mutation | | c.3560N>A | p.Ser1187Asn | p.S1187N | O75116 | protein_coding | tolerated(0.16) | benign(0.097) | TCGA-AN-A0FL-01 | Breast | breast invasive carcinoma | Female | <65 | I/II | Unknown | Unknown | SD |
| ROCK2 | SNV | Missense_Mutation | | c.4091G>C | p.Arg1364Thr | p.R1364T | O75116 | protein_coding | deleterious(0.01) | benign(0.041) | TCGA-AR-A0TX-01 | Breast | breast invasive carcinoma | Female | <65 | I/II | Unknown | Unknown | SD |
| ROCK2 | SNV | Missense_Mutation | | c.1849N>C | p.Glu617Gln | p.E617Q | O75116 | protein_coding | tolerated(0.34) | benign(0.083) | TCGA-BH-A0HP-01 | Breast | breast invasive carcinoma | Female | >=65 | III/IV | Chemotherapy | doxorubicin | SD |
| ROCK2 | SNV | Missense_Mutation | novel | c.2329N>C | p.Glu777Gln | p.E777Q | O75116 | protein_coding | tolerated(0.67) | benign(0.028) | TCGA-PE-A5DE-01 | Breast | breast invasive carcinoma | Female | <65 | I/II | Chemotherapy | taxotere | CR |
| ROCK2 | SNV | Missense_Mutation | novel | c.186N>C | p.Leu62Phe | p.L62F | O75116 | protein_coding | deleterious(0.02) | probably_damaging(0.95) | TCGA-XX-A89A-01 | Breast | breast invasive carcinoma | Female | >=65 | I/II | Unknown | Unknown | SD |
| ROCK2 | insertion | Nonsense_Mutation | novel | c.2665_2666insCAATTTAACTATAATCCAA | p.Glu889AlafsTer3 | p.E889Afs*3 | O75116 | protein_coding | | | TCGA-AR-A0U0-01 | Breast | breast invasive carcinoma | Female | >=65 | I/II | Unknown | Unknown | SD |
| ROCK2 | SNV | Missense_Mutation | novel | c.712A>C | p.Lys238Gln | p.K238Q | O75116 | protein_coding | deleterious(0) | probably_damaging(0.929) | TCGA-2W-A8YY-01 | Cervix | cervical & endocervical cancer | Female | <65 | I/II | Chemotherapy | cisplatin | CR |
| ROCK2 | SNV | Missense_Mutation | | c.2719N>A | p.Glu907Lys | p.E907K | O75116 | protein_coding | deleterious(0) | probably_damaging(0.957) | TCGA-DR-A0ZM-01 | Cervix | cervical & endocervical cancer | Female | <65 | III/IV | Unspecific | Cisplatin | SD |
| Entrez ID | Symbol | Category | Interaction Types | Drug Claim Name | Drug Name | PMIDs |
| 9475 | ROCK2 | KINASE, ENZYME, DRUGGABLE GENOME, SERINE THREONINE KINASE | inhibitor | 178102655 | | |
| 9475 | ROCK2 | KINASE, ENZYME, DRUGGABLE GENOME, SERINE THREONINE KINASE | | AR-12286 | VEROSUDIL | |
| 9475 | ROCK2 | KINASE, ENZYME, DRUGGABLE GENOME, SERINE THREONINE KINASE | | BAY-613606 | CHEMBL541400 | |
| 9475 | ROCK2 | KINASE, ENZYME, DRUGGABLE GENOME, SERINE THREONINE KINASE | | AST-487 | AST-487 | |
| 9475 | ROCK2 | KINASE, ENZYME, DRUGGABLE GENOME, SERINE THREONINE KINASE | | THROMBIN | THROMBIN | 16720831 |
| 9475 | ROCK2 | KINASE, ENZYME, DRUGGABLE GENOME, SERINE THREONINE KINASE | inhibitor | 178101973 | | |
| 9475 | ROCK2 | KINASE, ENZYME, DRUGGABLE GENOME, SERINE THREONINE KINASE | | KD025 | | |
| 9475 | ROCK2 | KINASE, ENZYME, DRUGGABLE GENOME, SERINE THREONINE KINASE | | VER-49009 | CHEMBL365617 | |
| 9475 | ROCK2 | KINASE, ENZYME, DRUGGABLE GENOME, SERINE THREONINE KINASE | | Tricyclic compound 4 | | |
| 9475 | ROCK2 | KINASE, ENZYME, DRUGGABLE GENOME, SERINE THREONINE KINASE | inhibitor | 310264692 | VEROSUDIL | |


